
On August 24, 2026, EuroDry closed at $51.73. Fifteen trading sessions earlier it had closed at $25.18. That 105.4% gain was its steepest three-week rise since the stock’s long advance began the previous September. Suppose you bought in August and still owned 41 shares after an earlier partial sale. How many would you put up for sale the next morning?
Six trading sessions after its own breakout, Hasbro also looked like the sort of winner you would hate to sell too soon. William O’Neil and Mark Minervini would have looked back at how each stock reached that point before deciding what to do.
Where did the run begin?
O’Neil’s advice to “hop off the elevator on one of the floors on the way up” comes from Chapter 11 of How to Make Money in Stocks. In that same chapter he made an exception for a leader that gained 20% in one to three weeks out of a sound base. He would give it at least eight weeks from its buy point before reassessing. We start that clock on the breakout date and measure the 20% gain from the pivot price. His 8% loss limit runs from the actual purchase price. In The Successful Investor, he also stresses the quality of the company, its industry and the strength of the bull market.
Minervini asks a different question in Section 9 of Think & Trade Like a Champion. After a stock has already advanced for months, does it suddenly rise more steeply than it has at any earlier point? He describes late runs of 25% to 50% or more in one to three weeks as an occasion to sell some or all into strength. As he puts it later in the same section, “if you don’t sell early, you’re going to sell late.” AlpharvestPro’s October 17 Momentum Masters story draws on a different passage from the same book, about accepting a worthwhile gain even if the stock goes higher. Read the October 17 story (select EN).
In the Momentum Masters roundtable, Dan Zanger says, “Sell on the way up into strength and volume.” He explains that if he owns a large position or the stock trades thinly, a burst of volume during a rally makes it easier to find buyers for his shares. He finds it harder to sell on a down day, even when volume is heavy. Asked in the same roundtable what he does with a decent profit, Minervini describes selling half when he’s torn about holding. He banks a gain on the shares he sells and still has a stake if the rally continues.
EuroDry had two clocks running
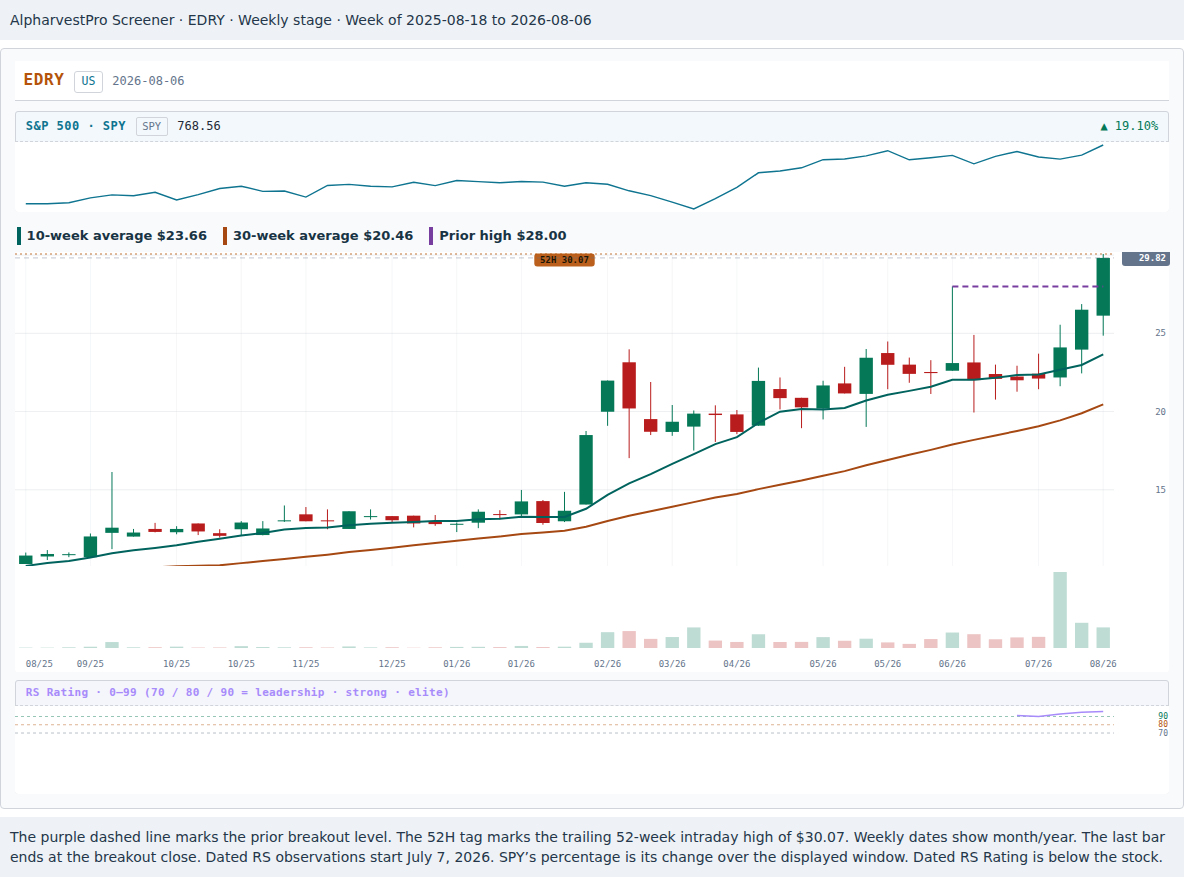
EuroDry’s (EDRY) 30-week average had been rising since the week of September 8, 2025. By August 6, 2026, the 10-week average was $23.66 and the 30-week was $20.46. Inside that long advance, a fresh base had formed. EDRY hit $28.00 on June 15, dropped to $19.94 on June 22 and held a higher low of $22.44 on July 27. It appeared on the app’s Minervini Trend Template (≥8 of 10) watchlist that day. The base was about seven and a half weeks old at the breakout. The advance underneath it was nearly a year old.
On August 6 the dry-bulk shipowner reported second-quarter revenue of $17.7 million, up 57% from a year earlier, and diluted earnings of $2.32 a share after a year-earlier loss. It also disclosed a signed term sheet to refinance a vessel, subject to final documentation. Market Compass read Confirmed Uptrend. The app’s Transportation-Ship group ranked 30th, inside the top 50 we look for, and EDRY’s own RS Rating was 96. The stock closed above the base at $29.82 on 1.73 times its average volume over the preceding 50 sessions. EuroDry’s quarterly release
The next open was $30.54, already 9.1% above the buy point. Under the series rule, an opening more than 5% above the pivot cuts the risk-based size in half. O’Neil wanted a purchase close to the pivot. A buyer applying his 5% limit would have passed at this open. With a $40,000 account and a $400 risk budget, our series simulation bought 81 shares for $2,473.74. The 8% stop at $28.10 put $197.64 at risk before slippage. On August 10, a standing order sold 40 shares at $36.65, 20% above cost. That banked $244.40 and raised the stop on the remaining 41 shares to $30.54. EuroDry’s thin trading also mattered to anyone sizing a larger order. The earlier EuroDry liquidity case
EuroDry had also appeared on Qullamaggie Breakout Setup, AlpharvestPro’s watchlist modeled on Kristjan Kullamägi’s setup, on July 31 and August 4. His own plan looks for an entry as the stock breaks out, with a stop at the day’s low. After three to five days he sells one-third to one-half and moves the stop on the rest to breakeven. That banks part of any early gain. He gives the remaining shares room to run by trailing them with the 10- or 20-day moving average, depending on the stock’s speed. Our ledger illustrates a different order. The series waited for the next open to buy, then sold its first 40 shares at a fixed target on the very next trading day. Kullamägi’s original breakout instructions
The two rules already disagreed on August 7. That day’s $34.72 close was 24% above the $28.00 pivot, one session after the breakout. A holder who qualified for O’Neil’s exception and committed to it in advance would keep the full position, with the 8% protective stop, until the October 1 review. The 41-share examples below follow a different commitment. They start with the series partial already banked. You have to choose between those plans before the partial order fills.
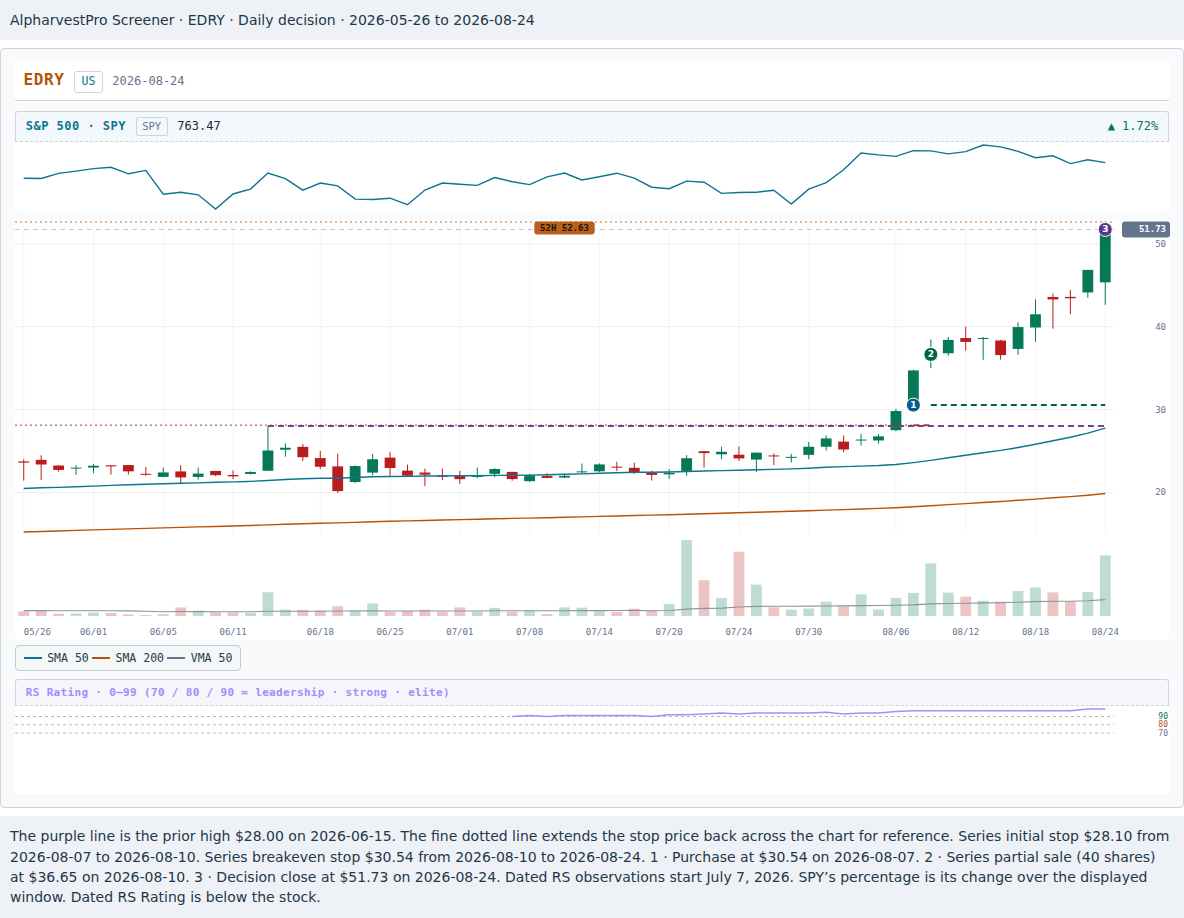
Stop at the August 24 close. The base was recent enough for O’Neil’s early-strength test, yet the nearly year-old advance had just accelerated faster than at any earlier point in that trend. On the 41 shares still held under the series plan, would you sell some at the next open or wait for evidence that buyers had stepped away?
See the price available the next morning
EuroDry opened August 25 at $52.12. All 41 shares could be modeled at that price, or you could keep some exposure. The September comparison below shows what happened to a holder who waited.
Five weeks after the purchase
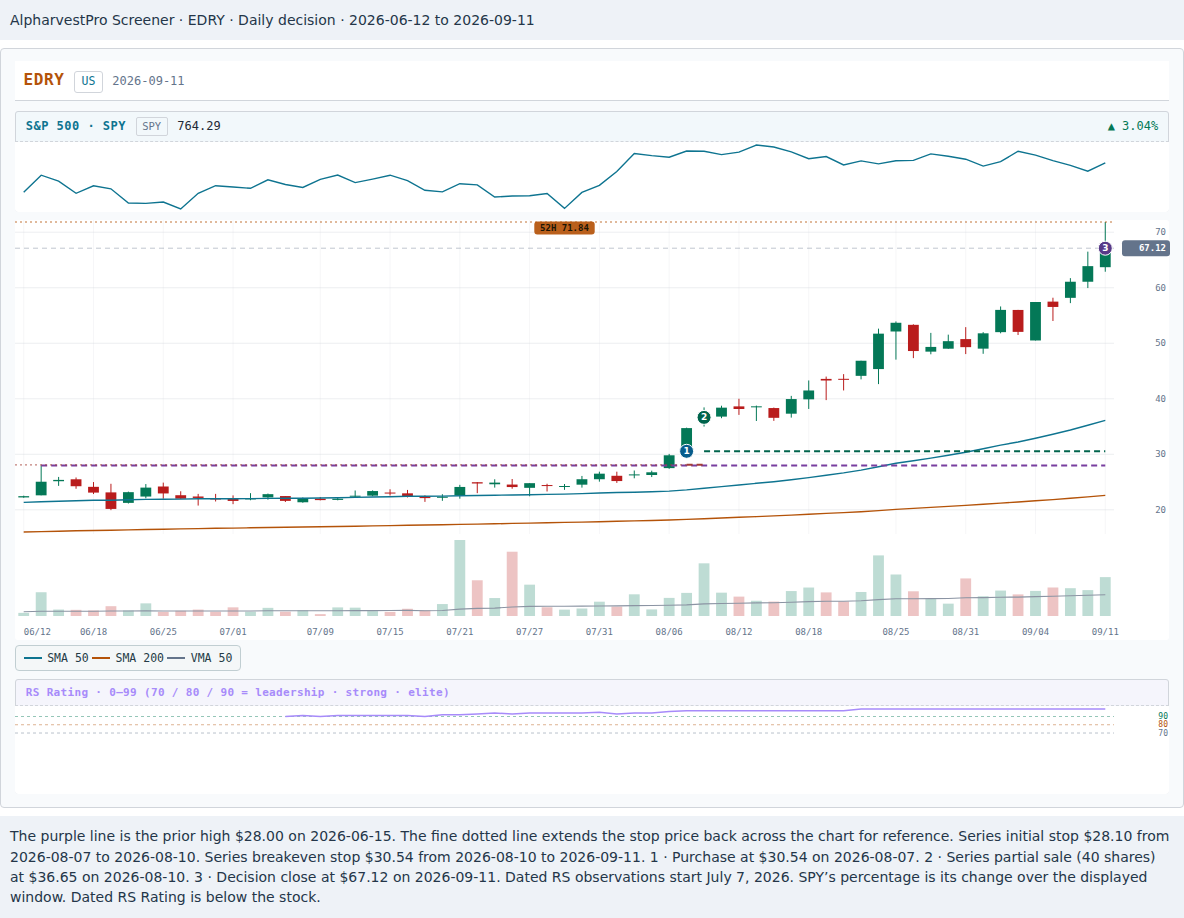
By Friday, September 11, EDRY closed at $67.12, up 29.8% in the 13 sessions since August 24. Over the last 15 trading sessions it was up 54.5% from the August 20 close of $43.43. Those two extra sessions also count in August’s 105.4% run. With the cash already banked, the trade showed a $1,744.18 gain at Friday’s close.
In Momentum Masters, David Ryan gives the example of a stock that gains 30% in three weeks after rising for more than a year. At that point, he says, “I would definitely start selling.” EuroDry’s measured advance had just passed the one-year mark. Its latest rise was slower than August’s record pace, but a holder still had a reason to trim. The September 11 Market Compass report read Uptrend Under Pressure before Monday’s open.
What would you do with the 41 shares? You can sell all at the next open, sell 20 there and keep 21, or keep all 41 until the first heavy-volume break. For this comparison, a break means a close at least 5% below the previous close, below the previous session’s low, on at least 1.5 times the preceding 50-session average volume. We model the break sale at the next open. Every share still held has the breakeven stop. Pick a plan before opening the result.
Open EuroDry’s next eight trading sessions
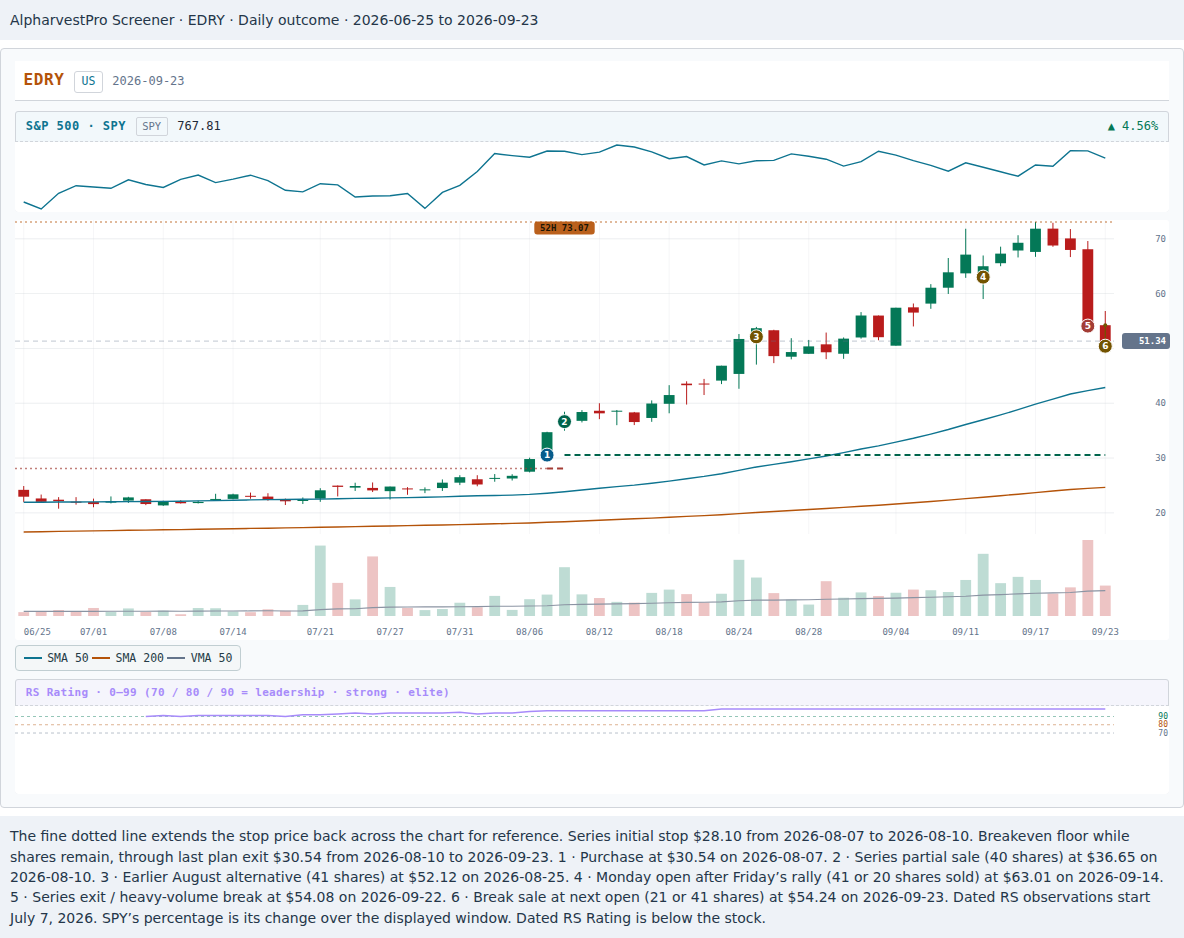
Monday, September 14, opened at $63.01, down 6.1% from Friday’s close. Friday’s rally prompted the sale, but anyone waiting for the closing chart had missed the chance to sell into Friday’s buying. By Monday’s open the 41 shares had already given back $168.51. Then EDRY rallied again. At the September 17 close of $71.85, the 41 shares sold on Monday would have been worth another $362.44. Every close from September 14 through September 21 was above the $63.01 sale price.
On September 22 the stock fell 20.4%, to $54.08, on 465,300 shares, 3.23 times its prior 50-session average. It closed below the previous day’s low. The break plan sold at the September 23 open of $54.24.
| Plan for the 41 remaining shares | September 14 at $63.01 | Later shares and fill | Total realized profit | Given back from September 11 |
|---|---|---|---|---|
| Sell all at Monday’s open | 41 | None | $1,575.67 | $168.51 |
| Sell 20 at Monday’s open | 20 | 21 at $54.24 | $1,391.50 | $352.68 |
| Wait for the break | 0 | 41 at $54.24 | $1,216.10 | $528.08 |
| Ordinary series exit | 0 | 41 at $54.08 | $1,209.54 | $534.64 |
Each total includes the same $244.40 from August. After the partial, the ordinary series plan watches daily percentage changes from one close to the next. It sells the balance at the first close that sets a new record decline for the Stage 2 advance. September 22 broke June 22’s previous record decline of 12.7%. The $54.08 close is the series’ bookkeeping assumption. A trader waiting for confirmed closing data had the next open of $54.24. The two rules fired on the same day. The $6.56 difference comes entirely from the fill.
Selling 20 shares at the September 14 open brought the trade’s realized profit to $893.80, including the August sale. The remaining 21 participated in Thursday’s rally. When the stock broke on September 22, those were the only shares still exposed to the drop. AlpharvestPro’s October 25 Momentum Masters story quotes Minervini’s warning in Think & Trade Like a Champion about treating gains as “the market’s money” while they are still at risk. Read the October 25 story on protecting open profits (select EN).
Selling all 41 in September kept $359.57 more than waiting for the break. Move the decision back to the steeper August rally and the answer reverses. Selling the same shares at the August 25 open of $52.12 would have realized $1,129.18 in all, the smallest of the five EuroDry profits and $86.92 less than waiting for the September break. The steepest rise gave the trader a reason to consider selling. It also came weeks before the highest close in this comparison. For someone who had bought near the pivot and chosen O’Neil’s eight-week hold, EuroDry closed at $55.73 on the October 1 review date.
Hasbro was six sessions out of a base
Ryan also explains why he leaves room for a young leader. In the September 26 Momentum Masters story, AlpharvestPro quotes his observation from the roundtable that the best stocks “usually end up going a lot further than anyone expects.” He would give the first advance out of a long base more time. How much room would you give a stock breaking out of a seven-week base with the market already under pressure? Read the September 26 story on Ryan’s price targets (select EN).
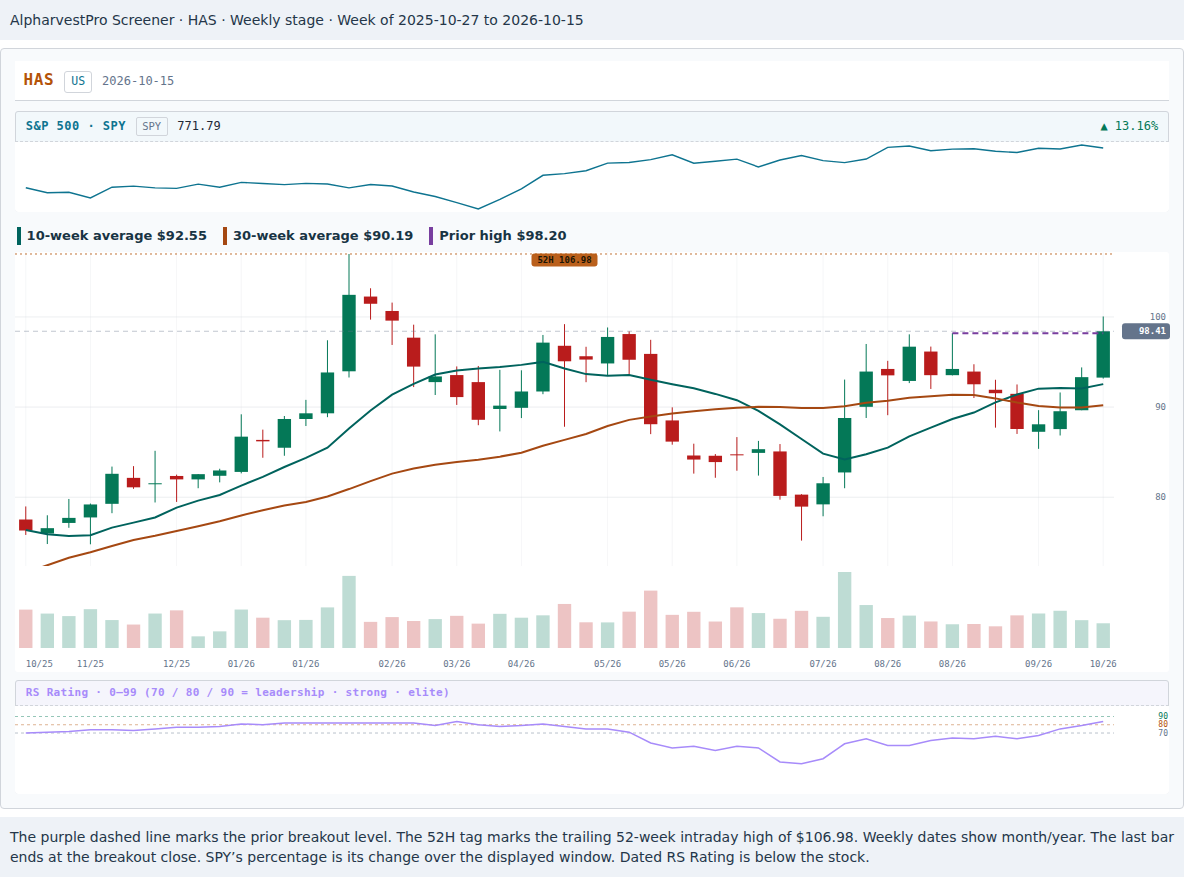
Hasbro (HAS) spent seven weeks working back toward its August 26 high of $98.20. It fell to $85.37 on September 24, then held $86.85 on October 1. By the breakout, the 10-week average stood at $92.55 and the 30-week at $90.19. HAS appeared on both the Stage 2 Initiation (Weinstein) and Minervini Trend Template (≥8 of 10) lists on October 5. The October 14 snapshot also showed it on the Trend Template. Those are watchlist dates. To measure declines for the series exit, we start with the first week after the 30-week average last fell. For Hasbro that clock started the week of October 12. On October 15 the app’s Leisure-Toys/Games/Hobby group ranked seventh, HAS had an RS Rating of 84 and Market Compass read Uptrend Under Pressure. The series permits a purchase in that state. O’Neil’s preference for a strong bull market in The Successful Investor was already a reason for caution.
Hasbro had reported 16% sales growth and $1.12 in diluted earnings per share for the second quarter. The new Marvel Super Heroes set helped drive Magic: The Gathering sales above $500 million for the quarter. The October 20 earnings date was public before the purchase, so a buyer faced a scheduled event that could gap through the stop. Hasbro’s July results · October earnings announcement
Using Nasdaq’s as-traded prices, the October 15 close of $98.41 cleared the $98.20 pivot on 1.52 times normal volume. It was still about 8% below the trailing 52-week high of $106.98. At the October 16 open of $98.53, the same account could buy 50 shares for $4,926.50. The $90.65 stop put $394.00 at risk. On October 20 Hasbro reported 15% sales growth and $2.77 in diluted earnings per share for the third quarter. The stock gained 11.2% that day. By Friday, October 23, it closed at $117.44. Nasdaq price history · Hasbro’s October results
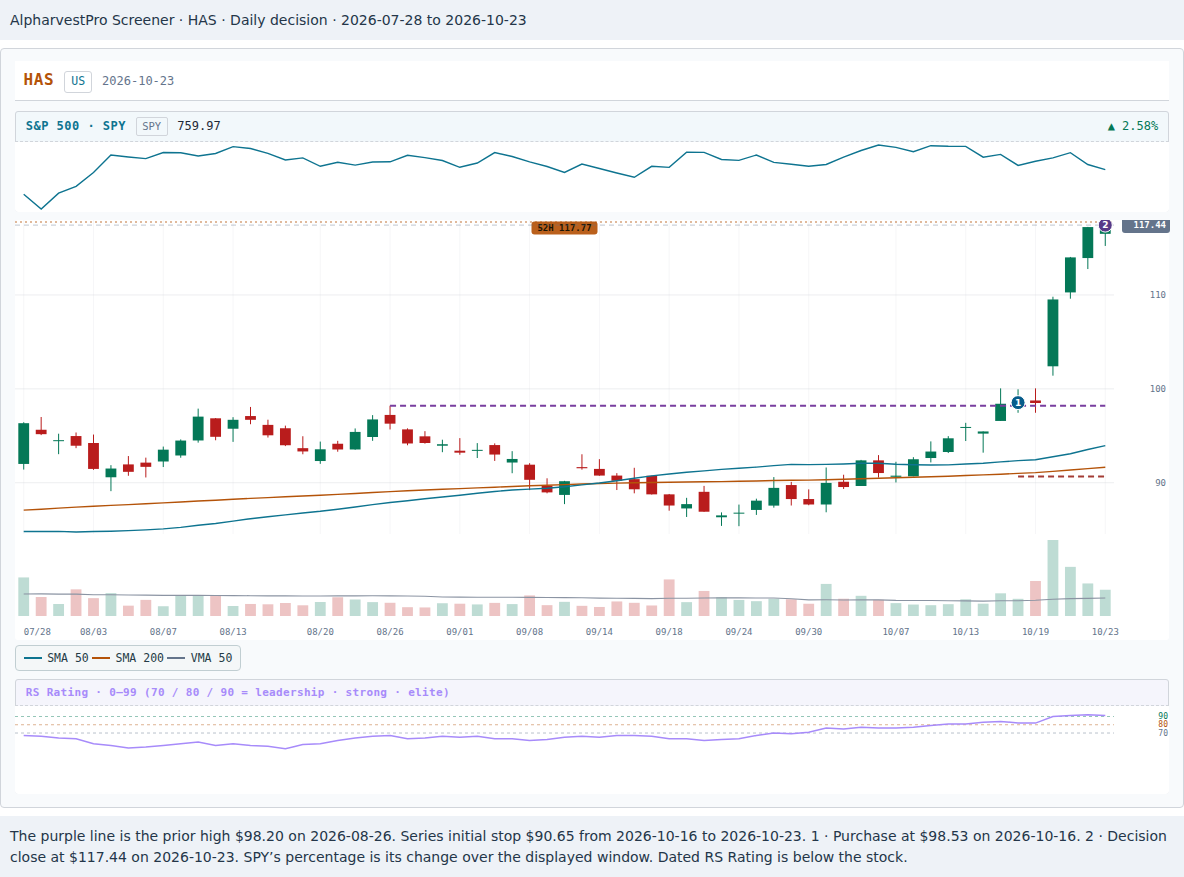
Which order would you leave in place over the weekend? For O’Neil’s early-strength test, 20% over the $98.20 pivot was $117.84. We count the first trade at or above that price, including an opening gap. For the ordinary series partial, 20% over the $98.53 purchase was $118.24. You could keep the standing order to sell 25 shares, or cancel it before the next open and hold all 50 with the $90.65 stop if the pivot test fired. The October 23 Market Compass report read Market in Correction before Monday’s open. The weaker market further undermined the case for a full O’Neil hold. We can still test the price rule on shares already owned. A new series purchase was ruled out. If the price test expired untriggered on November 5, the alternative would restore its ordinary partial order for the next session.
Open Hasbro’s two plans through November 19
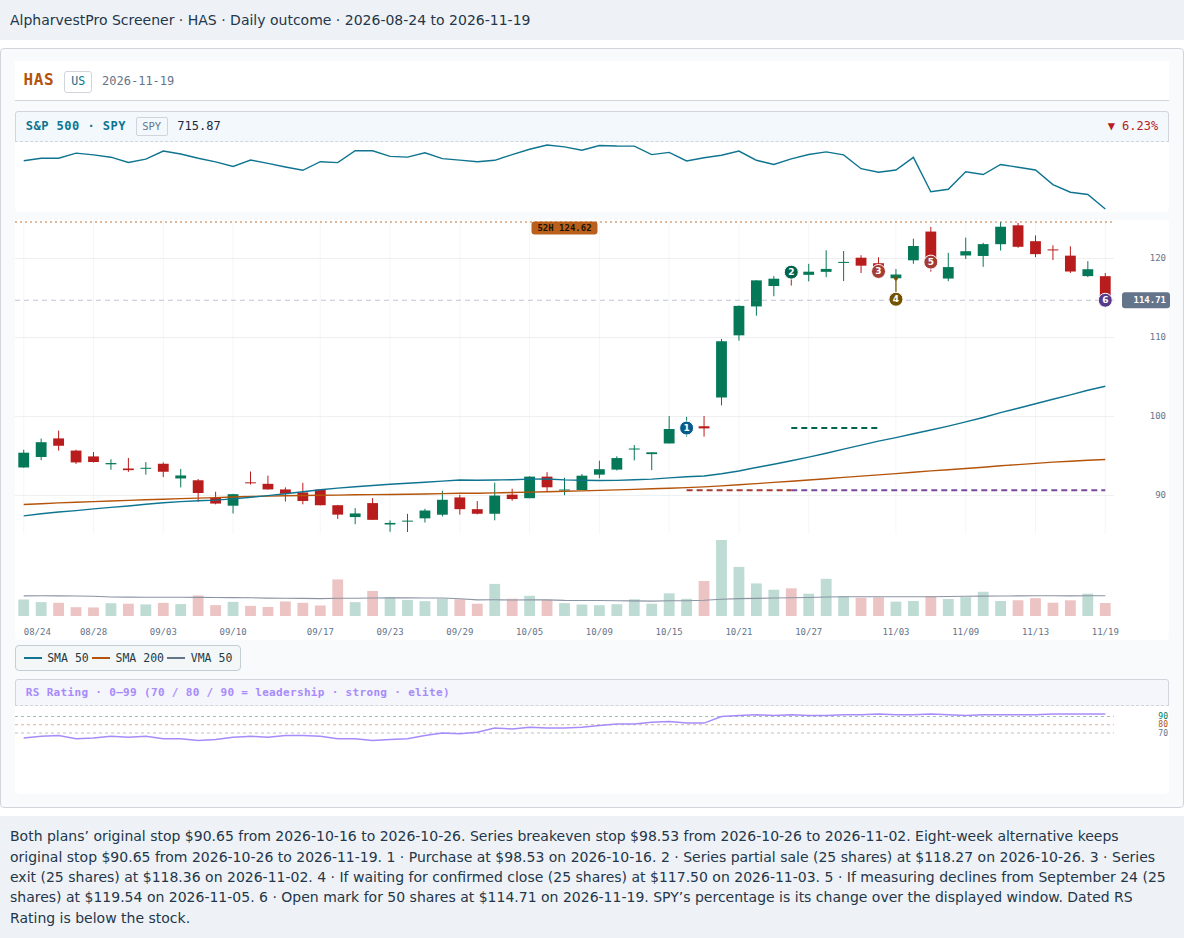
Monday, October 26, opened at $118.27, above both thresholds. The standing limit order sold 25 shares at the better opening price. The ordinary plan raised the stop on the remaining 25 to $98.53. On November 2, HAS dipped 0.61%. Our stage clock had started only three sessions before the breakout, so an ordinary down day exceeded the previous 0.50% decline. The series booked the other 25 at the $118.36 close, for $989.25 realized across both sales. Waiting for the confirmed close gave the November 3 open of $117.50 and $967.75 realized. To see how much the date matters, start measuring declines at the September 24 base low instead. The same rule then first fired at the November 5 close of $119.54, for $1,018.75 realized across both sales.
The alternative kept all 50 shares. By November 19 they closed at $114.71, leaving $809.00 in open price profit. The original stop had held. Eight weeks from October 15 runs to December 10. November 19 is the latest settled session in the dated screener chart used here, so the eight-week result is still open. The price comparison excludes the $0.70 per-share dividend. The 50-share holder qualified for $35.00 on the November 18 record date, payable December 2. Hasbro’s historical prices · Dividend declaration
Before you change a sell order
On the AlpharvestPro weekly chart, mark the start of the sustained rise and the high of the most recent base. On the daily chart, count the sessions from the breakout and measure the gain from the pivot. Then check Market Compass and the company’s next reporting date. The dated lists tell you when a stock came into view. The decision belongs to the holder.
These are two retrospectively selected, hypothetical positions. The comparisons use whole shares and prices before dividends, fees, taxes and slippage. A gap can take a stop out below its stated price. For the next winner on your screen, write down how many shares you’d willingly sell if buyers bid it up again. For every share you choose to keep, what would make you sell if those buyers stepped away? Case notes and chart data · The series selling rules
