
A losing trade has one honest exit: the stop you wrote down before buying. A winning trade has no such line. Sell, and the next advance makes the decision look timid. Hold, and a pullback makes the peak feel like money you misplaced.
Mark Minervini titles one passage of Think and Trade Like a Champion “You Will Always Sell Too Soon or Too Late,” and he does not soften it: “if you don’t sell early, you’re going to sell late.” Nobody sells the top on purpose. The real question is which mistake your plan accepts in advance.
The winners have to carry the losers
Neither William O’Neil nor Minervini expects to be right most of the time; our watchlist article quotes both. That is exactly why selling winners matters. In How to Make Money in Stocks, O’Neil’s own plan was to “take 20% profits when you have them (except with the most powerful of all stocks)” and to cut losses at a maximum of 8%. Its advantage, he wrote: “You could be wrong twice and right once and still not get into financial trouble.”
Put numbers on it with the position used below: 95 shares, $4.17 of risk on each. One +20% winner makes $991.80. Two 8% losers cost $792.30. The three trades net $199.50 before costs. If the winner shrinks to about +16% before you sell, they net nothing. With a low hit rate, the part of the winner you do not give back is what keeps the method alive.
Two rules, written before the stock moves
O’Neil: sell at +20% while the stock is still advancing, with one exception. If a stock is “so powerful that it vaulted 20% in only one, two, or three weeks,” it “must be held for at least eight weeks from its buy point,” then re-examined. The 8% loss limit still applies.
Minervini: start with a fixed stop. Once the rising 50-day moving average catches up with the purchase price, use that average as the stop instead: his “breakeven or better” rule. He waits for a close below it, and “sometimes I try to give it until Friday to see how the stock closes the week.” Separately, once a stock is up two or three times the initial risk, he may sell half and “free roll” the rest. “I love to hear the cash register ring.”
The two rules can disagree about the same stock. That is fine. What matters is choosing one before the stock starts making the argument for you.
PBF Energy: the plan on July 8
PBF Energy (NYSE: PBF) was on VCP Setup (Minervini) on July 7, 2026, the first night of AlpharvestPro’s dated screening record, with RS 87 and a Minervini trend-template Score of 10 out of 10. Its 52-week high was $52.18, set on March 30.
On July 8 it traded through that high and closed at $52.90, 1.4% above it, on volume 49% above its 50-session average. That is a hair under the 50% O’Neil prefers, close enough that many traders would act. SPY closed 0.8% above a rising 50-day average. This is the plan a purchase at the buy point needed, written that day:
| Line | PBF, bought at the buy point on July 8 |
|---|---|
| Buy point | $52.18, the March 30 high |
| Initial stop | $48.01, 8% below: O’Neil’s maximum loss |
| Size | Hypothetical $40,000 account risking 1% ($400): $4.17 per share, so 95 shares, $4,957.10, about 12% of the account |
| +20% line | $62.62 |
| Twice the risk (2R) | $60.52 |
| How much it may give back | Pick one in advance: O’Neil’s +20% sale or eight-week hold, or Minervini’s switch to the 50-day |
The first selling decision arrived quickly. On July 14 the high reached $61.02, past 2R. On July 17 it reached $63.60, past +20%, seven sessions after the purchase. Under O’Neil’s exception, that speed meant holding until at least September 2. Under Minervini’s free roll, half could have been sold at $60.52.
On July 30, the day PBF reported second-quarter results, the stock jumped 15% to a high of $74.74. At that close, the hypothetical position showed $1,987.40 of open profit. Six sessions later, more than half of it was gone.
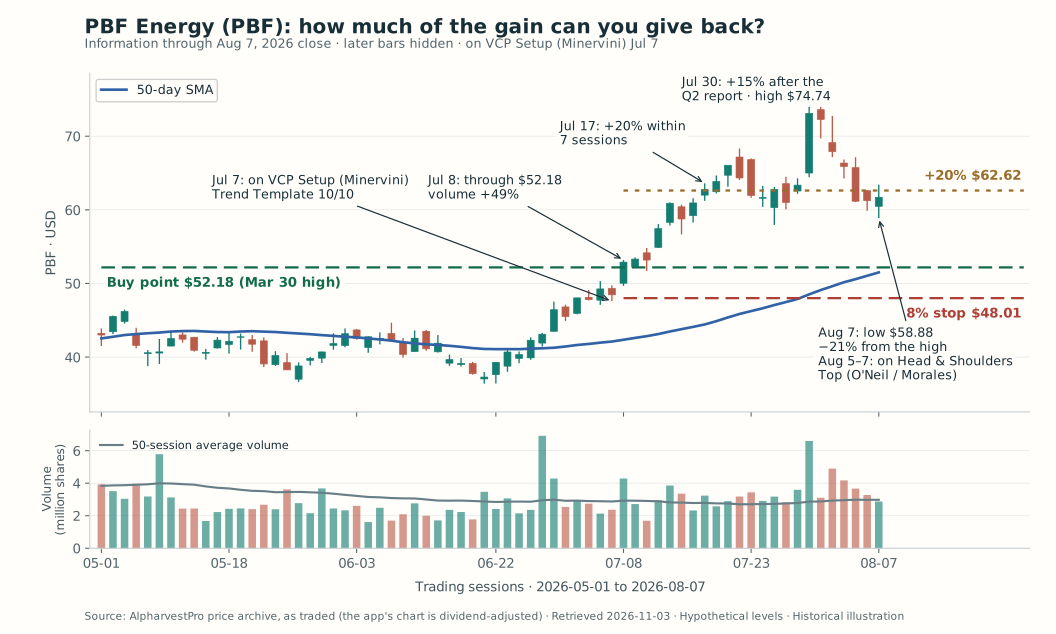
Green dashed: buy point. Red dashed: 8% stop. Gold dotted: +20% line. Blue: 50-day SMA. Tap or click any chart to open it at full size.
By August 7, PBF had fallen 21% from its high, to a low of $58.88, and closed at $61.71. The open profit was down to $905.35. From August 5 to 7, the same stock appeared on AlpharvestPro’s Head & Shoulders Top (O’Neil / Morales) list, a bearish research screen. The eight-week clock still ran to September 2. The 50-day average, at $51.50, had not yet reached the buy point. The 8% stop sat $13.70 below the close.
What does your plan say?
Reveal PBF through November 2
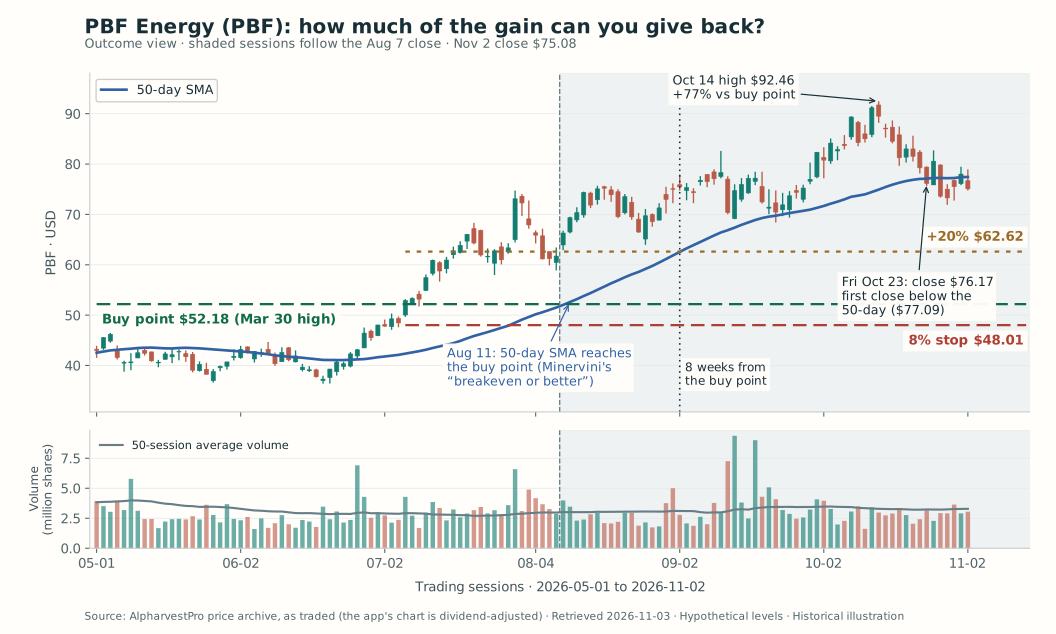
Both written rules said hold. O’Neil’s eight weeks were not up, and the stock was far from the 8% limit. Under Minervini’s rules, the initial stop was still in force; a trader who had sold half on July 14 held the rest with a breakeven stop at $52.18. The lowest price after July 14 was $56.66, on July 15.
August 11: the 50-day average reached $52.61, above the purchase price. From here, Minervini’s stop was the 50-day line.
September 2, eight weeks: a close of $75.48, 44.7% above the buy point. In O’Neil’s plan this is a review, not a sell signal.
October 13 and 14: a closing high of $91.17 and an intraday high of $92.46, 77% above the buy point.
Friday, October 23: a close of $76.17, below the 50-day average of $77.09 for the first time since August 11. Because it was a Friday, the daily and weekly versions of Minervini’s rule agree: exit, 46% above the buy point. SPY also closed 1.0% below its own falling 50-day line that day. PBF reported third-quarter results six days later, on October 29, and closed November 2 at $75.08, still below the 50-day.
| Plan written on July 8 (95 shares, $4.17 risk each) | Exit | Result before costs | Multiple of planned risk |
|---|---|---|---|
| O’Neil’s basic rule: sell at +20% | $62.62 on July 17 | +$991.80 | 2.5R |
| Minervini’s free roll, then the 50-day | 47 shares at $60.52 (July 14), 48 at $76.17 (October 23) | +$1,543.50 | 3.9R |
| Minervini’s breakeven or better | $76.17 on October 23 | +$2,279.05 | 5.75R |
| O’Neil’s exception: hold eight weeks, then review | Review on September 2 at $75.48, not an exit | +$2,213.50 open | — |
Every row sold too soon or too late. The 50-day exit came $15.00 below the best close, handing back $1,425.00, or 38.5% of the open profit at the October 13 close. Selling at +20% gave back nothing and left $13.55 a share on the table. The free roll landed in between.
On PBF, O’Neil’s exception and Minervini’s 50-day rule pointed the same way: the fastest early gain earned the most time. That is the value of writing the exception in advance. Nobody had to decide, in the middle of a 21% pullback, whether this was “one of the powerful ones.” The calendar had decided on July 17.
What the plan cannot do
PBF is the clean case, chosen after the outcome. Most breakouts never create this problem; the masters’ own batting averages say so. Had the August slide kept going, the 8% stop would have cost $396.15, the same planned 1% as any failed breakout.
A stop is a plan, not a guarantee. Minervini warns that when a stock gaps down severely, “your 5 or 10 percent stop is worthless,” because the stock opens below it. That is why the share count matters as much as the stop. This position was about 12% of the account; a 50% overnight gap would have cost $2,478.55, about 6% of the account rather than 1%. Size is the part of the plan that still works when the stop does not. Known report dates belong in the note too: PBF reported on July 30 and October 29.
Running it in AlpharvestPro
- Screen: run VCP Setup (Minervini) or Three Weeks Tight (O’Neil), and confirm the data date.
- Chart: the daily chart already plots the 50-day and 200-day averages. Draw the buy point, the 8% stop and the +20% line with the drawing tools, and write down the date eight weeks out.
- Size: enter the buy point, stop and risk budget in the position-size calculator; our CPAY example walks through the arithmetic.
- Watch: on Pro and Ultra plans, Watchlist Alerts flag a starred stock entering another preset. PBF’s entry into Head & Shoulders Top on August 5 is the kind of alert that should send you back to the written plan, not to the sell button.
- Review on Fridays: compare the weekly close with the 50-day line, and check when the next report is due.
Before your next purchase, add one line to the note: how much of the gain you are willing to give back, and which rule decides. Written on a quiet day, that line is a plan. Written in the middle of a 21% pullback, it is a guess.
Reading and chart notes
William J. O’Neil, How to Make Money in Stocks, Chapter 11, on his profit-and-loss plan and the eight-week holding exception. Mark Minervini, Think and Trade Like a Champion, Section 8, on gaps through stops and position size, and Section 9, on the breakeven-or-better rule, the free roll and selling too soon or too late. The plan table, the comparison of exits and the routine are this article’s own applications.
NYSE: PBF; SPY for the market check. Daily prices are as traded, from the archive behind AlpharvestPro’s charts, retrieved November 3, 2026. The app’s chart adjusts earlier bars for dividends, so bars before PBF’s August 14 ex-dividend date read slightly lower there (the March 30 high shows as $51.64). List appearances come from the dated screening record. The first chart ends at the August 7 close; the outcome chart ends November 2. Entries, stops, sizes and exits are hypothetical and exclude costs, slippage and gaps. The case was chosen after the outcome was known and does not measure how often any method works.

