
After the close on June 23, 2026, SharkNinja was up 5.49% from a hypothetical purchase. RBC Bearings was down 0.94%. The Nasdaq Composite had just lost 2.21%, and AlpharvestPro’s Market Compass had moved to Market in Correction. Selling SharkNinja would put a profit in the book. Selling RBC would mean taking a loss on a stock bought just the day before. If you wanted one less position at tomorrow’s open, which order would you write?
David Ryan gives his answer in Section Six of Momentum Masters. “The stocks that I have a loss on are the first to go.” His reason is worth pausing over. He sees a stock that has struggled since he bought it as a poor candidate to hold through a market decline. He wants to give his strongest stocks time to show whether they can resist the decline. William O’Neil makes the same choice in Chapter 10 of How to Make Money in Stocks, advising investors to start by “selling your worst-performing stock first.”
Ryan still has to decide what “weakest” means. Here we use the percentage gain or loss from our own purchase price at the June 23 close. That measure gives RBC just two sessions to prove itself. SharkNinja has had nine. The ranking tells us what each purchase has done with our money. Age, position size and the industry it belongs to give us reasons to question the ranking before acting on it.
What had changed by Tuesday evening
The Nasdaq Composite made its June closing high at 27,093.90 on June 2. By June 10 it had closed at 25,169.50. Market Compass still read Uptrend Under Pressure. Prices recovered enough in the following sessions to make it quite reasonable to wonder whether the worst was over.
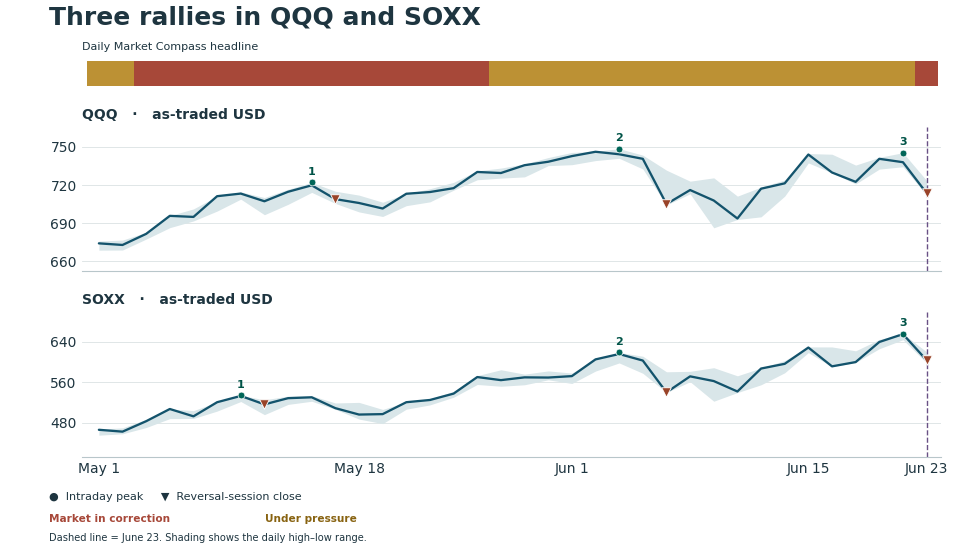
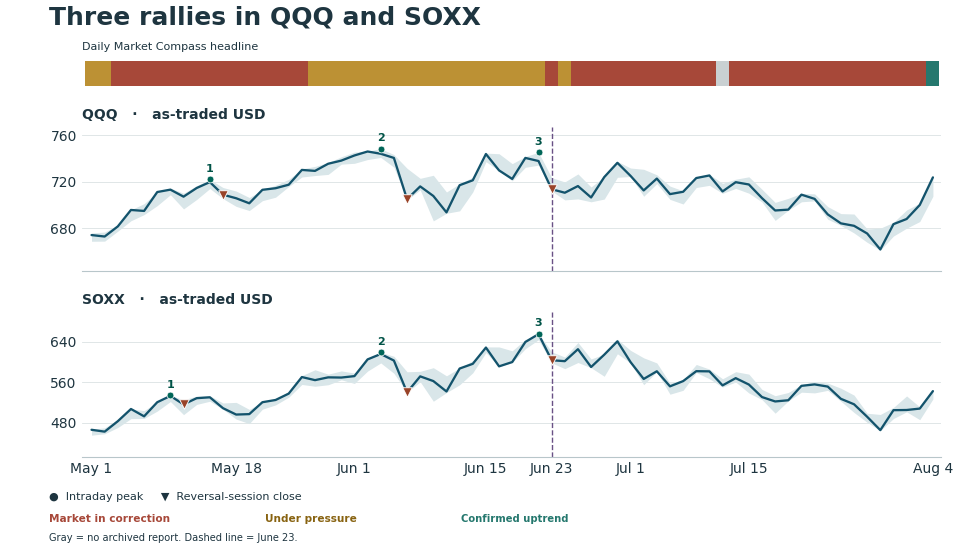
We marked three rally highs retrospectively. QQQ, which tracks the Nasdaq-100, reached its first peak three trading sessions after SOXX, the semiconductor ETF. Both reached their second highs on June 3. On June 22 QQQ stopped short of that high, while SOXX broke above its own. The table pairs each intraday high with the close-to-close drop on a selected reversal day. June 4 was already down in both funds. June 5 was the steeper selloff.
| Rally | QQQ high | QQQ failure | SOXX high | SOXX failure |
|---|---|---|---|---|
| First | May 14 · $722.03 | May 15 · −1.51% | May 11 · $533.74 | May 12 · −3.15% |
| Second | June 3 · $748.63 | June 5 · −4.80% | June 3 · $618.84 | June 5 · −10.44% |
| Third | June 22 · $745.43 | June 23 · −3.29% | June 22 · $655.95 | June 23 · −7.88% |
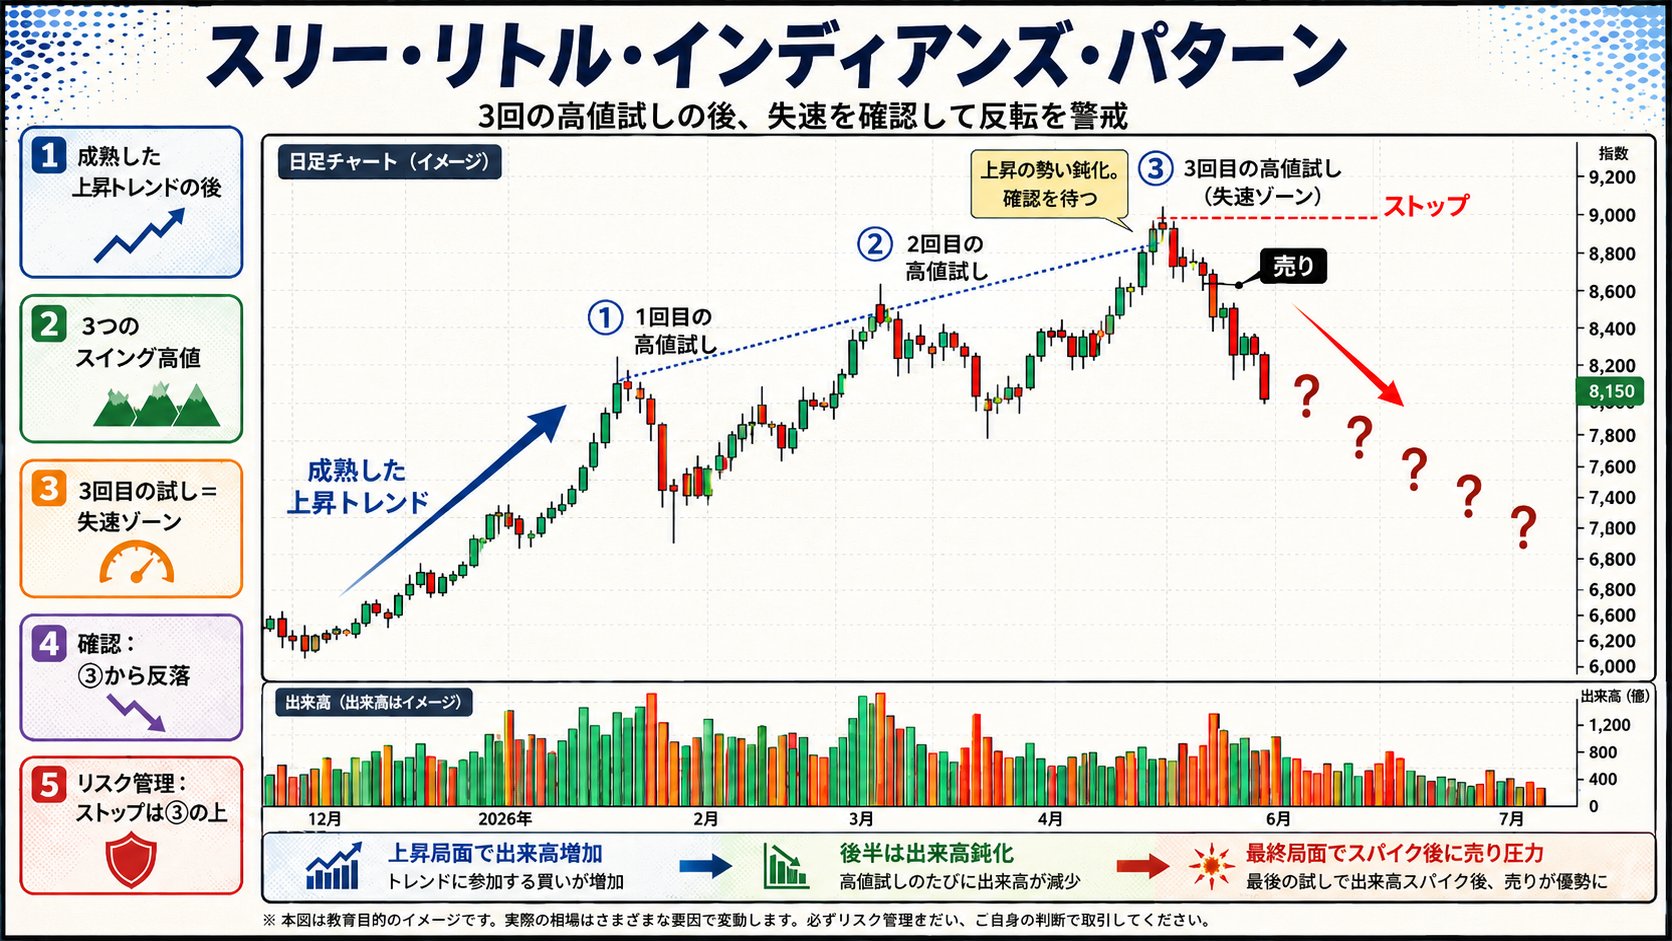
In Street Smarts, Linda Bradford Raschke and Laurence A. Connors call a climax of three symmetrical peaks Three Little Indians. They write that traders “must wait for the price to reverse off the last peak before we enter.” In their short-term reversal trade, the trader enters as price turns, puts the stop at the recent swing high, moves it quickly to breakeven and wants a quick payoff. Their coffee example lasted less than four hours. We borrow their observation of a reversal to reconsider existing long positions. The three ways of managing those positions below are this article’s exercise.
At 11:56 p.m. New York time on June 23, already June 24 in Japan, we drew on Raschke’s work to flag a possible market top. We asked whether three pushes higher in a composite of Korea’s KOSPI, the U.S. semiconductor index (SOX) and Japan’s Nikkei 225 could mark the end of a strong rally. The warning called for patience. A turn down from the third high would show that buyers were losing their grip. @AlpharvestPro’s original post in Japanese
How symmetrical were the three peaks in QQQ and SOXX? Counting trading sessions from one high to the next gives 13 then 12 for QQQ and 16 then 12 for SOXX. We chose May 1 as the start of the chart. It is also the low for both first rallies, so their measured size depends on where that window begins. For each later rally, start at the lowest price since the previous peak. On that basis QQQ’s three advances were 7.96%, 7.67% and 8.60%. SOXX’s were 17.29%, 29.48% and 25.60%. QQQ came closer in timing and size. SOXX made three successively higher highs and then the harder reversal. A trader could see that reversal by Tuesday’s close. How much exposure to keep was a separate decision.
The Composite itself closed June 23 at 25,587.04, its first close below its 50-day average since the June 2 high. Trading volume rose 13.91% from the previous session. The June 23 Compass showed six Nasdaq distribution days, up from five on June 22. The share of tracked stocks above their 50-day average rose from 46.9% to 48.1%, even as the Composite fell. The first archived copy of the report is timestamped 10:16 p.m. Eastern on June 23. Our exercise assumes access before the next open. Dated market readings and prices
The five positions on the desk
AlpharvestPro’s daily preset membership snapshots begin July 7. For these earlier purchases we searched its dated pocket pivot, buyable gap-up and VCP pattern records from May 27 through June 22. Three Weeks Tight and High Tight Flag have no such daily membership record for these dates. Each of the five holdings below had a pocket-pivot observation. Entegris also had a buyable gap-up. An observation put the name on the research list. The actual purchase needed a separate breakout.
We started with the weekly chart, looking for a stock above a rising 30-week average. Then we checked the daily base for a higher reaction low. A qualifying close had to clear a high at least 15 sessions old on at least 1.5 times average volume over the previous 50 sessions. We assumed a fill at the next open. Among the purchases still open on June 23, we took five different app industry groups. We favored purchases with the most evidence for liquidity, a new business development, improving reported sales and earnings, market conditions, group leadership and stock relative strength. Higher prior dollar turnover settled ties. The business-development check required judgment. We credited a new director at Ames, a registered fund still in development at AMG, a new finance chief at Entegris and a continuing sales contribution from RBC’s 2025 acquisition. A stricter product-launch test could change the five names. We selected from purchases still open on June 23, so the sample excludes positions already stopped out.
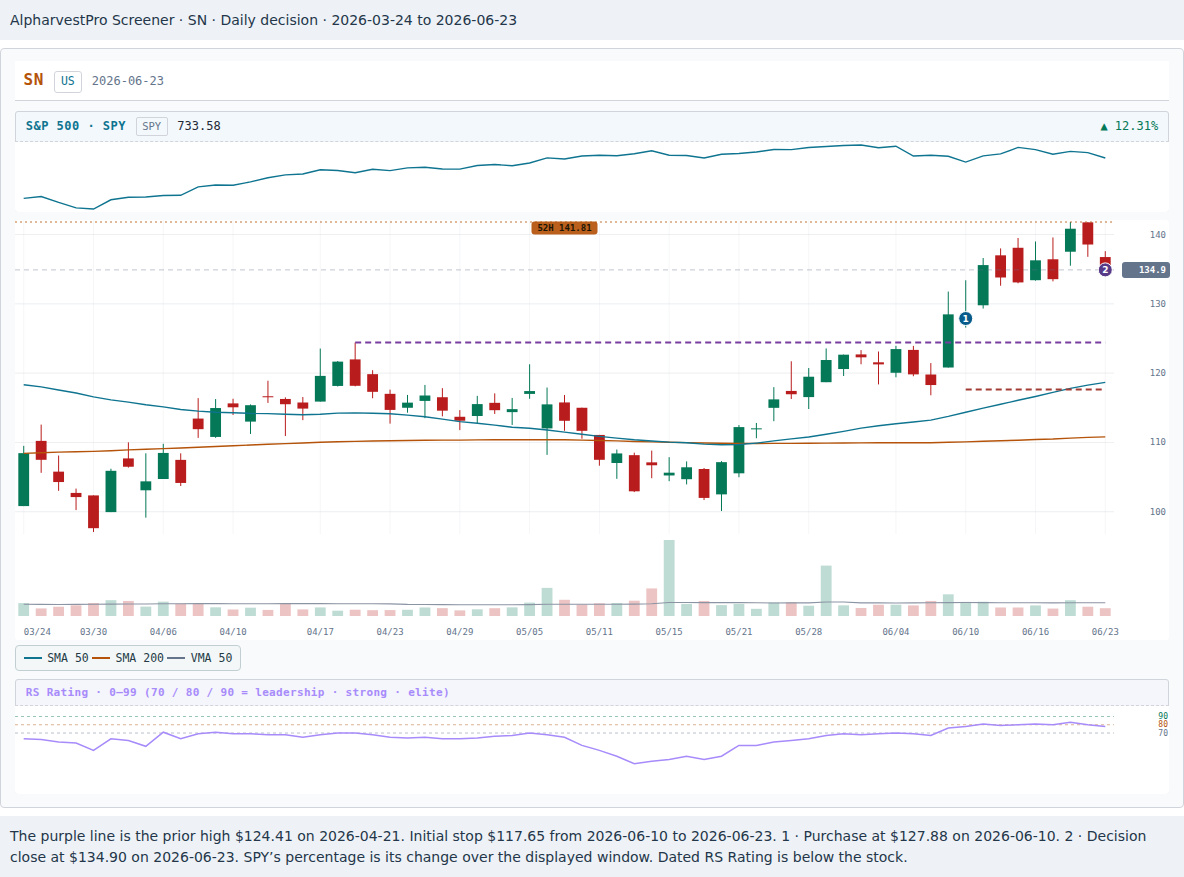
Take the two ends of the ranking. SharkNinja’s 10-week average was $116.46, above its rising 30-week average of $114.00. It had pulled back to $100.10 on May 20, then made a higher reaction low at $118.37 on June 3. On June 8 it dipped to $116.80, still above its May low. Its June 9 breakout cleared $124.41 on 1.64 times average volume. Its new dual-flavor frozen-drink maker had launched in May. First-quarter sales grew 15.6%, and diluted earnings rose to $0.85 from $0.83. The app’s group ranked 46th, but the stock’s own RS Rating of 76 missed our usual 80 threshold. SharkNinja’s product announcement · First-quarter results
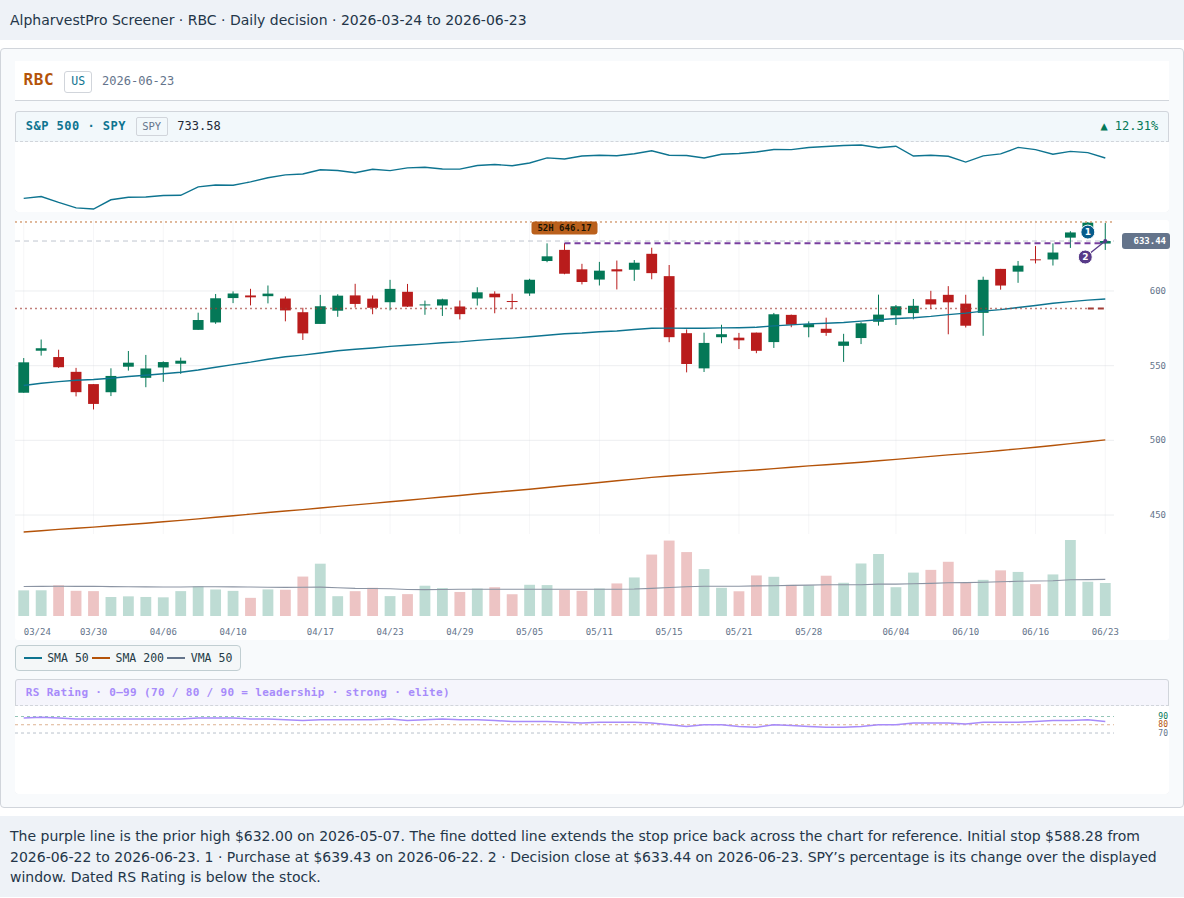
RBC Bearings had more conventional credentials. Its 10-week average was $591.49 against a rising 30-week average of $538.33. A May 18 low of $545.51 and a June 11 low of $570.00 lay beneath the $632.00 buy point. Its June 18 breakout traded 2.15 times average volume, with an RS Rating of 85 and a group ranked 26th. Sales for its fiscal fourth quarter rose 18.3%, helped by a contribution from the previously acquired VACCO business. Diluted earnings reached $2.89 against $2.30. By June 23, the stock was still above its buy point at $633.44. The loss in this account came from paying $639.43 at the open. RBC Bearings fiscal fourth-quarter results
The account started with $40,000. Each purchase had an 8% stop and a maximum initial planned loss of $400. Divide $400 by the entry-to-stop distance and round down to whole shares. The series halves the share count when the open is more than 5% above the buy point. All five entries here were within that limit. For the exercise, sizing and filling at the opening print are assumed. A trader sending a market-on-open order has to estimate the price before it trades.
| June 23 rank | Bought | Shares | Entry | Active stop | June 23 close | Gain from entry | Value at close | Fall to stop |
|---|---|---|---|---|---|---|---|---|
| 1 · SharkNinja (SN) | June 10 | 39 | $127.88 | $117.65 | $134.90 | +5.49% | $5,261.10 | 12.79% |
| 2 · Affiliated Managers Group (AMG) | June 5 | 15 | $332.71 | $306.09 | $350.22 | +5.26% | $5,253.30 | 12.60% |
| 3 · Entegris (ENTG) | June 16 | 30 | $161.78 | $148.84 | $168.22 | +3.98% | $5,046.60 | 11.52% |
| 4 · Ames National (ATLO) | June 8 | 167 | $29.86 | $27.47 | $30.85 | +3.32% | $5,151.95 | 10.96% |
| 5 · RBC Bearings (RBC) | June 22 | 7 | $639.43 | $588.28 | $633.44 | −0.94% | $4,434.08 | 7.13% |
The last two columns show each position’s value at the June 23 close and the percentage decline from that close to the stop. Tomorrow’s opening fill could differ. The positions were worth $25,147.03, or 61.55% of the account. Cash was $15,706.00. All $853.03 of the gain was still open. Entegris had come from the fourth-ranked group. AMG ranked second in this account, even though its app industry group had ranked 147th on its breakout date. An investor insisting on all six checks would have passed on AMG as well as SharkNinja. All five weekly and daily charts, purchase costs and context checks
Write one order for June 24
A sells all of the biggest percentage winner at the next open. B sells all of the weakest holding at the same open. C keeps all five under their existing stops. Plans A and B each remove one name. The dollar amounts freed can differ. Nobody reinvests the proceeds in this comparison.
For a position that stays, the original stop stands. At a 20% gain the plan sells half the shares, rounded down, and moves the stop on the remainder to entry. Only after that sale can the first subsequent session with a new largest one-day percentage decline since the weekly advance began trigger a closing sale. We date that advance from the week the 30-week average stopped falling before the breakout. An opening gap through a stop fills at the open. If the same daily bar touches an existing stop and a target, we count the stop first.
Choose now. Would you sell the stock with the largest open gain, the one with the weakest return, or neither? Write down what would make you regret your choice.
See the June 24 fills and follow all five positions to July 31
The first rally made the weakest sale look early
SharkNinja opened June 24 at $136.91. Plan A banked $352.17 and freed $5,339.49. RBC opened at $633.52. Plan B took a $41.37 loss and freed $4,434.64. That evening Market Compass went back to Uptrend Under Pressure for one day. On June 25 RBC traded as high as $667.69. An investor who had sold the weakest stock had to watch it bounce above the original entry almost immediately.
June 25 brought back Market in Correction. Every archived headline through July 31 then carried that reading. July 13 has no saved report. Meanwhile, on July 2, two stocks in the same portfolio needed opposite orders. SharkNinja reached its 20% target of $153.46. Plans B and C sold 19 shares, kept 20 and raised their stop to $127.88. Entegris, which had traded at $184.00 on June 25, fell through $148.84. All three plans lost $388.20 on it. A good industry rank and an early profit had bought Entegris no protection.
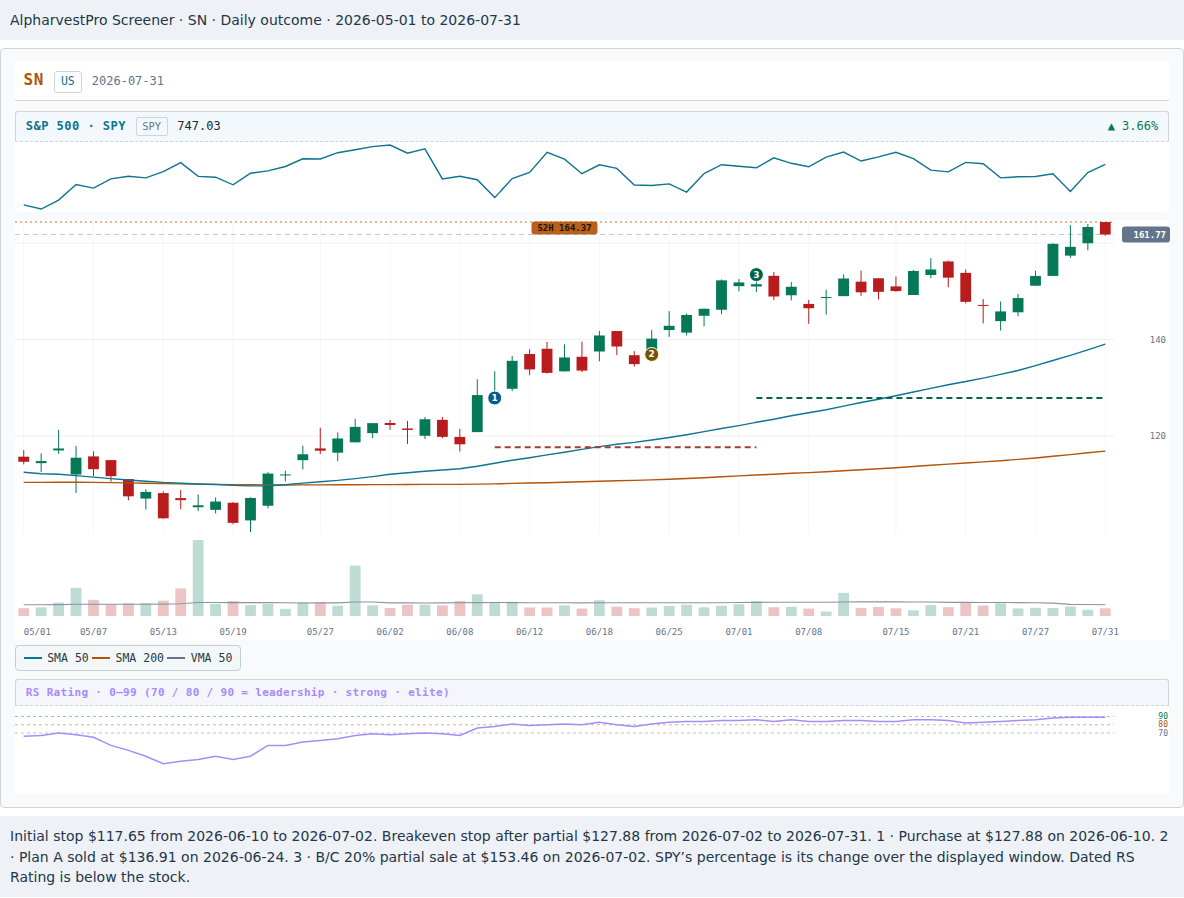
RBC touched its $588.28 stop on July 7. Plans A and C lost $358.05 on their seven shares. Plan B’s earlier exit saved $316.68 against that stop. Selling RBC on June 24 meant missing its June 25 rally. On the decision evening it had been the only position below its purchase price.
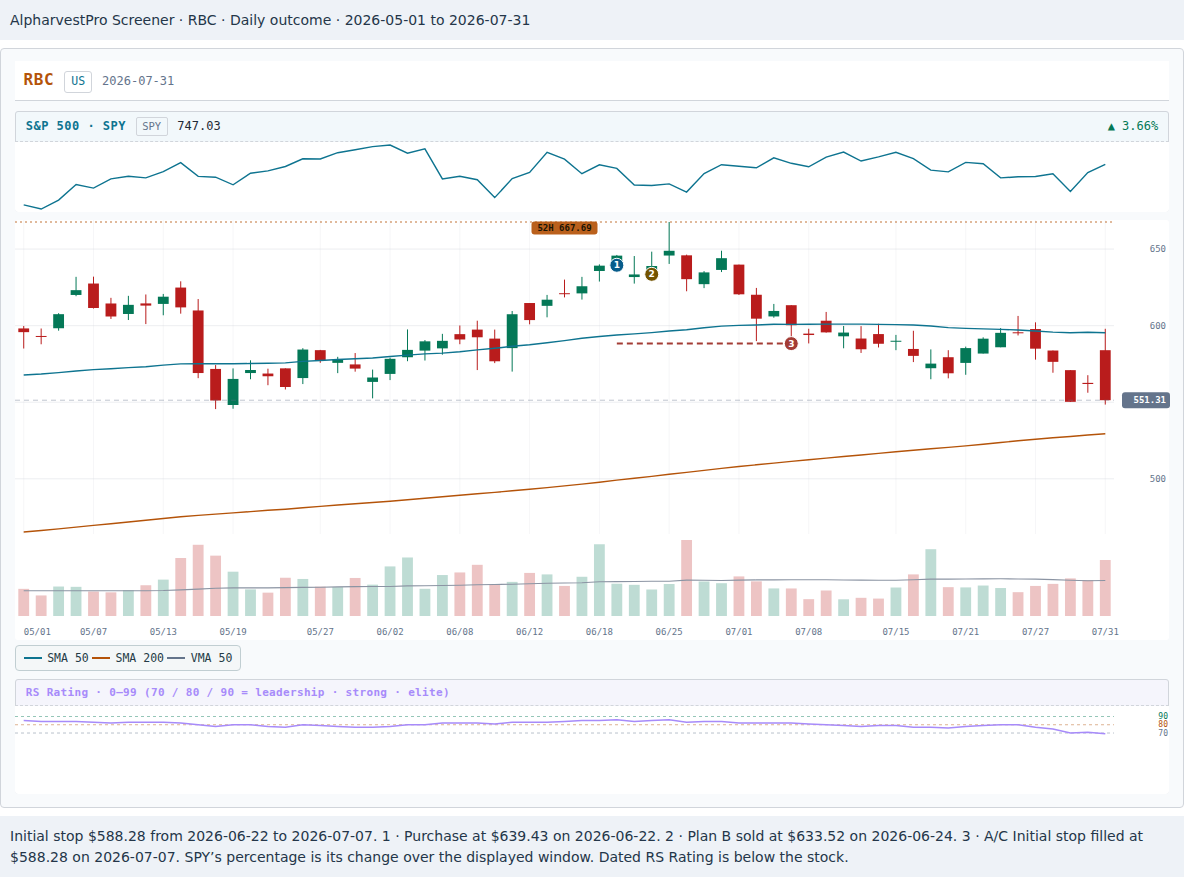
Here is what the stocks themselves did in the following legs. The prices are closes, including after a plan had exited.
| Stock | June 26 | July 10 rally | July 29 market low | July 31 |
|---|---|---|---|---|
| SharkNinja | $145.10 | $152.65 | $159.22 | $161.77 |
| Affiliated Managers Group | $341.98 | $366.41 | $360.07 | $366.73 |
| Entegris | $161.43 | $145.35 | $107.01 | $119.05 |
| Ames National | $30.62 | $29.29 | $30.58 | $30.59 |
| RBC Bearings | $630.36 | $595.49 | $550.27 | $551.31 |
Ames and AMG stayed above their stops. On July 29 the Nasdaq Composite closed at 24,442.94, 9.78% below its June 2 high. Measured from each ETF’s own highest close, QQQ had fallen 11.32% and SOXX 29.01%. QQQ subsequently reached an intraday high of $762.86 on October 6, a higher peak that a June holder could only have seen in hindsight.
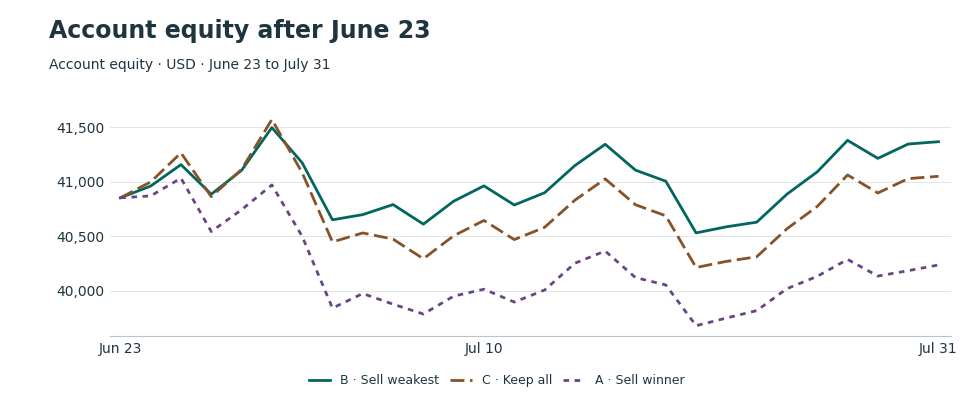
| July 31 result | Realized P&L | Open P&L | Total P&L since purchase | Change since June 23 | Still in stocks | Stock exposure |
|---|---|---|---|---|---|---|
| A · Sell SharkNinja first | −$394.08 | +$632.21 | +$238.13 | −$614.90 | $10,609.48 | 26.37% |
| B · Sell RBC first | +$56.45 | +$1,310.01 | +$1,366.46 | +$513.43 | $13,844.88 | 33.47% |
| C · Keep all five initially | −$260.23 | +$1,310.01 | +$1,049.78 | +$196.75 | $13,844.88 | 33.73% |
Each plan already had $853.03 of open profit when the decision was made. B and C finished with identical shares of SharkNinja, AMG and Ames. B had more cash because it sold RBC sooner. A and C differed only in their treatment of SharkNinja. Keeping it under the original selling rules left C $811.65 ahead of A. B and C show different exposure percentages because their cash balances differed.
SharkNinja led AMG by only 0.23 percentage points on June 23. Selling AMG instead at its $350.15 opening price would have left the account on July 31 $51.95 below its June 23 value, just $248.70 behind holding all five. The cost of selling the leader in this case depended on which stock held that narrow lead.
On August 4 Market Compass returned to Confirmed Uptrend. The account comparison ends at July 31.
What goes beside a ticker before you sell it
Ranking by gain gives you a place to begin, particularly when a small open loss is easy to excuse. Look at what made RBC the weakest. The business was growing, the breakout had volume, and the stock was holding above the original buy point. Your own entry had left less room. A reader who kept it on those grounds still had a precise price at which the decision would be over. Set that price while you can still choose it calmly.
These five positions were selected after the fact from one correction. The fills are hypothetical and price-only. Fees, bid–ask spreads, taxes, dividends and interest on cash are excluded. The three policies take different dollar amounts out of the market. Company news also continued through July, including earnings from Ames, AMG and RBC. One month cannot establish which policy usually works. Trade ledger, company filings and chart notes
At the next close, write your gain or loss since purchase, the active stop, and the cash a full exit would free beside each holding on your watchlist. Check the stock’s weekly chart and mark the next earnings date from the company’s own calendar. Then finish one sentence before tomorrow’s open. “If I need to reduce my holdings by one, I will sell ___ first because ___.”
