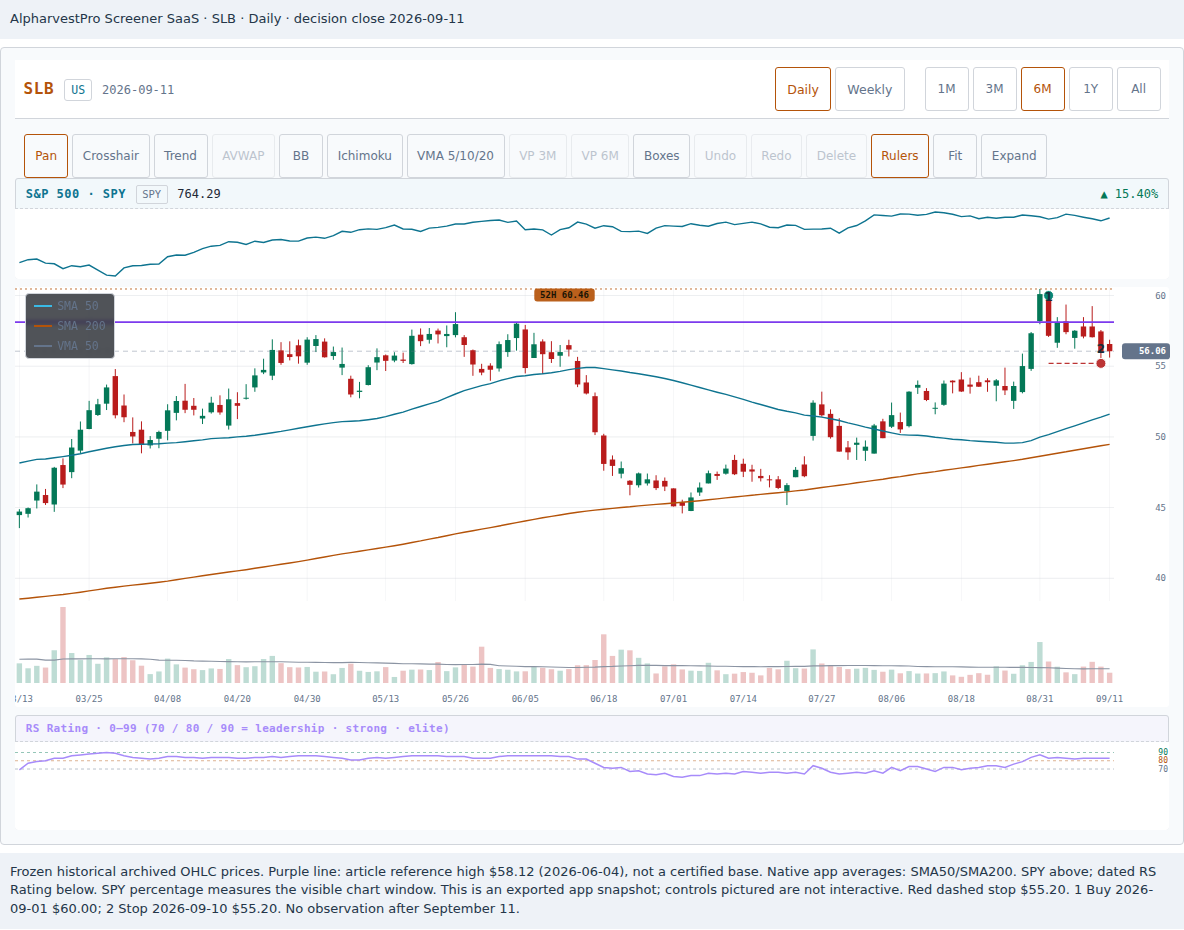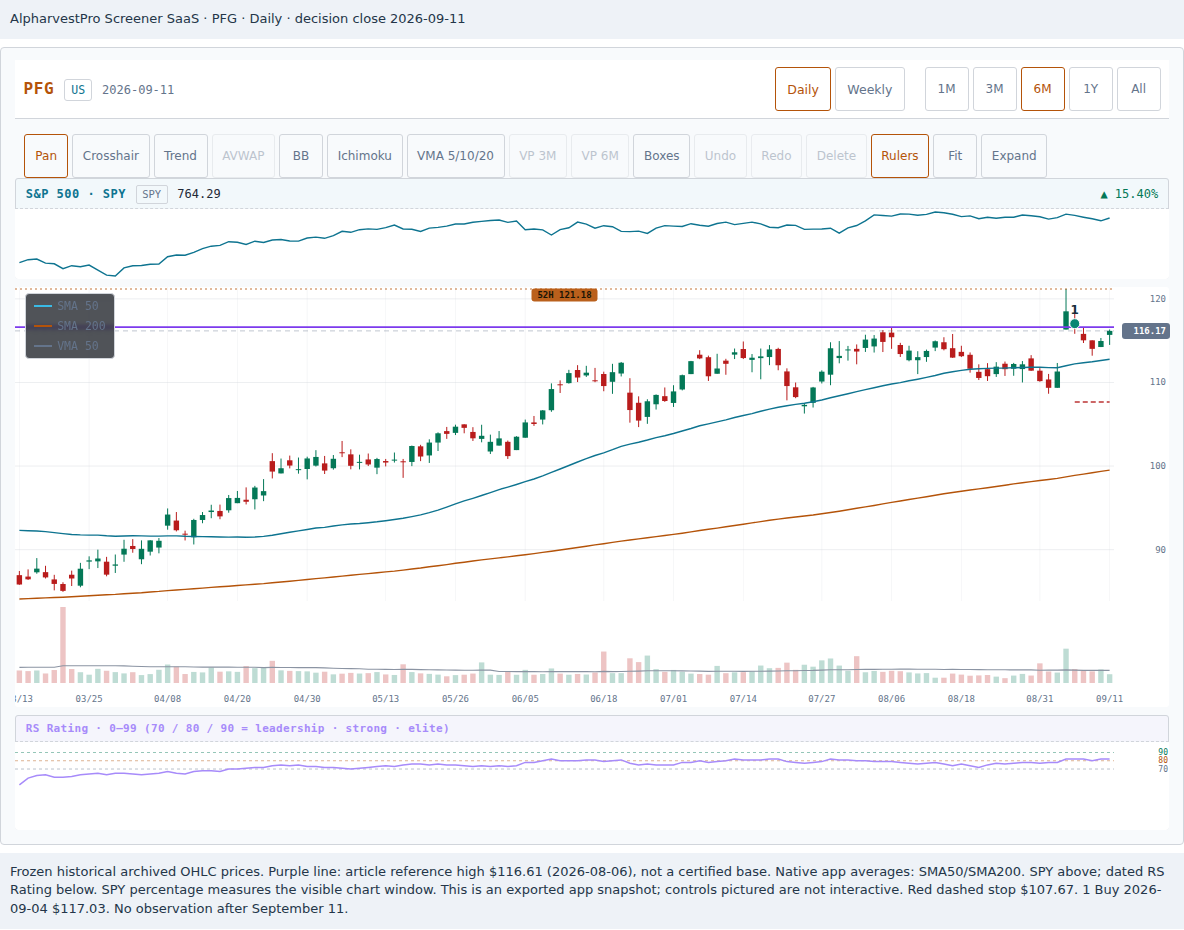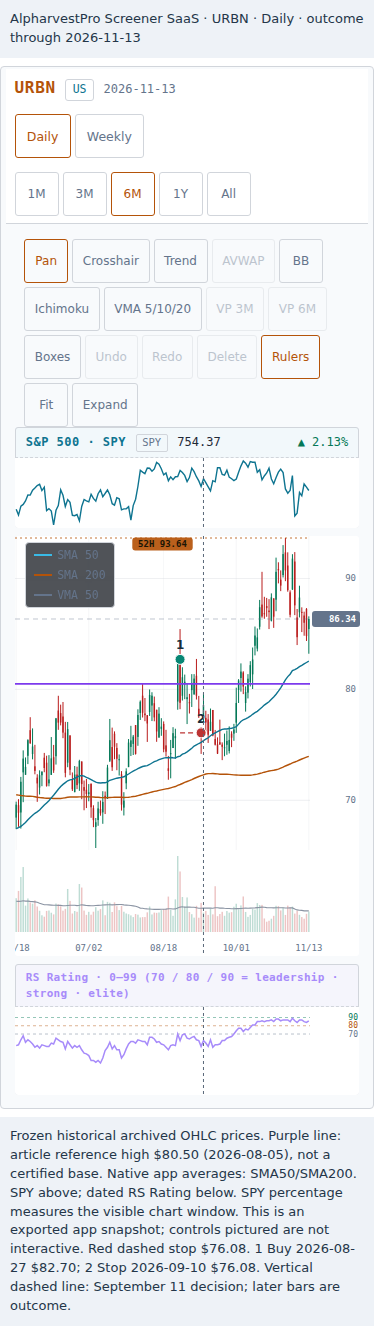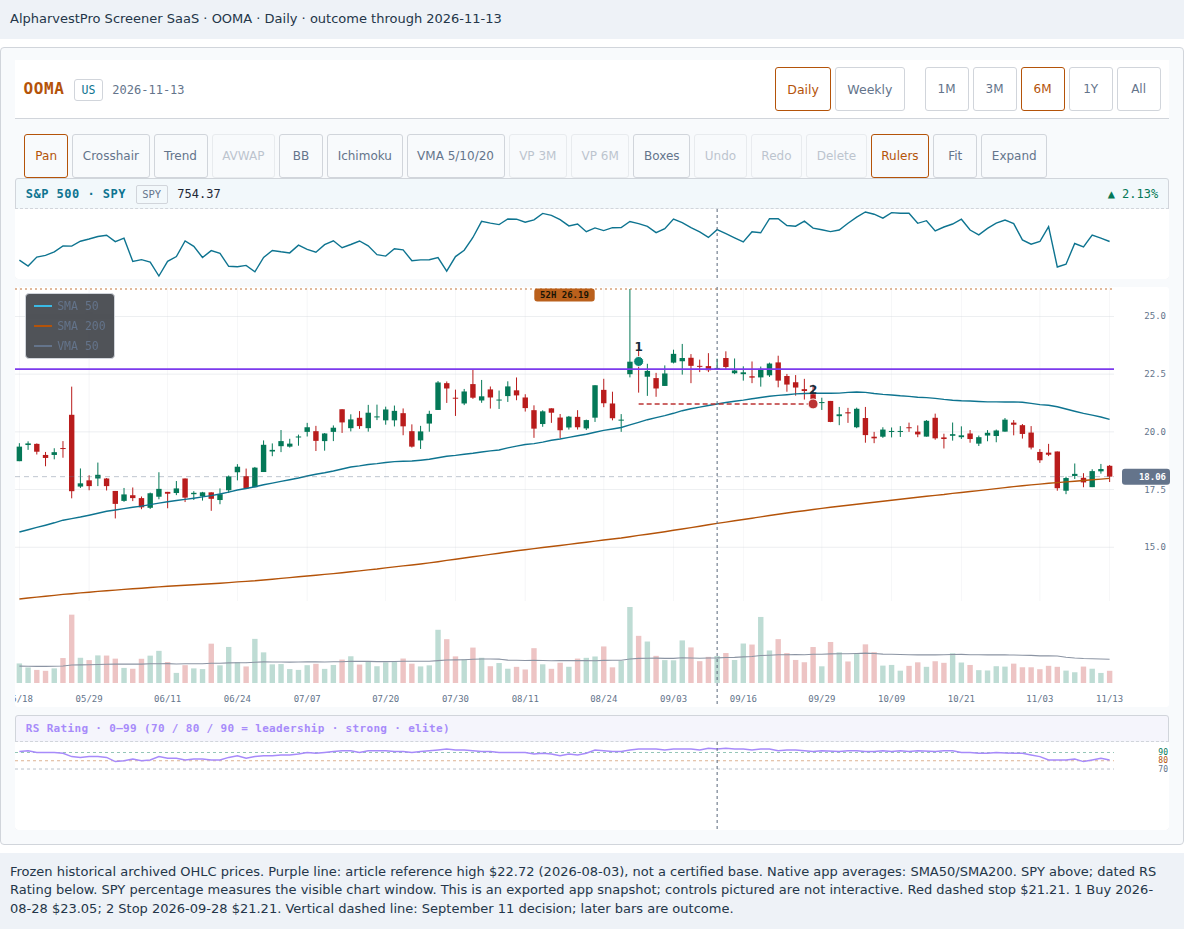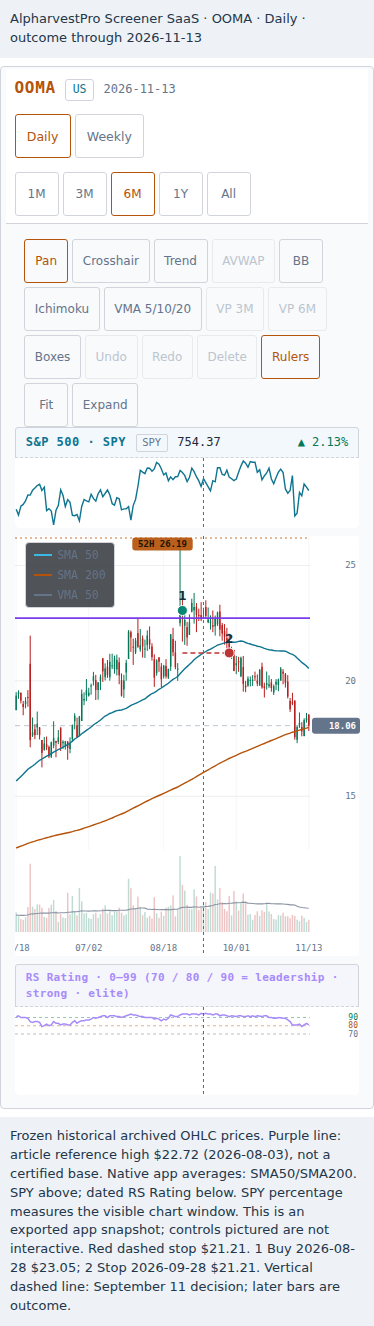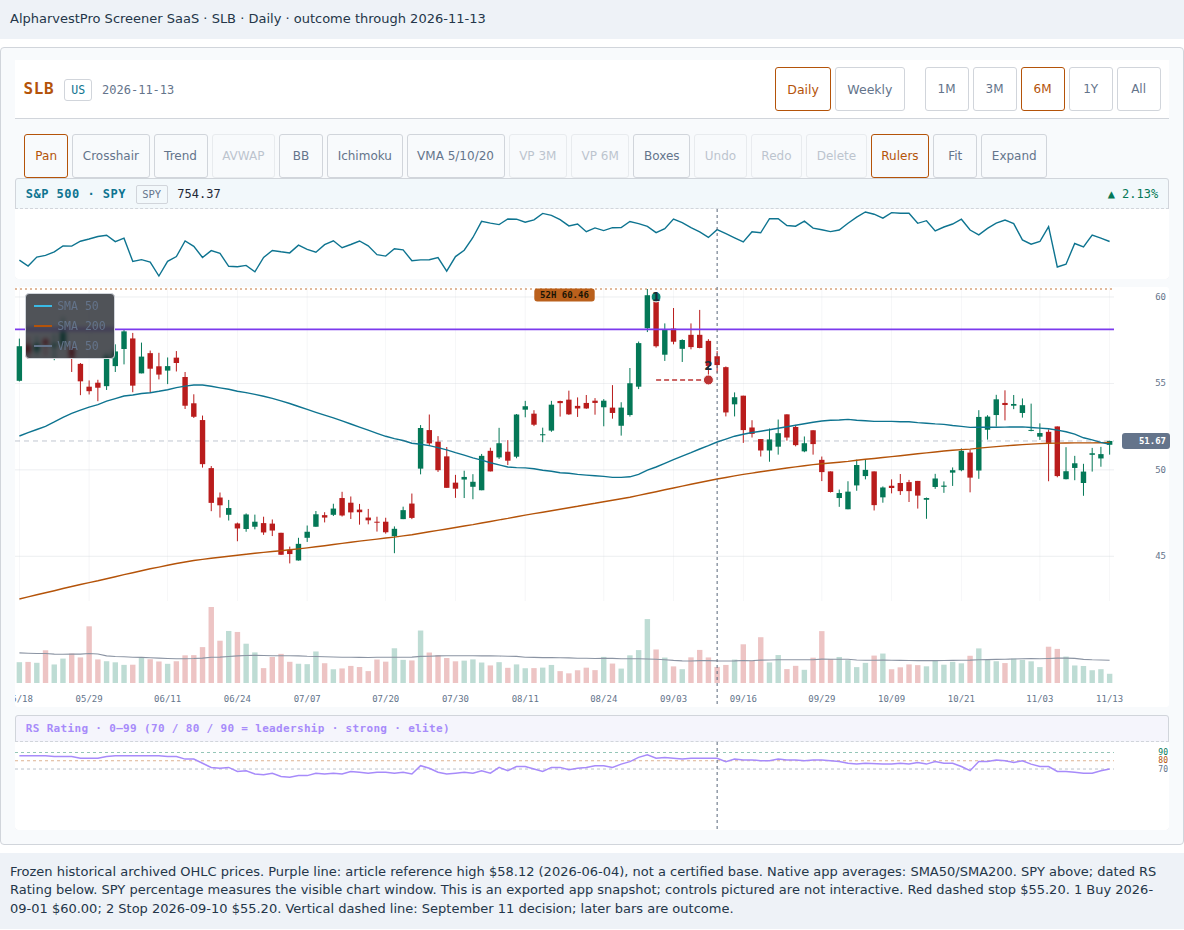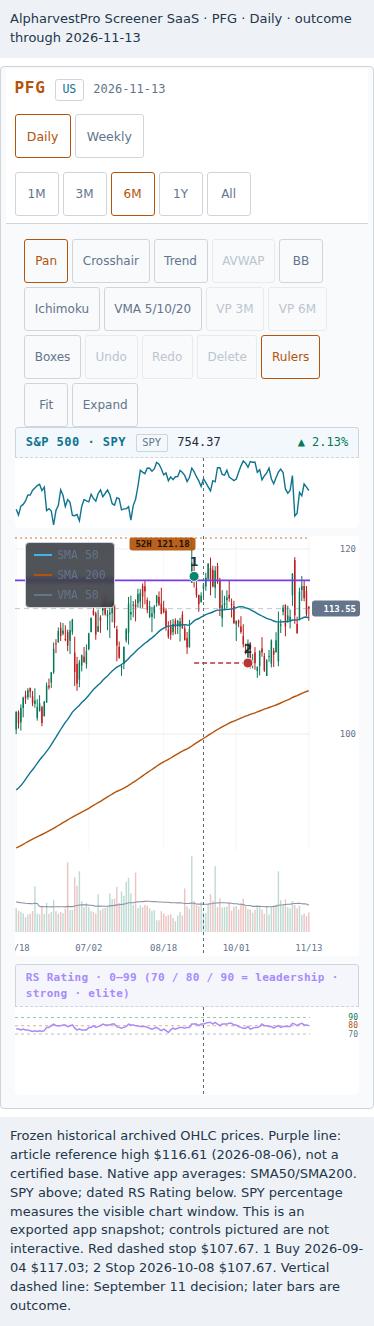
It is Friday evening, September 11, 2026. You have bought five stocks across five different sectors. Two have hit their stops. The other three are still open, but none is above your purchase price.
The next temptation is familiar: find a better sixth stock. This time, perhaps, the breakout will hold.
William O’Neil would first look at the five you already bought. In How to Make Money in Stocks, he writes:
Shifts in market direction can also be detected by reviewing the last four or five stock purchases in your own portfolio. If you haven’t made a dime on any of them, you could be picking up signs of a new downtrend.
That is the passage behind our November 13 Momentum Masters story, which includes the English quotation. Notice his qualification: could be. A losing run asks for investigation. It does not tell you whether the problem was the market, the stocks, or your decisions.
We will follow the account in two steps. First, inspect the original five purchases. Then, at September 11, imagine three traders holding identical copies of that account: one keeps the usual risk budget, one reduces it, and one waits. The later purchases show what those choices meant in practice.
Five purchases, one uncomfortable evening
The hypothetical account starts with $40,000. Each purchase has a $400 risk budget and a stop 8% below its opening purchase price. Whole shares keep the actual planned loss at or below that budget. The order is halved if the next open is more than 5% above the reference high.
The risk budget is the planned dollar loss if the shares can be sold at the stop. The stop is the price where the plan calls for an exit. The money spent buying the shares is a separate amount; a gap past the stop can also make the actual loss larger, as we will see later.
The five came from dated AlpharvestPro list appearances, including VCP Setup (Minervini), Pocket Pivot (Morales & Kacher) and Buyable Gap-Up (Morales & Kacher). Each produced a close above the mechanical screen’s reference high on volume at least 50% above its previous 50-session average. The hypothetical purchase follows at the next open, provided the preceding evening’s Market Compass headline is outside correction.
That describes a price trigger. It does not certify the base or the business behind it.
We selected one purchase on each of five dates between August 27 and September 4, seeking different app Industry Groups and Sectors and the strongest combination of context checks. The losing stretch was already known. These are retrospectively selected examples, not a test of a trading strategy.
| Purchase | App Industry Group | Sector | Shares | Entry | Initial stop | Planned loss |
|---|---|---|---|---|---|---|
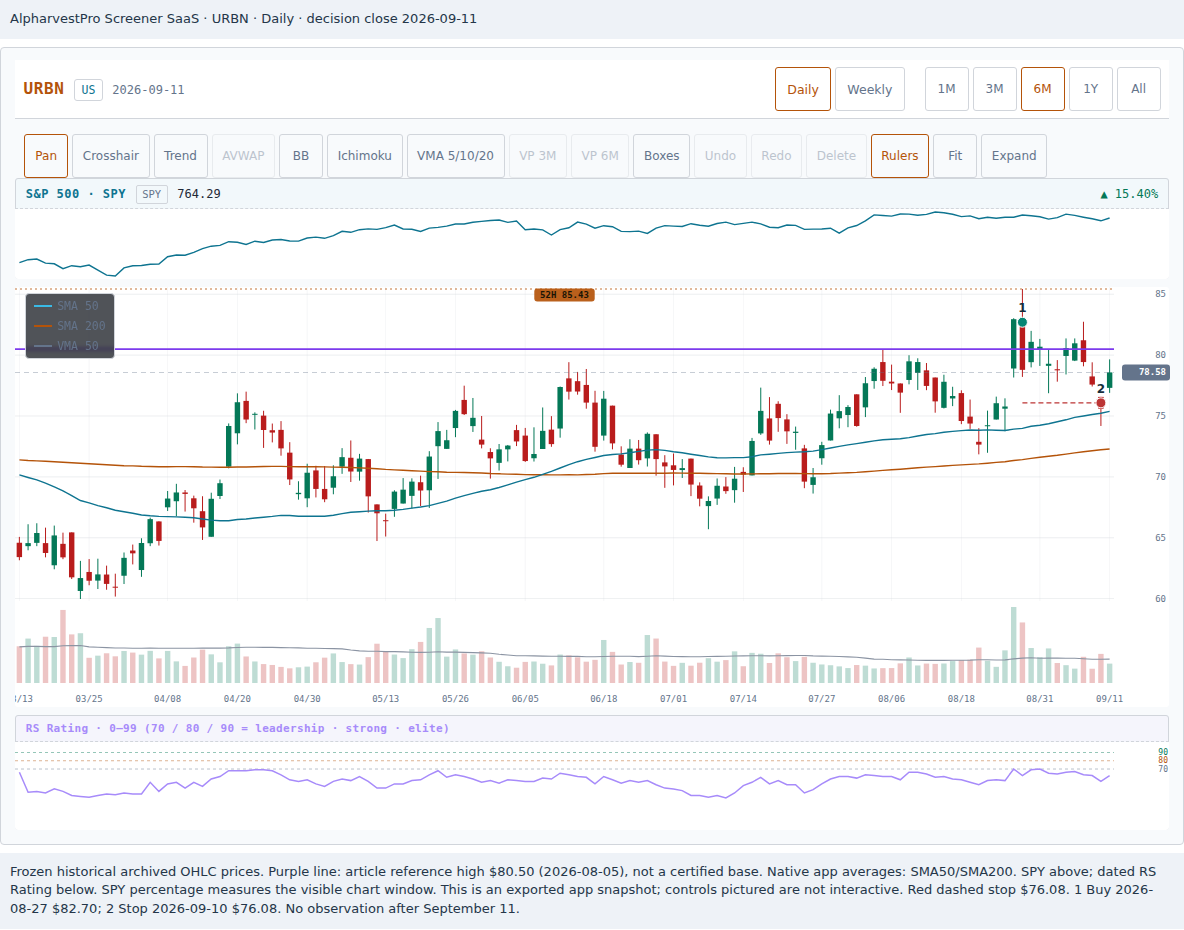
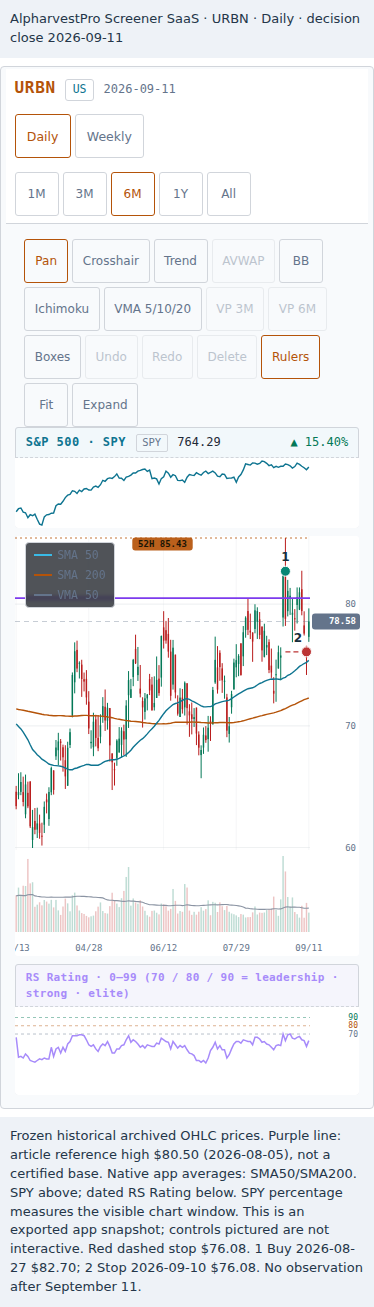
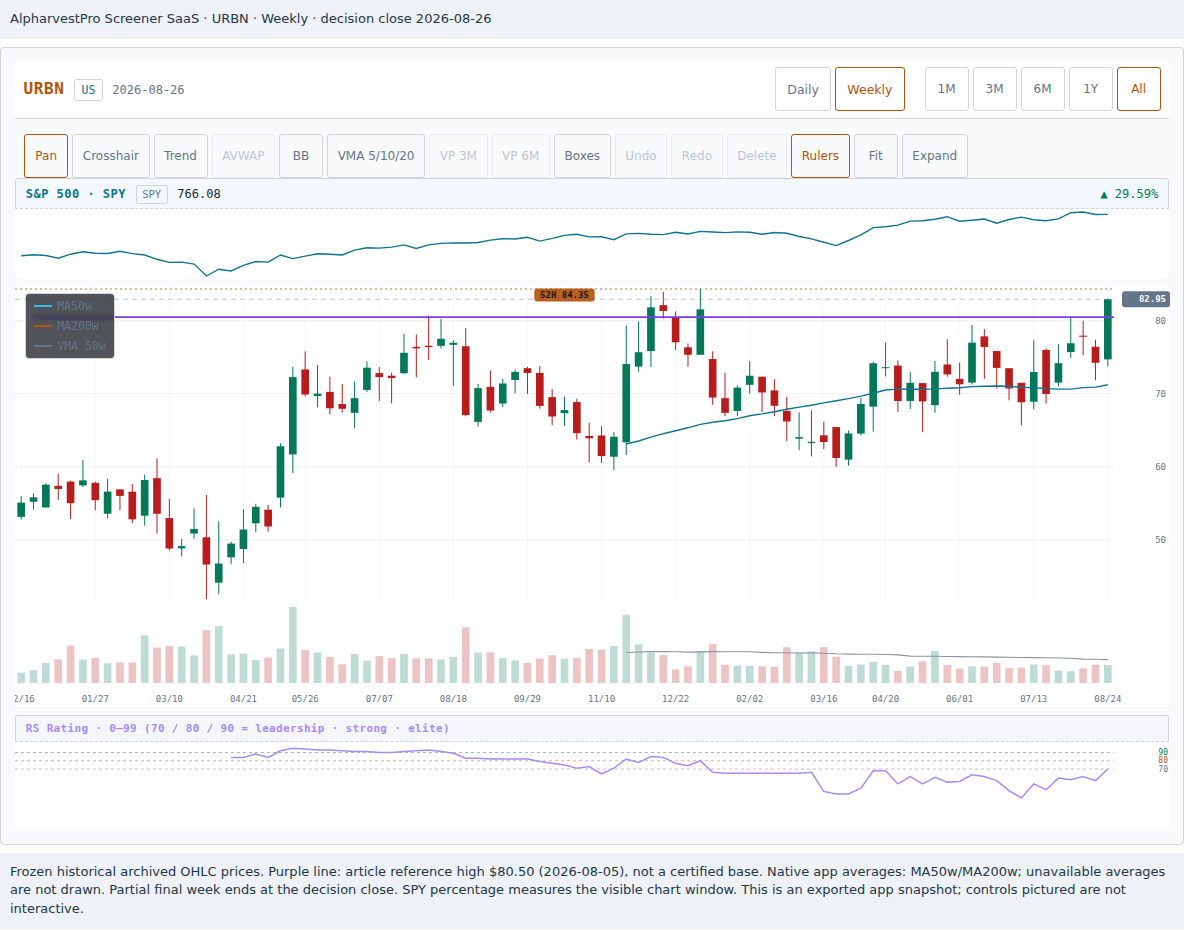
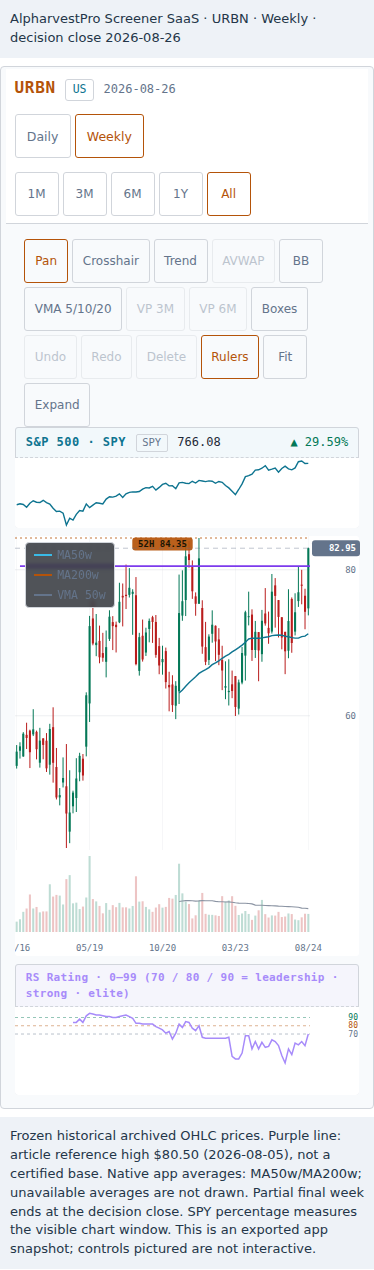
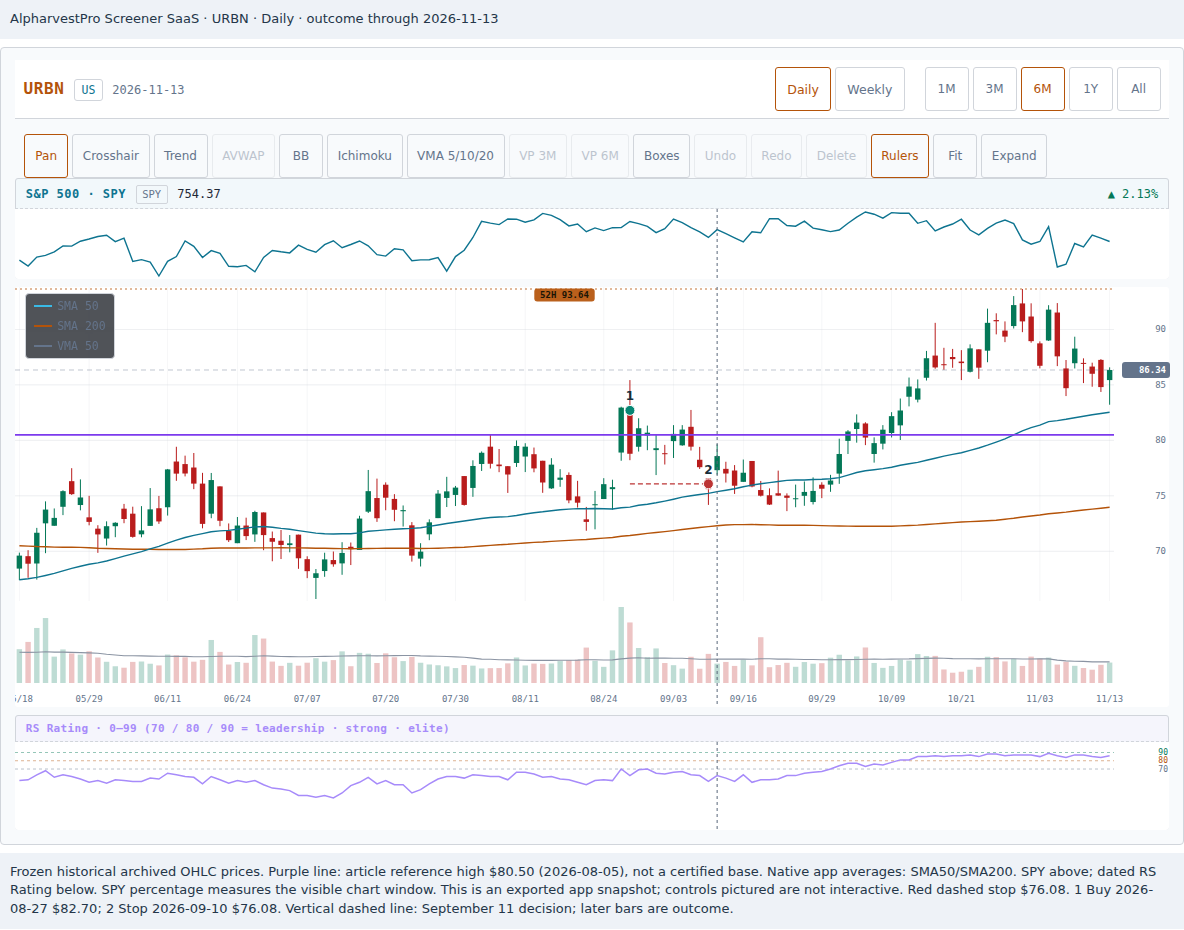
| #1 · Aug 27 · URBN | Retail-Apparel/Shoes/Acc | Consumer Cyclical | 60 | $82.70 | $76.08 | $397.20 |
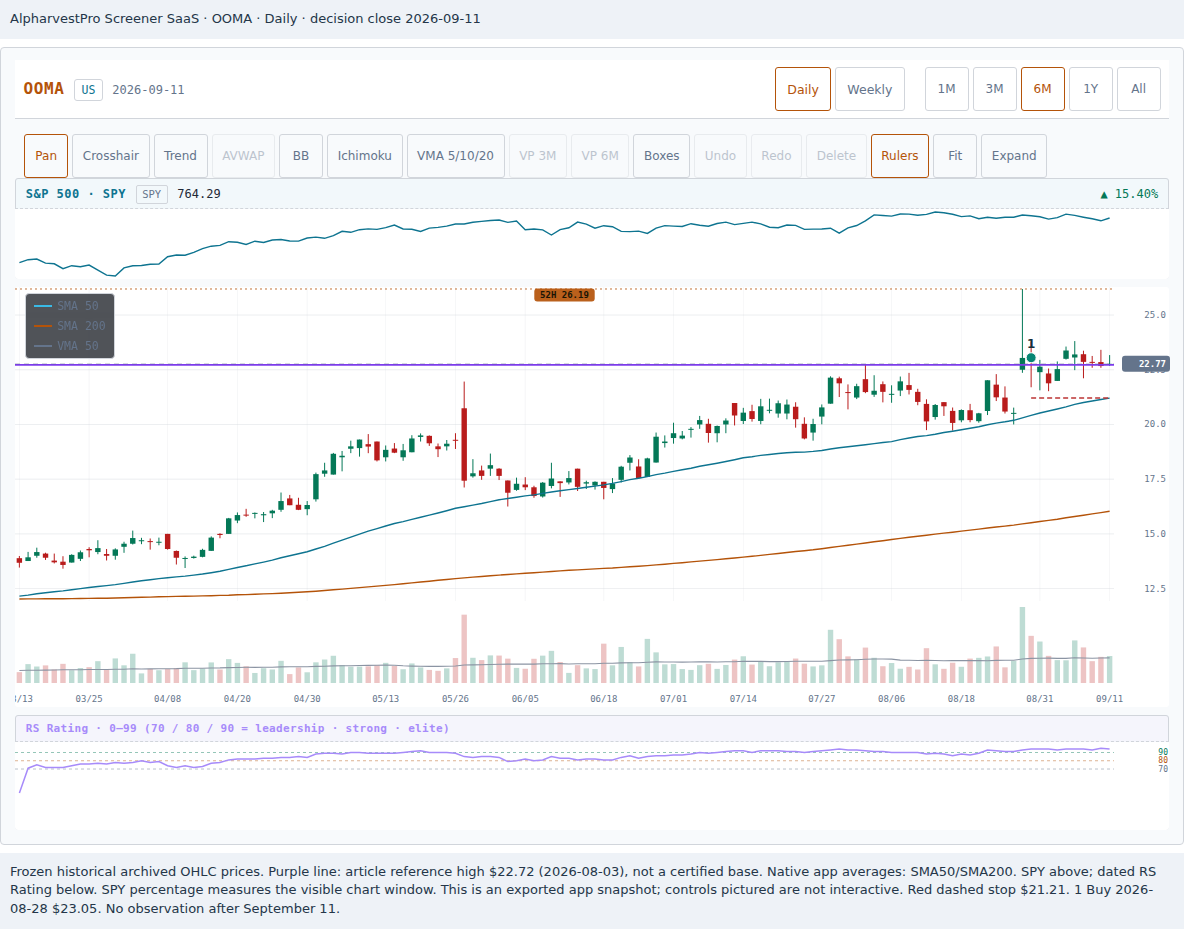
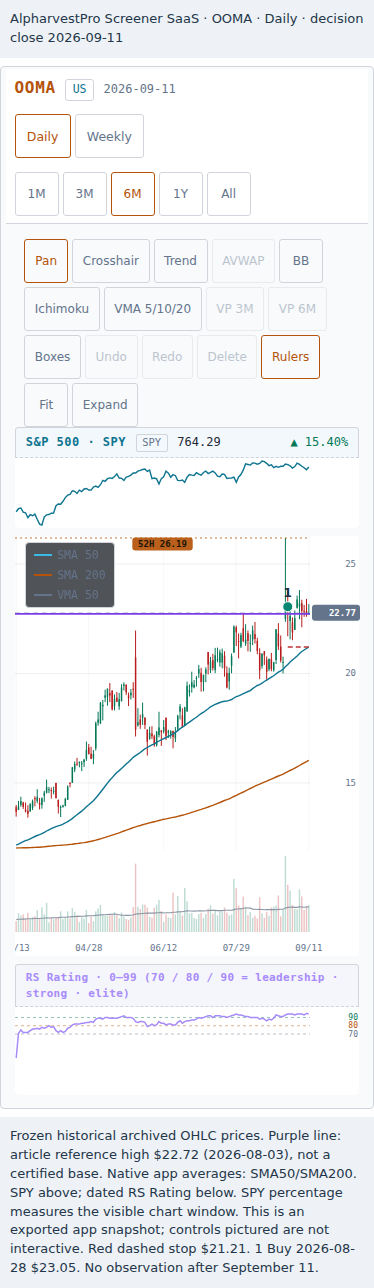
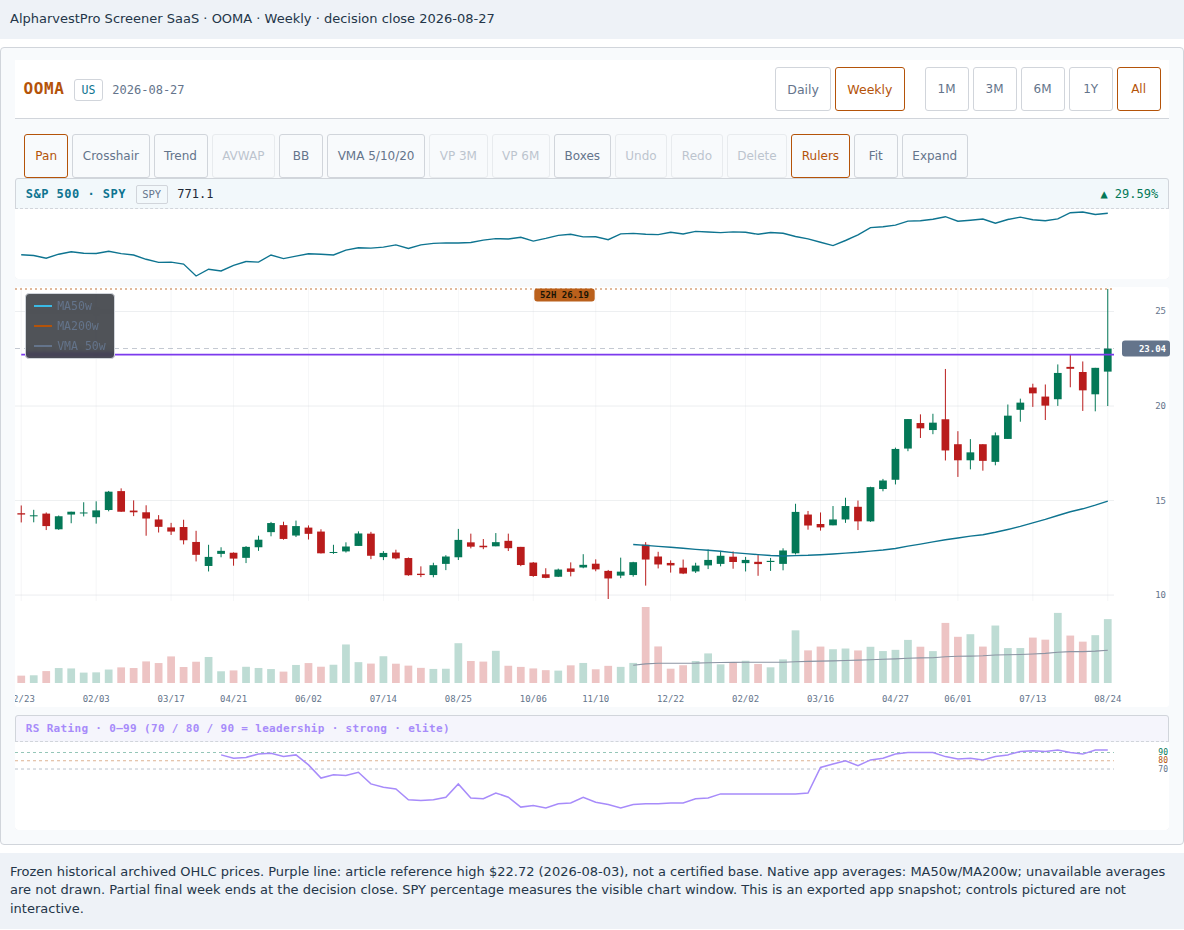
| #2 · Aug 28 · OOMA | Telecom-Consumer Prods | Technology | 217 | $23.05 | $21.21 | $399.28 |
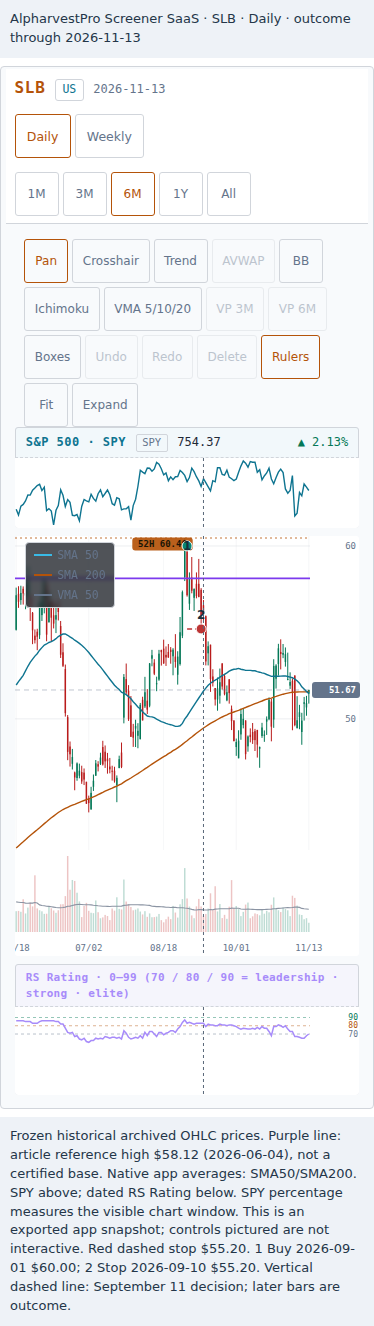
| #3 · Sep 1 · SLB | Oil&Gas-Field Services | Energy | 83 | $60.00 | $55.20 | $398.40 |
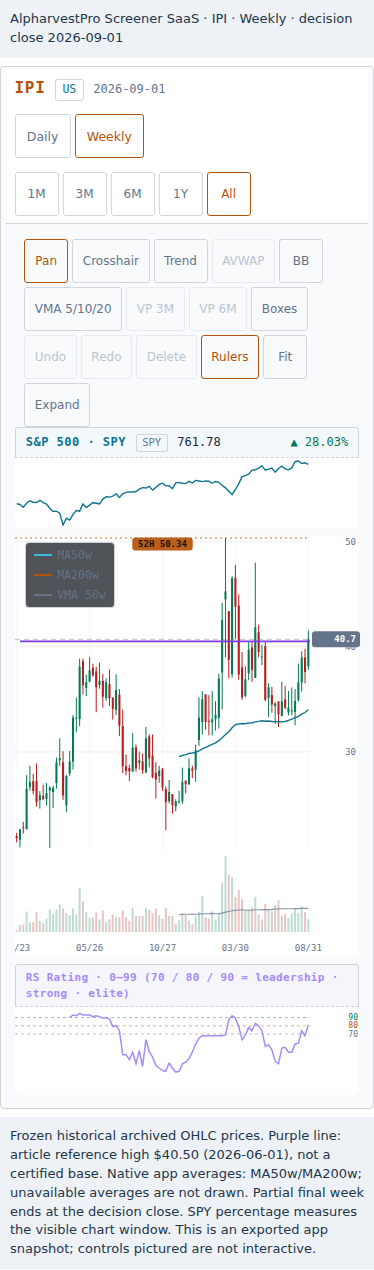
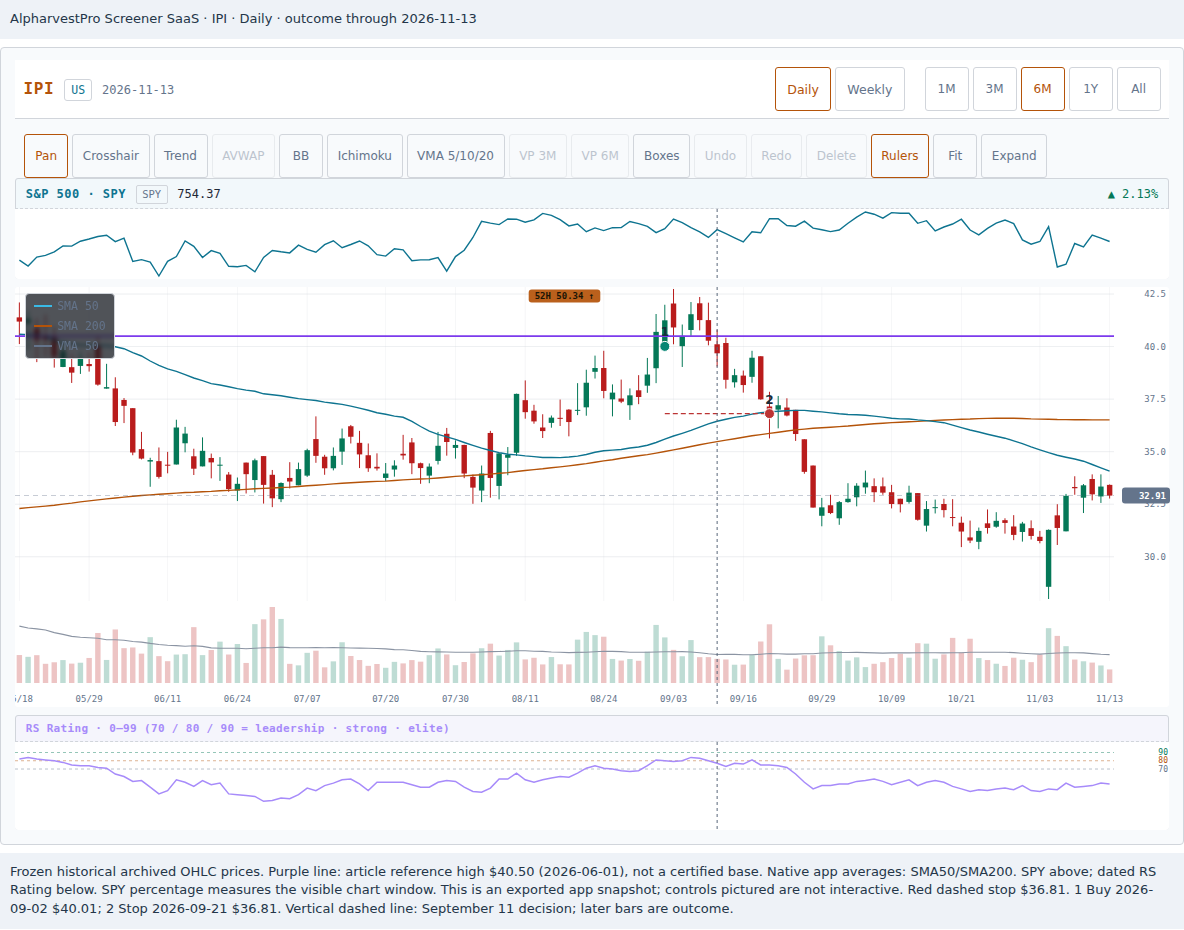
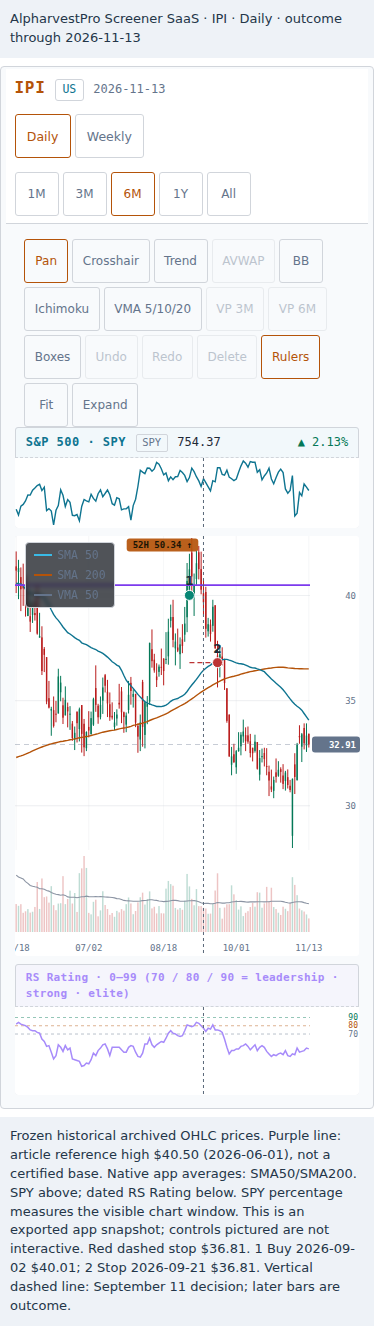
| #4 · Sep 2 · IPI | Chemicals-Agricultural | Basic Materials | 125 | $40.01 | $36.81 | $400.00 |
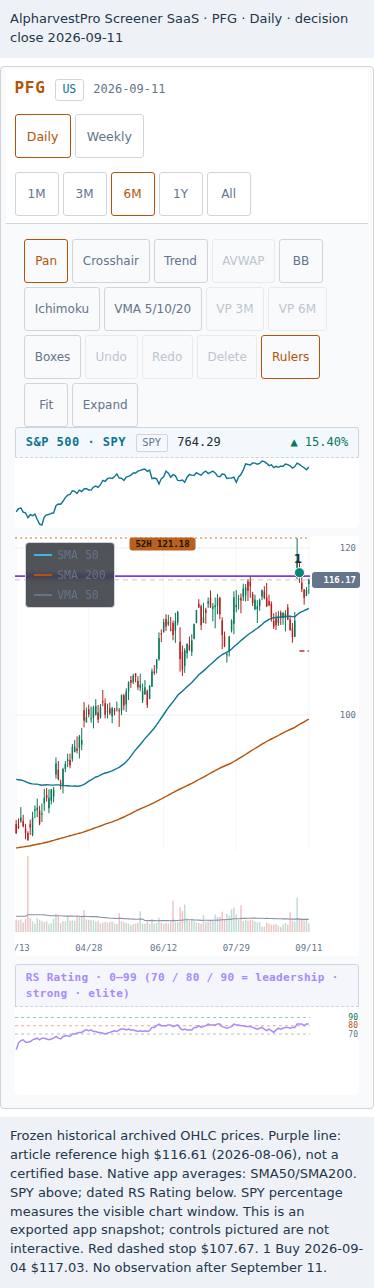
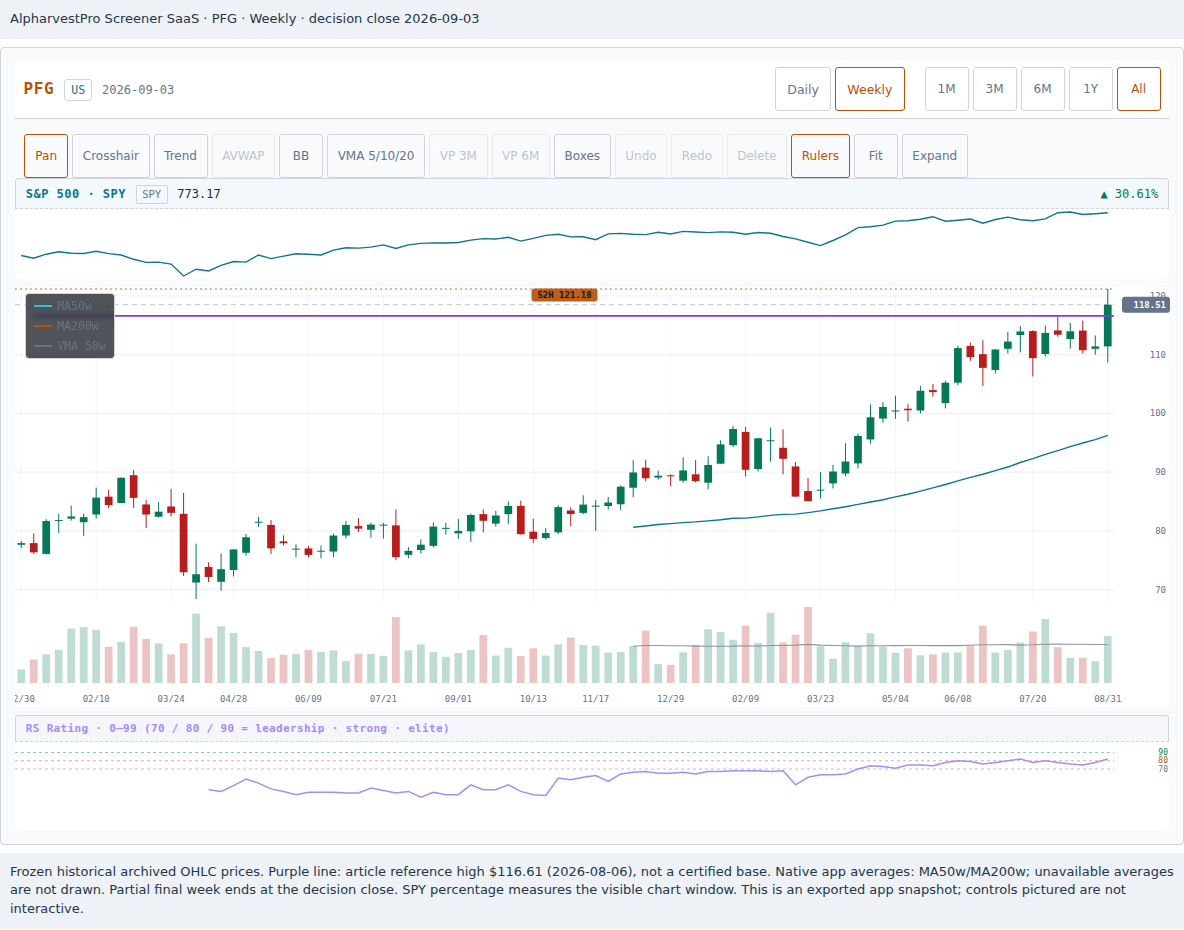
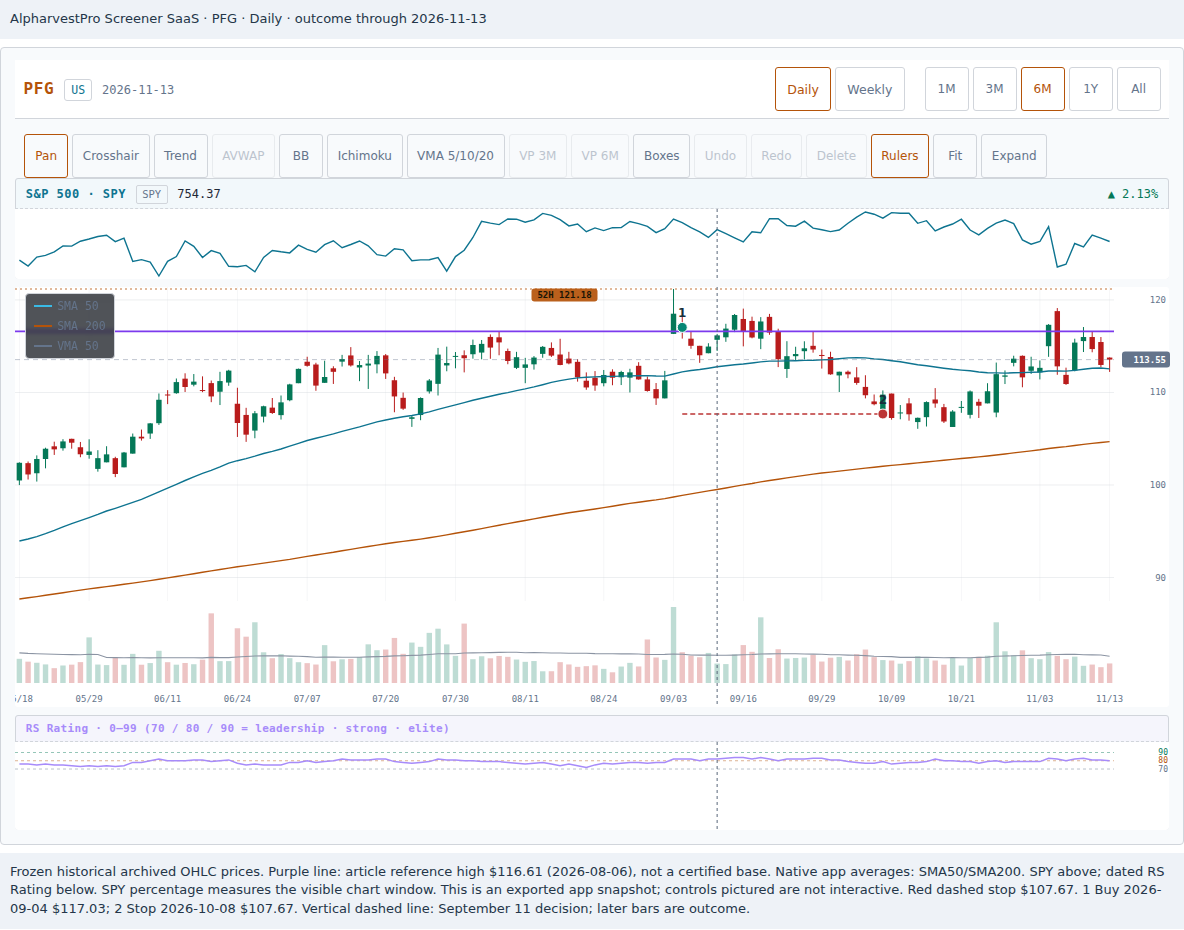
| #5 · Sep 4 · PFG | Insurance-Diversified | Financial Services | 42 | $117.03 | $107.67 | $393.12 |
The five commit $24,860.36 at cost, about 62.2% of the account. Their planned losses add to $1,988.00, nearly 5% of the account, before gaps or costs. For IPI, the arithmetic is 125 shares times $3.20 of risk per share. Different sector labels do not make those dollars disappear.
The Sector column is the app’s November 16 snapshot; dated Sector history is unavailable. Group ranks and RS below are the observations on each decision day.
Which stocks hit their stops?
By the September 11 close, URBN and SLB had hit their stops and been sold. OOMA, IPI and PFG were still held. All three were trading below their purchase prices.
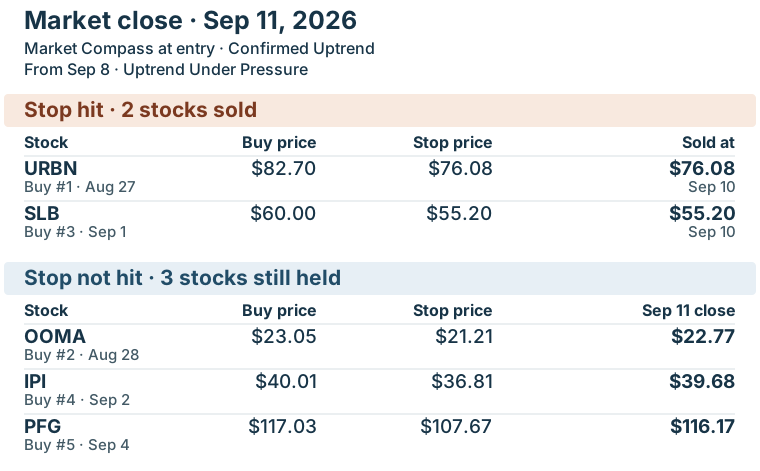
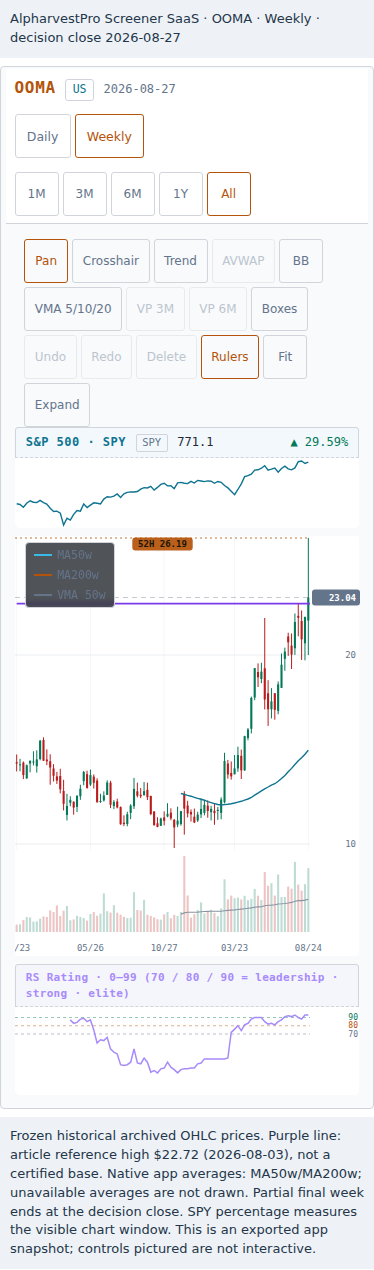
URBN reached its $76.08 stop on September 10, so the account sold the shares at $76.08. OOMA cost $23.05 and closed at $22.77 on September 11. Its price had stayed above its $21.21 stop since purchase, so the account still held the shares and the loss could still change.
Why the buys looked plausible at the time
Read the market in the order the trader saw it. The decision closes were August 26, August 27, August 31, September 1 and September 3. Market Compass read Confirmed Uptrend on every one of them. That kept the market condition for new long positions open under this plan. The September 8 downgrade came after all five purchases; it was not information available when these orders were placed.
Each stock also closed above its reference high with increased trading activity. The reference high is the price level this model uses as a possible breakout line. The volume comparisons below use the preceding 50 sessions, excluding the decision day: 3 times the average means roughly three times as many shares traded.
Two other terms help read the following paragraphs. RS is a relative-strength rating; a higher number indicates stronger price performance compared with other stocks. For group rank, a smaller number indicates a stronger industry group. EPS means earnings per share. Here is what made each stock worth investigating before the next morning’s hypothetical purchase.
URBN — August 26 decision, August 27 purchase. Pocket Pivot and Buyable Gap-Up appearances coincided with volume at 3.29 times its average. The earlier May report had already shown growing sales and earnings, including growth in Nuuly’s subscription business. That gave the price move a business story to investigate. Its RS of 70 and weaker group were reservations, and the fresh August 26 earnings report required another check before entry, as discussed below. Earlier URBN results.
OOMA — August 27 decision, August 28 purchase. It appeared on Pocket Pivot and Buyable Gap-Up with volume at 3.34 times its average. Its RS of 93 and group rank of 45 supplied stronger leadership evidence. The previous day’s results showed higher revenue and GAAP diluted EPS, alongside newly launched AI services for business customers. Price, group and business evidence therefore supported the same research idea. OOMA’s August 26 report.
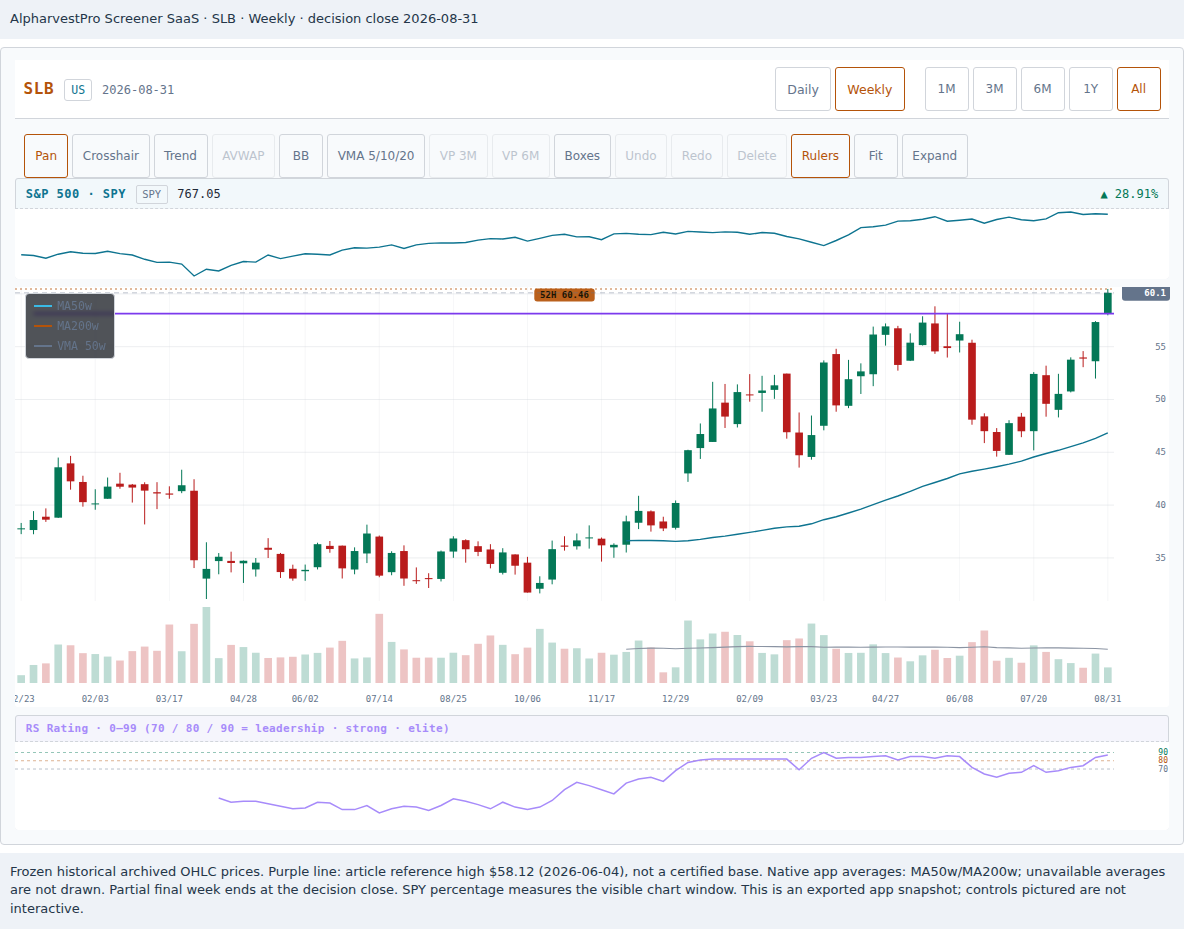
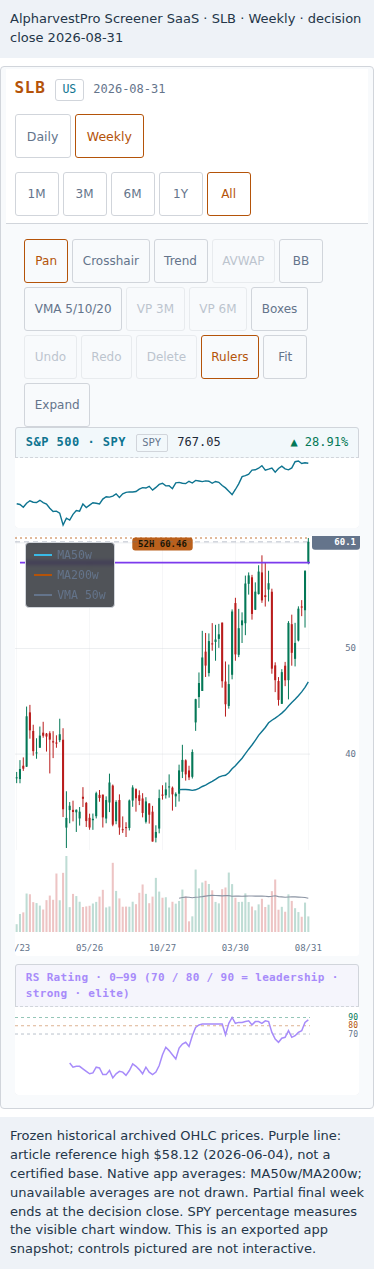
SLB — August 31 decision, September 1 purchase. Repeated VCP Setup appearances during August were followed by a Pocket Pivot on August 31. Volume reached 2.64 times its average, with RS of 87 and group rank of 34. The agreement to acquire Kelvion added a concrete new development to examine. That was the appeal of the entry; the earnings and weekly-stage weaknesses below still mattered. SLB’s August 31 filing.
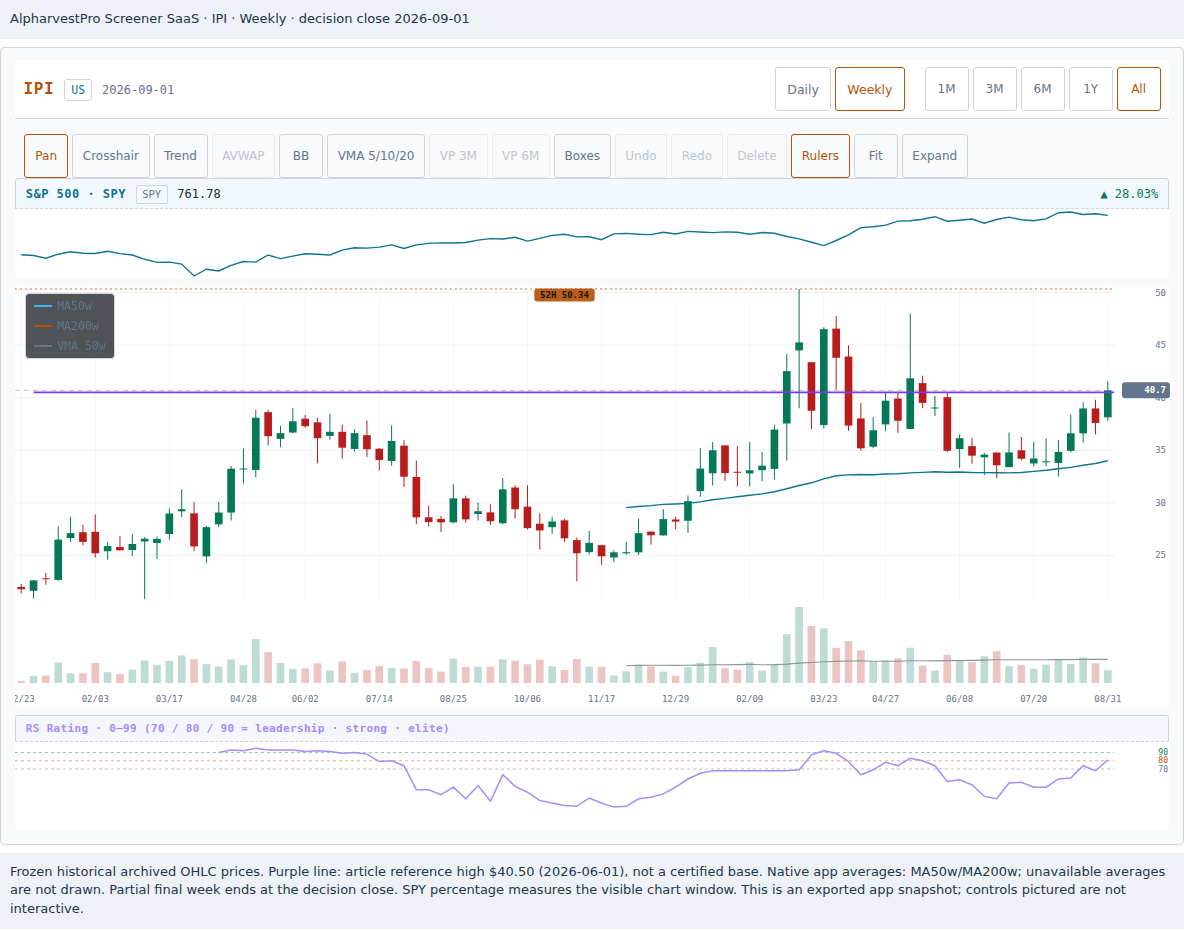
IPI — September 1 decision, September 2 purchase. VCP Setup and Pocket Pivot appearances accompanied the move through its reference high, on volume at 1.89 times its average and RS of 81. The argument was primarily a technical recovery attempt. Its group was outside the published top 50 and its business checks were mixed, so the list appearance needed particularly careful inspection of the larger base.
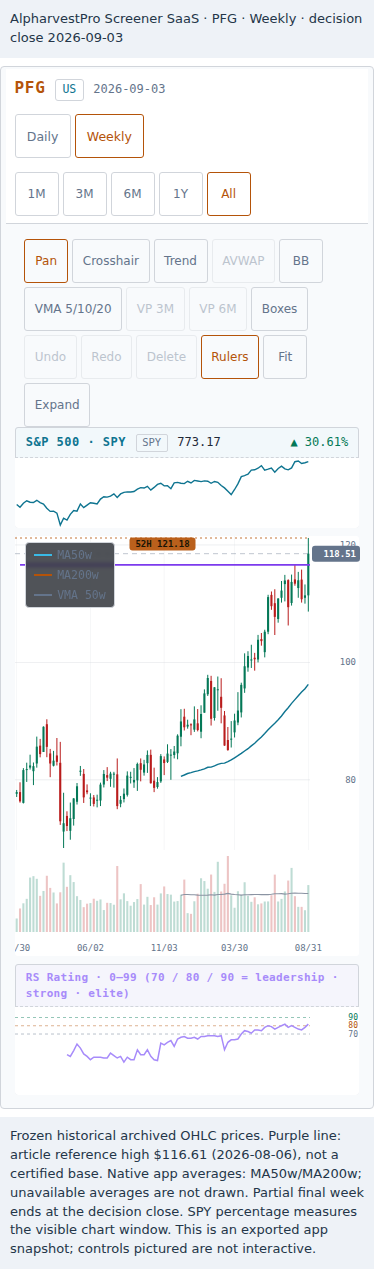
PFG — September 3 decision, September 4 purchase. Pocket Pivot and Buyable Gap-Up appearances came with volume at 2.66 times its average, RS of 82 and group rank of 49. Reported revenue and diluted EPS had grown, and the company had announced an expansion of its retirement-plan partner program. Those were reasons to examine the breakout, while still checking the shape of the base. PFG results · Program announcement.
Before blaming the market, inspect the buys
Start with the weekly stage, then the base, then the setup. These five do not deserve a blanket “good buys, bad market” explanation.
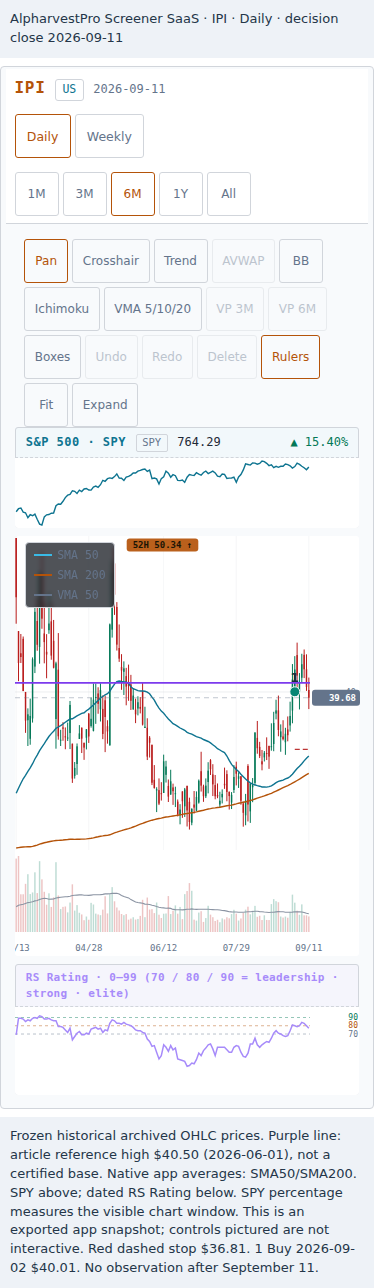
IPI makes the problem especially clear. The screen’s rolling reference high was $40.50, and September 1 closed at $40.70. But the larger consolidation still had its May 13 high at $48.00; the chart’s earlier 52-week high was $50.34 on March 12. Crossing the smaller reference did not clear those overhead prices. The next open was $40.01, already back below the reference high, yet the mechanical next-open rule still bought it. At the decision close, its separately calculated 10-week average was $35.95 versus a 30-week average of $37.59. SLB’s averages also failed that comparison, narrowly: $51.75 versus $51.85.
PFG had a clearer rising weekly trend, but its late-base lows descended: $111.00 on August 11, $110.00 on August 27 and $108.65 on September 1. A subsequent close above the reference high does not retroactively give that base rising lows.
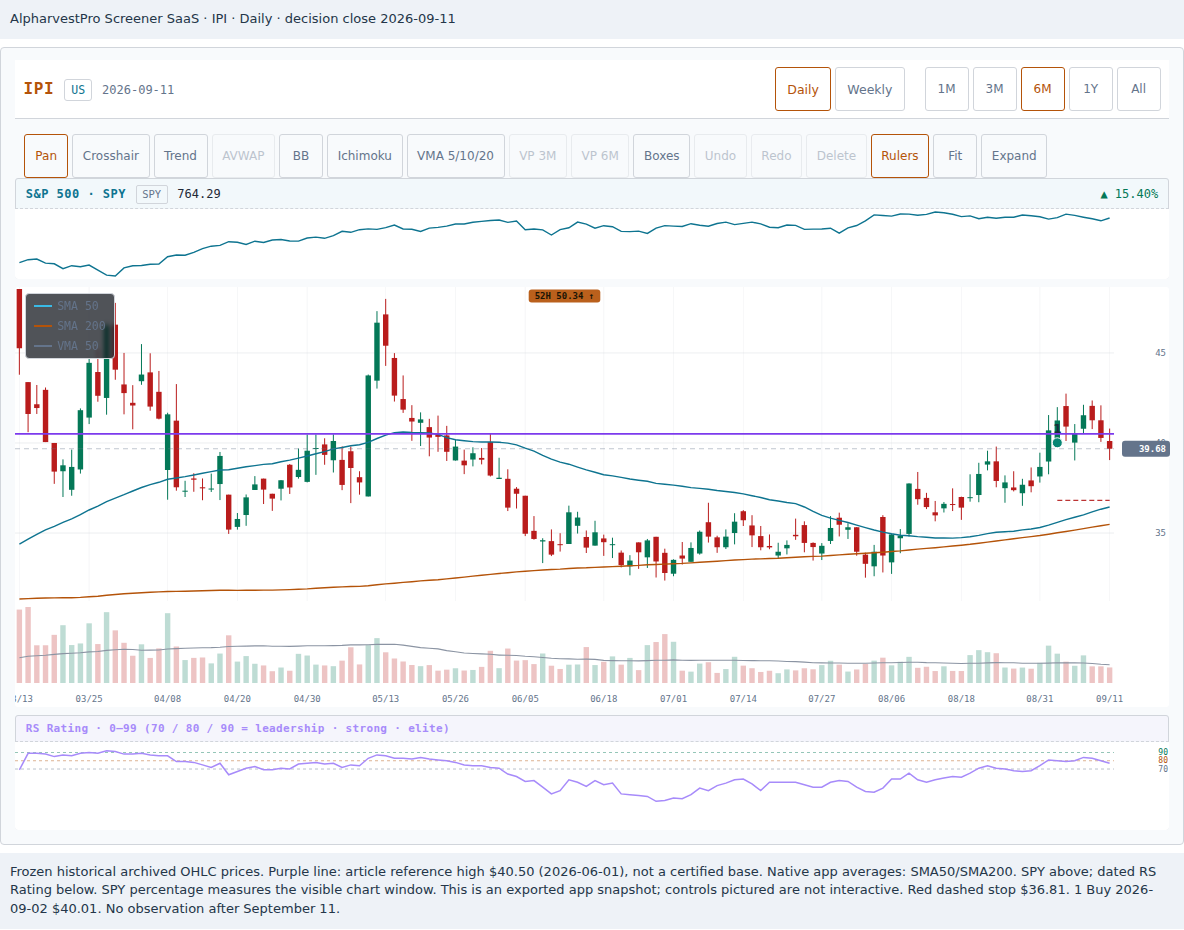
Frozen historical prices rendered by the actual SaaS chart. Inspect all five September 11 charts and their earlier Weekly views. Native product averages are preserved; the separate 10/30-week observation above is an article calculation.
Open the five stock charts and weekly views
September 11 daily charts
- URBN · Full-size chart · Mobile chart
- OOMA · Full-size chart · Mobile chart
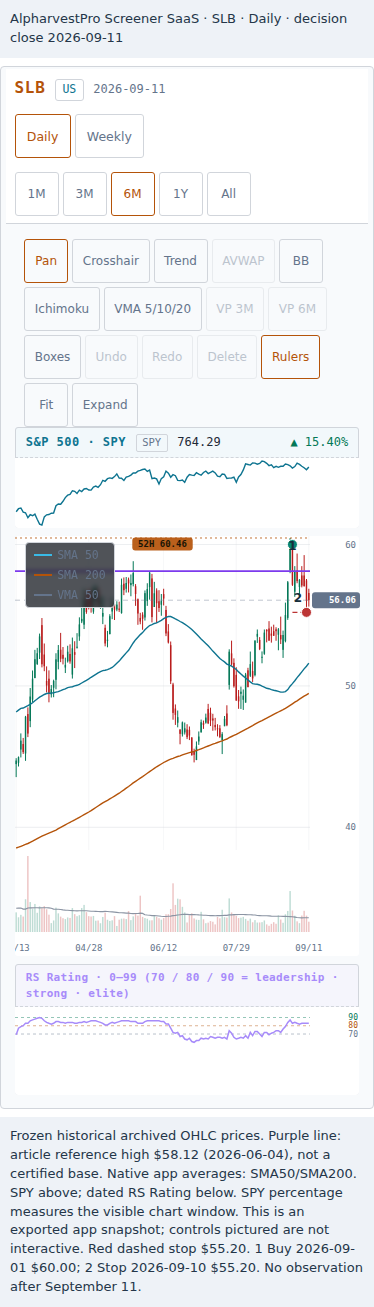
- SLB · Full-size chart · Mobile chart
- IPI · Full-size chart · Mobile chart
- PFG · Full-size chart · Mobile chart
Weekly charts at the original purchase decisions
- URBN · Full-size chart · Mobile chart
- OOMA · Full-size chart · Mobile chart
- SLB · Full-size chart · Mobile chart
- IPI · Full-size chart · Mobile chart
- PFG · Full-size chart · Mobile chart
The business checks were uneven too. SLB’s latest reported quarter had growing revenue but falling GAAP diluted EPS, from $0.74 to $0.52. It had also agreed to acquire Kelvion before its purchase; that was a new development, not proof the shares would rise. IPI’s continuing sales slipped from $67.5 million to $66.7 million, although continuing-operations diluted EPS improved from $0.10 to $0.18. The Intrepid South disposal gain was in discontinued operations and boosted total earnings separately. SLB results · SLB agreement filing · IPI results.
URBN’s decision-day RS was only 70, and its group was outside the published top 50. IPI’s group missed that check too. OOMA and PFG had stronger combinations: their groups ranked 45th and 49th, their RS ratings were 93 and 82, and reported revenue and GAAP diluted EPS grew. OOMA described newly launched AI services; PFG announced an expansion of its retirement-plan partner program. Those facts improve a checklist, not the certainty of a trade. OOMA results · PFG results · PFG expansion.
URBN also released quarterly results on August 26, with an earnings call at 5 p.m. Eastern; the August 27 opening purchase followed that report. Reported earnings included one-time tariff-refund and tax benefits. The context score was frozen at the prior close, but a trader placing the next-open order needed to reassess this fresh information. URBN results · Company event record.
What you know on September 11
Market Compass read Confirmed Uptrend on the five decision evenings. It changed to Uptrend Under Pressure on September 8. Your own purchases are now struggling alongside a weaker headline.
At this point, we are still examining purchases #1–#5. A realized loss comes from shares already sold. An open loss is the loss shown by shares still held at that evening’s price; it can change before the shares are sold.
| Holding | September 11 state | Price profit/loss |
|---|---|---|
| URBN | Stopped September 10; realized | −$397.20 |
| OOMA | 217 shares still held; open loss | −$60.76 |
| SLB | Stopped September 10; realized | −$398.40 |
| IPI | 125 shares still held; open loss | −$41.25 |
| PFG | 42 shares still held; open loss | −$36.12 |
The account is worth $39,066.27 after $795.60 in realized losses and $138.13 in open losses. This is two stops and three losing holdings, not five simultaneous stop-outs.
O’Neil does not promise frequent success. In his chapter on cutting losses, he writes, “In fact, you’ll probably be right less than half the time!” His point is to control the damage, not to treat every losing sequence as a market forecast.
Three choices for the next risk
Minervini’s approach in Think & Trade Like a Champion is progressive exposure: “I scale up on winners and scale back on losers.” O’Neil, in The Successful Investor, says to commit funds gradually, after existing holdings begin to show progress.
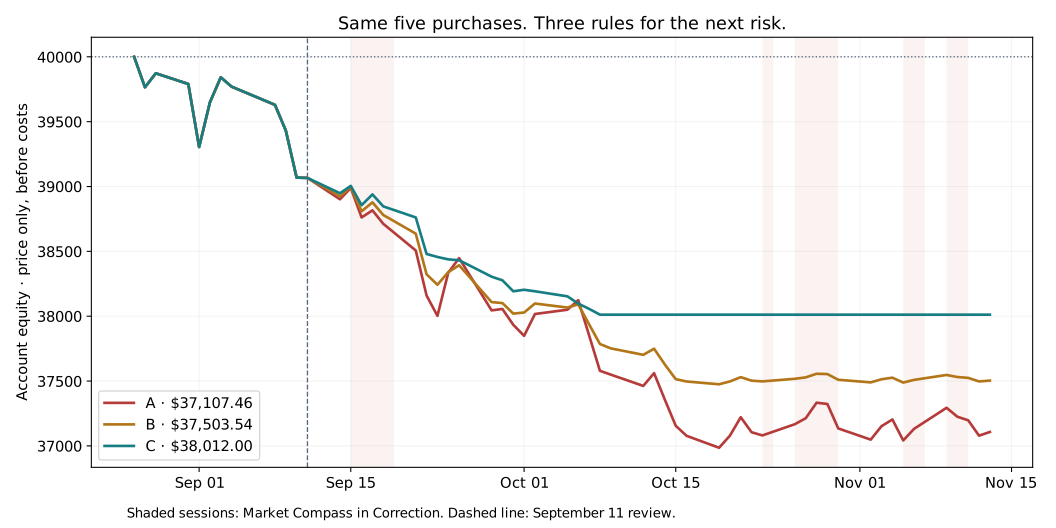
Now make three copies of that same September 11 account. Each starts with the same losses, the same three remaining stocks and the same stops. Only the rules for new purchases from this point onward differ.
- A — keep the same budget: $400 risk budget for each new purchase.
- B — scale back: start at $200; at each close, add together the profits and losses from later positions fully closed that day. A negative total halves the next budget, with a $100 floor; a positive total doubles it, up to $400. Sales of the original five, an open gain or a partial sale do not change this budget.
- C — wait for progress: make no new purchase until one of the original holdings closes above its cost while Compass is outside correction. Once that happens, reopen at A’s sizing. If the last original holding exits first, this comparison stays in cash.
The plans consider the same new opportunities from September 14 through September 23. Each can hold at most five stocks at one time and never borrows. Selling a position makes room for another purchase on the following morning. If several stocks qualify when space is limited, the model gives priority to the one with the higher average value traded each day. An order that cannot fit is skipped.
Those operational choices are this article’s, not a claim that either master prescribed this exact system. In particular, C needs a future restart rule in a real trading plan. We will not invent one after seeing the outcome.
Before opening the outcome: would you risk another $400, reduce the next budget, or wait? Which flaw in these five purchases would you correct before doing any of them?
Continue the story: purchases #6–#9 and the three account results
After September 11: which stock was the sixth purchase?
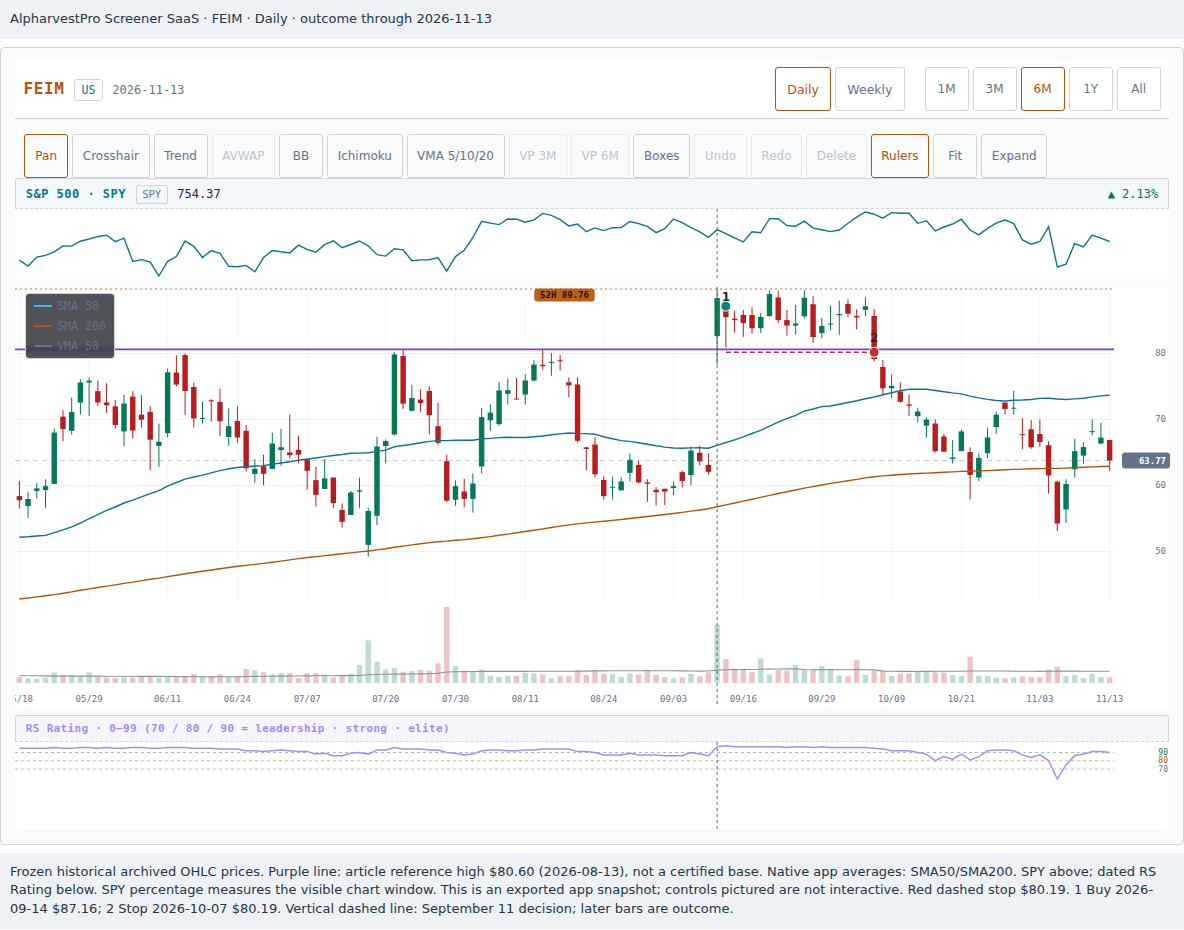
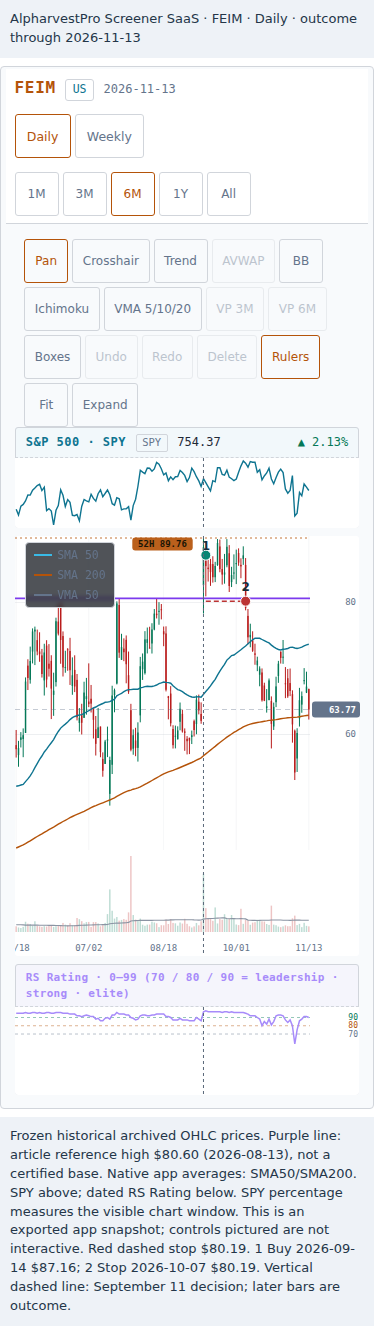
FEIM was purchase #6. AMD came later, as purchase #8. Neither belongs in the original five-stock table, which stops before the September 11 decision.
Plans A and B bought the same four later stocks, with different share counts. Plan C kept waiting and made no further purchase in this record.
| Purchase | Later stock | A: shares | B: shares |
|---|---|---|---|
| #6 · Sep 14 | Frequency Electronics (FEIM) | 28 | 14 |
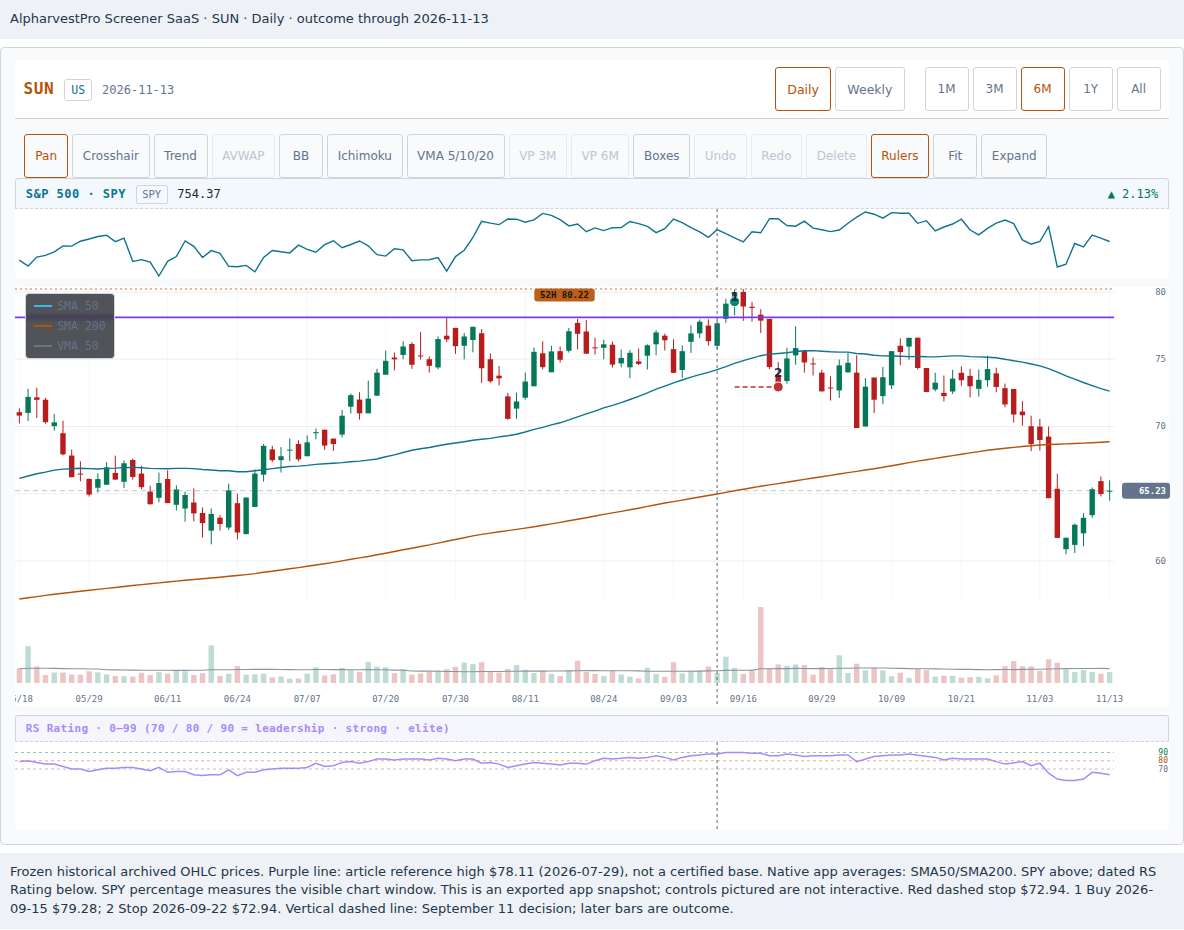
| #7 · Sep 15 | Sunoco (SUN) | 63 | 31 |
| #8 · Sep 22 | AMD | 8 | 4 |
| #9 · Sep 23 | Agilent (ticker A) | 30 | 7 |
The numbers count purchases over time. The five-stock limit counts positions still held at the same time. “Plan A” is the usual-risk account; Agilent’s stock ticker also happens to be A.
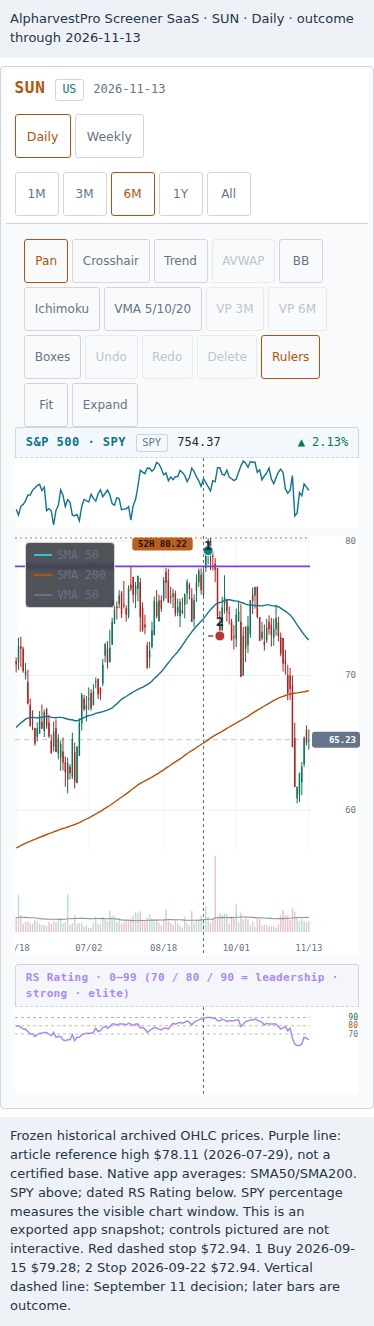
Here is how those later purchases fitted into the account. URBN and SLB had already stopped, leaving two empty places on September 11. FEIM and SUN filled those places on September 14 and 15. Sunoco’s listed securities are common partnership units.
For the sixth purchase, FEIM opened more than 5% beyond its reference high, so even A took only 28 shares: $195.16 of planned risk. B took 14, risking $97.58. SUN used 63 shares in A and 31 in B. The smaller budget therefore meant fewer shares exposed to the same stock-price movement.
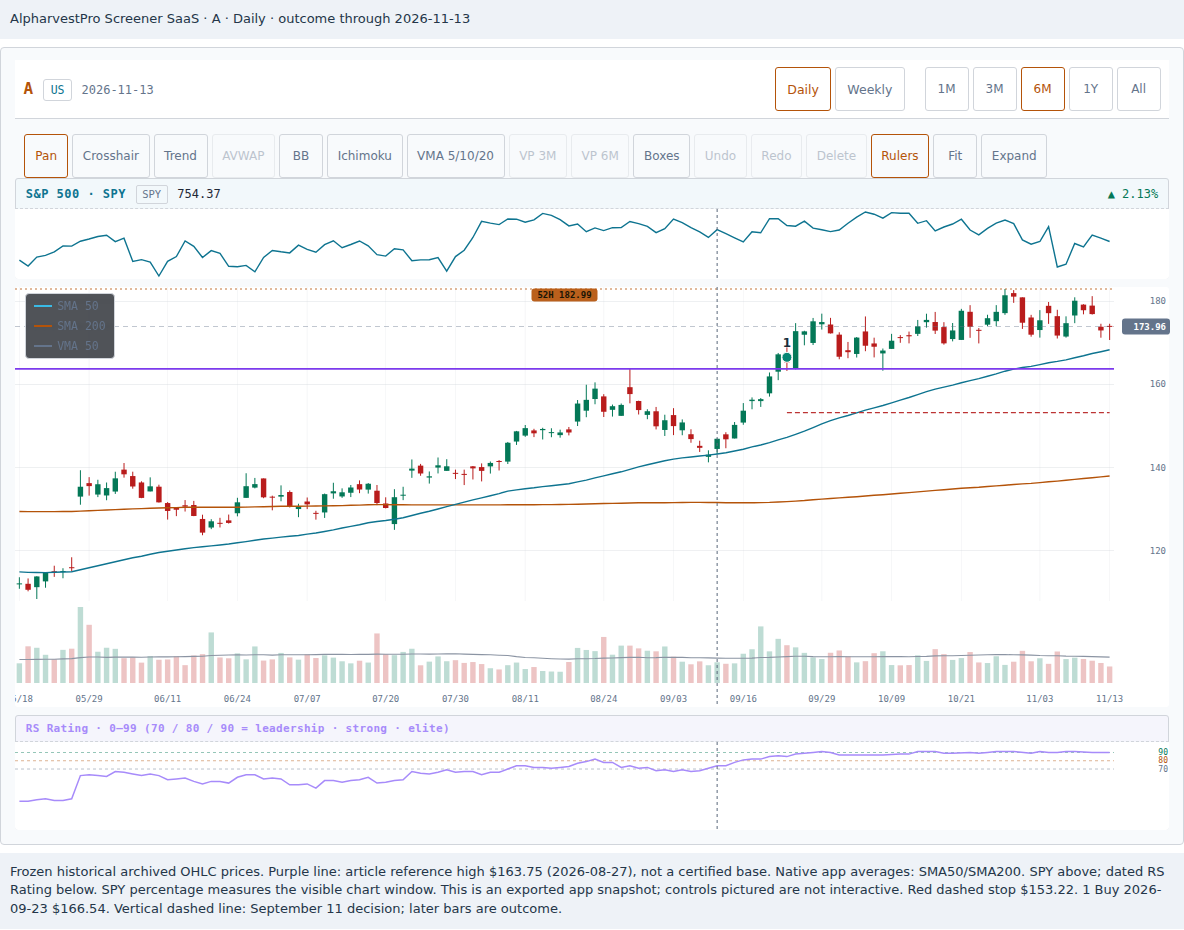
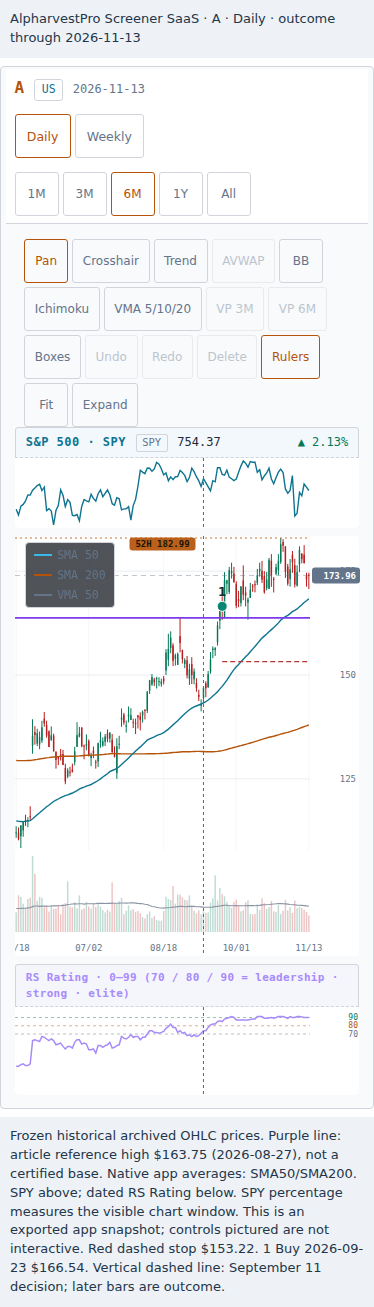
IPI’s September 21 stop opened a slot for AMD on September 22. SUN stopped later on September 22, freeing the next morning’s slot for Agilent (A). That timing matters: B’s AMD order still used the $200 budget. SUN’s completed loss then reduced the next budget to $100, so B bought only seven Agilent shares instead of A’s 30.
The market reading also follows that sequence. Compass entered Market in Correction on September 15 and remained there through September 18. It returned to Uptrend Under Pressure on September 21. A purchase at the September 15 open still uses September 14’s completed reading; that morning cannot know the new headline at the coming close.
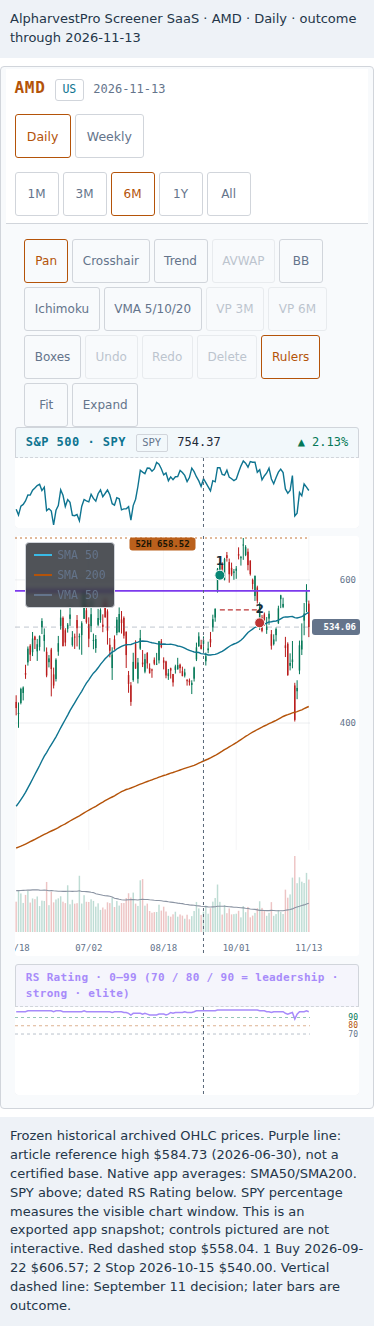
Purchase #8, AMD: why show this chart?
AMD illustrates a particular risk in continuing to buy: a stock can open below the price where you planned to exit. The chart below follows that later trade, from its September 22 purchase to its October 15 sale.
On October 15 it opened at $540.00, below the $558.04 stop. A’s eight shares lost $532.56, more than their $388.24 planned risk. B held four shares and lost $266.28 on the same move. A stop is an exit instruction, not a guaranteed price; owning fewer shares reduced the dollar damage.
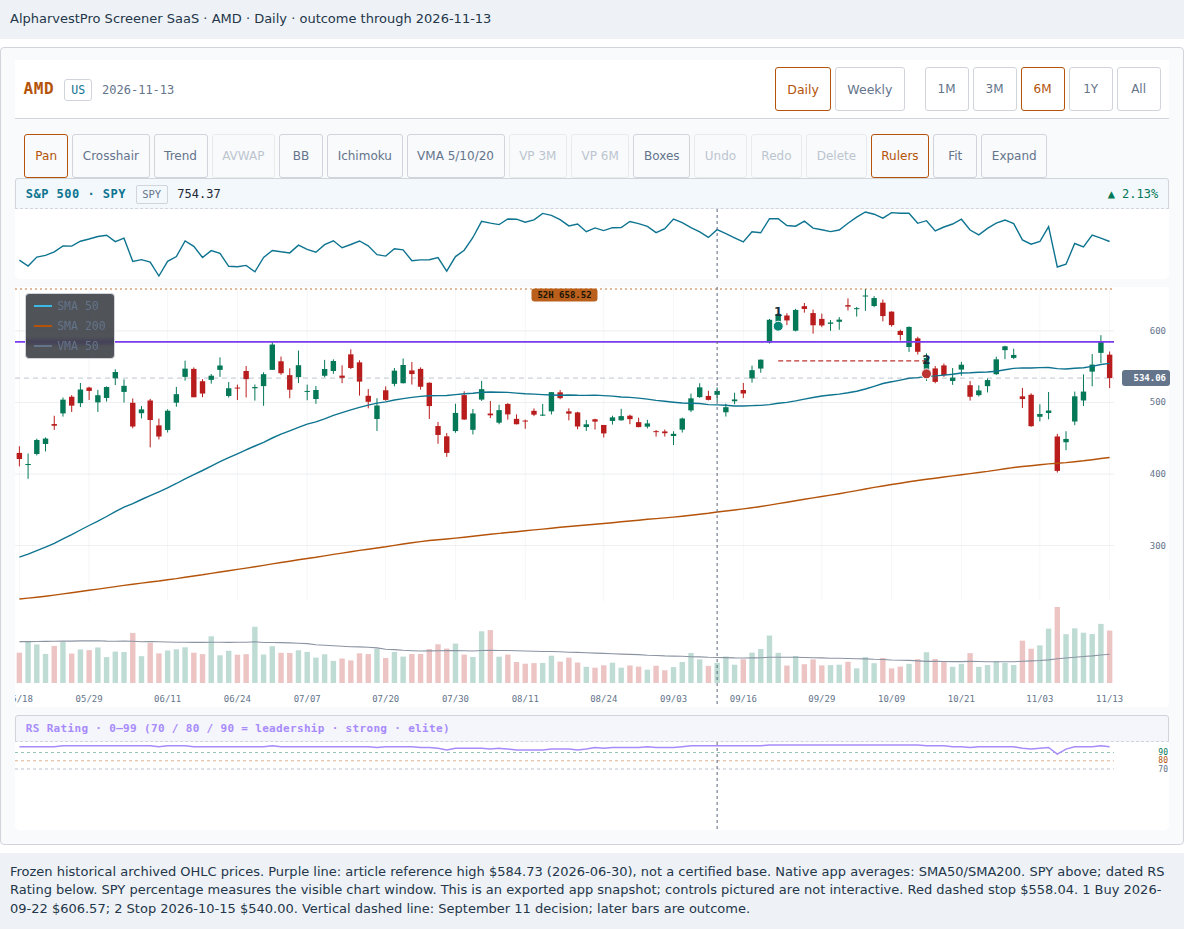
AMD is the eighth purchase in the account. The small numbers 1 and 2 inside this chart mark AMD’s own purchase and sale. This example shows why the actual loss could exceed the planned loss. See FEIM, SUN and every other trade’s chart.
Open the later trade charts
Original five purchases
- URBN · Full-size chart · Mobile chart
- OOMA · Full-size chart · Mobile chart
- SLB · Full-size chart · Mobile chart
- IPI · Full-size chart · Mobile chart
- PFG · Full-size chart · Mobile chart
Later purchases in order
- FEIM · Full-size chart · Mobile chart
- SUN · Full-size chart · Mobile chart
- AMD · Full-size chart · Mobile chart
- Agilent (A) · Full-size chart · Mobile chart
Separate what-if outside all accounts
- CLMB · Full-size chart · Mobile chart
Put all the trades back together: which account lost less?
The following table combines the original five purchases with each plan’s later purchases. P&L means profit or loss. Realized P&L comes from completed sales; open P&L is the gain or loss on shares still held.
IPI stopped on September 21, OOMA on September 28 and PFG on October 8. All five original purchases eventually lost their planned amounts, $1,988.00 together. FEIM and SUN also stopped. Agilent was still held at the end of the comparison.
PFG closed above its $117.03 cost at $118.37 on September 15 and $117.67 on September 18. Both evenings, Market Compass read Market in Correction. The stock and market conditions never passed together, so C’s progress test never reopened buying. It finished entirely in cash after PFG’s October 8 exit.
| Through November 13 | A: same budget | B: scale back | C: wait |
|---|---|---|---|
| Realized P&L | −$3,115.14 | −$2,548.40 | −$1,988.00 |
| Open P&L in Agilent | +$222.60 | +$51.94 | $0.00 |
| Total price P&L | −$2,892.54 | −$2,496.46 | −$1,988.00 |
| Ending equity | $37,107.46 | $37,503.54 | $38,012.00 |
| Largest daily-close drawdown | $3,014.34 | $2,524.88 | $1,988.00 |
Drawdown is the largest fall from an earlier daily account-equity peak, including the starting balance. Intraday drawdowns could have been larger. The account still held Agilent in A and B; those open gains were not banked profits.
A separate missed opportunity: CLMB
The three-account comparison ends above. None of these accounts bought CLMB, and its result is excluded from that table. This last chart is a separate “what if we had bought it?” example, included to show a winner the rules missed.
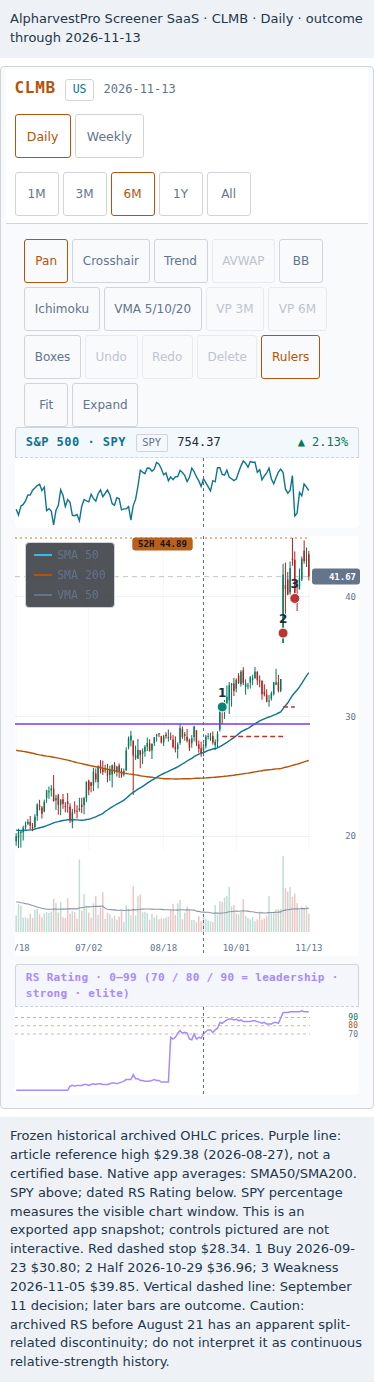
C protected the most capital here, while passing up Agilent’s open gain shown above. Climb Global Solutions (CLMB) illustrates a different limitation: all three plans missed this winner. On September 23 it ranked behind Agilent, MTD and SAIL in the dollar-volume queue. A and B had only one slot, which went to Agilent; removing Agilent alone would still not have admitted CLMB.
CLMB is deliberately a best-case illustration: it was selected after the fact as the largest price gain among the September 22–23 candidates. Other candidates lost, including AMD above. It is not the return a waiting trader should expect to forgo. As a separate full-budget illustration, 162 shares at $30.80 carried an initial stop at $28.34. Half sold at $36.96 on October 29 for a 20% gain. The remaining 81 sold at $39.85 on November 5 under the largest-daily-decline rule. The realized gain was $1,232.01.
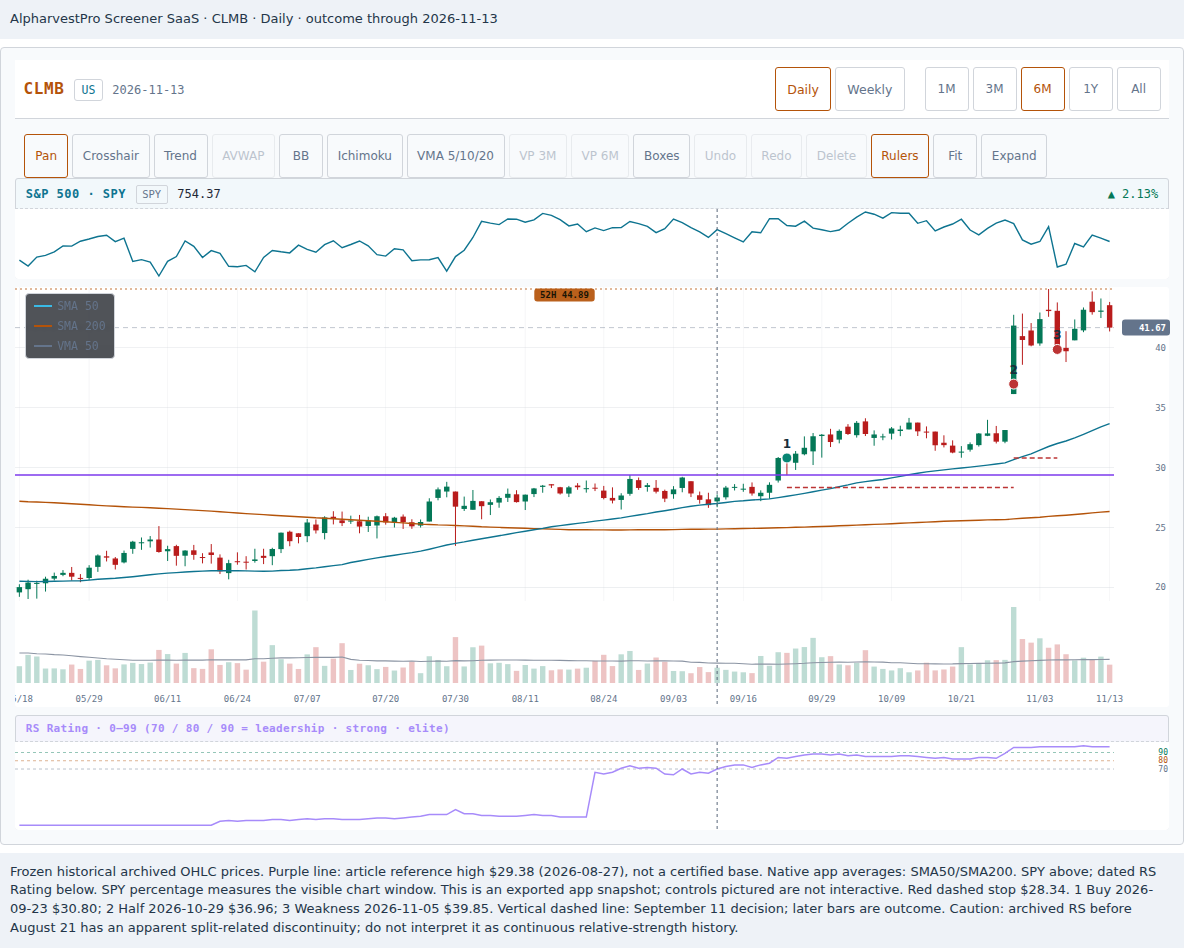
CLMB’s archived RS has an apparent split-related discontinuity before August 21. The chart preserves the dated record; that earlier section is unsuitable for judging a continuous improvement in relative strength.
Its holding period also crossed new information: Climb announced the completed NeoVAD acquisition on October 22 and reported stronger quarterly earnings on October 28, before the half sale. Those were not facts available for the September purchase. Acquisition announcement · Climb’s October report.
That winner also had flaws. Its latest pre-purchase quarter showed growing sales but lower GAAP diluted EPS. A strict earnings check would have skipped it. Its 30-week average had fallen each week from August 3 through September 14, turning up only in the partial week of September 21–22. The model therefore starts its Stage 2 clock on September 21, one session before the signal; this short numerical lookback is not a certified mature uptrend. Neither the profit nor this retrospective contrast repairs those weaknesses. CLMB’s July results.
Thus the table compares three rules applied to one selected sequence. Changing the queue, position limit or restart condition could change which plan looks best. It does not establish that waiting always wins.
What to carry into the next evening
Five losing trades are useful feedback even when they are not a statistical sample. The first response is to separate three questions: did you buy sound setups, did you control their size, and is the market becoming less supportive?
Here, the stock-selection weaknesses were visible before the losses. The changing Compass headline added another reason for restraint. Neither fact cancels the other. Reducing the next order can protect capital while you investigate; it cannot turn an inadequate base into a good one.
The exits combine ideas discussed in our selling-winners article with Minervini’s warning about a stock’s “largest daily and/or weekly price decline since the beginning of a Stage 2 advance” in Think & Trade Like a Champion, Section 9. His Section 4 also illustrates selling half at a 20% gain. This comparison’s exact sequence—an 8% initial stop, half sold at 20%, a breakeven stop on the rest, then the largest daily decline since a numerical Stage 2 anchor—is our mechanical implementation, not a complete reproduction of either author’s exit method.
Next-open purchases, stop fills and daily-bar sequencing are assumptions. Gaps through a stop are modeled at the opening price; spreads, commissions, additional execution slippage, taxes, dividends and partnership distributions are excluded. Company news is another possible influence. AMD agreed to acquire World Labs after its entry and announced Helion before its stop; PFG refinanced a credit facility during its holding period. These are events, not established explanations for the price moves. A shared decline does not establish a shared cause. AMD agreement · Helion announcement · PFG filing.
To run the check in AlpharvestPro, open the Weekly chart first, then the Daily chart and its SPY pane. Read Market Compass, inspect the app’s Industry Group ranking, and write down your actual last five trades: entry, stop, size, realized loss or open result. Check earnings and corporate-event dates on each company’s investor-relations site; the app does not supply an earnings calendar. In the position-sizing calculator, compare your next order at the current budget and a reduced one.
Conclusion
After five struggling buys, it’s easy to feel that the sixth is due for a win. A win rate tells you how often trades have worked across a series. The losses can still come back to back. Linda Raschke explains what that means for the number of shares you buy.
“Everybody’s going to have six losers in a row. That’s a given. Even with a 90% win rate, you will have six losers in a row. So you have to allow for that in your sizing just to begin with.”
— Linda Raschke, in conversation with Waqar Asim on Titans of Tomorrow. Watch the discussion of losing streaks on YouTube from 48:37.
Back on September 11, two of the five stocks had hit their stops. The other three were still below their purchase prices, and Market Compass read Uptrend Under Pressure. For the sixth purchase, Plan A allowed up to $400 of risk, Plan B allowed up to $200, and Plan C waited. Before choosing a share count, finish this sentence in dollars. “If this trade also reaches my stop, my planned loss is ___.”
Reading and chart notes
The O’Neil quotations come from How to Make Money in Stocks, Chapters 9 and 10. See also The Successful Investor, Step 5. The Minervini passages come from Think & Trade Like a Champion, Section 4 (selling half), Section 5 (progressive exposure) and Section 9 (selling into weakness). The article supplies the trading rules and selects the candidates.
List membership is from AlpharvestPro’s dated record; prices come from archived open, high, low and closing data through November 13, retrieved November 17. November 16 was excluded as provisional. SaaS renderer source was captured November 17; SPY, stock and historical RS observations are truncated to each stated cutoff. Native Weekly overlays differ from the separate stage calculations. Cases and contrasts were selected after the fact; all trades are hypothetical.