
Three readers look at the same breakout on the same evening. Each one risks 1% of the account, at the same entry and the same 8% stop. The chart is the same, the stop is the same and the percentage is the same. The rule gives one reader 163 shares, one 1,639 and one 16,393.
The stock trades about 61,000 shares on an average day, and on 19 of its last 50 days it traded fewer than half that. The stop tells each reader how much the price may cost them. It does not tell them whether anyone will be there to buy their shares when the price gets there. That second question depends on the size of the order, and the masters answer it before the trade, not at the exit.
What the masters say about thin stocks
Momentum Masters asked four traders whether they have a minimum volume, and the answers run from 25,000 shares a day to 2 million. Mark Minervini: “I often trade stocks that only trade 100,000–300,000 shares per day and even as low as 50,000 shares per day. You shouldn’t be afraid of thinly traded stocks; you should embrace them.” He adds: “But you have to be careful and only trade a position size you can get out of safely.” David Ryan: “The stock usually has to trade at least 100,000 shares a day, or I avoid it.” Mark Ritchie II: “I usually don’t trade names that don’t trade at least 25,000 shares a day on average.” Dan Zanger: “I try to stay with stocks that do at least 2 million shares a day or more.”
Zanger then tells why. He bought Baidu on a breakout in mid-September 2007 and “held over 60,000 shares” when a downgrade hit near $360. The stock was “eventually down $17 with no buyers in sight,” fell “another $5” before he was out, and finished the day “down a whopping $60.” And it was not a thin stock: “this stock was trading 2 million to 3 million shares a day prior to this sell-off, and I still got smoked.” His conclusion: “adjust your position size to the average daily volume that the stock trades in case you need to get out quickly.”
Gil Morales learned the same lesson in a smaller stock. Selling Lumisys: “Every time we entered an order to sell, it took several minutes to get filled since we had to go to outside market makers in Lumisys and bids were scarce.” He made a rule against stocks under 300,000 shares a day and today uses “a minimum of 350,000 to 500,000 shares in average daily volume.” His co-author Chris Kacher sets a cap on the order instead of a floor on the stock: “I would put no more than 5 percent of the average daily trade into any one position.” And William O’Neil, whose methods both of them follow: “the majority of your stocks should trade an average daily volume of several hundred thousand shares or more.”
Why they filter out thin stocks
The numbers differ by a factor of 80. The reasons behind them are the same.
The exit. A stop is a price, not a buyer. O’Neil: “If there’s no sponsorship, and you try to sell your stock in a poor market, you may have problems finding someone to buy it.” Zanger describes the mechanics: “Every 1,000 shares you sell can cause the price to tank another $0.50 to $1 as you chip out.”
Sponsorship. Volume is the footprint of the institutions that move big stocks. Morales: “the higher the average daily trading volume in a stock, the more likely it has strong institutional participation and sponsorship.” O’Neil calls it “one defense against an unruly market.”
Size. Each floor fits its owner. Zanger’s positions are large enough that, in his words, “It’s very hard to sell 100,000 shares or more of a stock when it breaks down,” so he wants millions. Minervini accepts 50,000 and shrinks the order: “I have to adjust my normal position size to accommodate.” A floor screens the stock; the order still has to fit the stock.
Minervini also gives the case for thin stocks: “a small position in a small stock that makes a big move is better than a big position in a liquid stock that goes nowhere.” The masters do not ask you to avoid every thin stock. They ask you to know, before you buy, how much of it you can sell.
The rules in this article
The purchase follows this series’ end-of-day plan: a close above the base high on volume at least 50% above the average of the previous 50 sessions, O’Neil’s breakout volume, and a purchase at the next open. Nothing is bought while AlpharvestPro’s Market Compass reads Market in Correction.
Three readers take the same trade: a $40,000 account, a $400,000 account and a $4,000,000 account. Each risks 1% of the account at the same entry and the same 8% stop.
Before the order, each writes four volume numbers for the 50 sessions to the decision: the average, the median, the quietest session and the number of sessions under half the average. The last three are this article’s own check. One heavy day can lift an average that most sessions never reach, and a stop does not choose a heavy day.
Two limits from the masters:
- The cap: no more than 5% of the 50-session average in one order (Kacher). If the risk size is larger, buy the cap.
- The warning line: 2% to 3% of an average day. That is Zanger’s Baidu position, 60,000 shares against 2 million to 3 million a day, from his own numbers. It is under Kacher’s cap, and he still “got smoked.”
And one for a purchase that comes late:
- An extended purchase is smaller. If the purchase price is more than 5% past the buy point, O’Neil’s first number, each reader buys half the risk-based size. Morales and Kacher put the choice plainly: if your maximum loss is 7–8% “and the stock is trading 10 percent above your exit point, you should either not buy the stock, or trade a smaller sized position.” The half is this article’s choice.
The exits are the series’ selling rules from our article on selling winners:
- Stop: 8% below the purchase. O’Neil: “cut your losses at a maximum of 8% below your purchase price.”
- Into strength: sell half at 20% above the purchase. Minervini: “My ‘sell half rule’ is a win-win solution.”
- Breakeven: after the half sale, the stop on the rest moves to the purchase price.
- Into weakness: sell the rest at the close of the stock’s largest one-day decline since its Stage 2 advance began. Minervini: “If your stock experiences its largest daily and/or weekly price decline since the beginning of a Stage 2 advance, this is almost always an outright sell signal.”
How we chose these two cases
We read every US stock that appeared from July 7 to October 23 on one of AlpharvestPro’s setup lists: VCP Setup (Minervini), Pocket Pivot (Morales & Kacher), Buyable Gap-Up (Morales & Kacher), Three Weeks Tight (O’Neil), High Tight Flag (Power Play) or Qullamaggie Breakout Setup. We kept the purchases this series’ plan would have made in thin stocks: priced at $12 or more, with an average volume over the 50 sessions before the breakout between 50,000 shares, Minervini’s lowest, and 350,000, the bottom of Morales’s range. Two cases show the contrast best:
- EDRY (EuroDry) is the thinnest: a dry-bulk shipping company with fewer than 3 million shares outstanding.
- OTLY (Oatly) has more than twice EDRY’s average volume, and one day in July supplies a seventh of it.
Both were chosen after the outcomes were known, to show a contrast. They do not measure how often thin stocks work or fail.
Step 1: the weekly chart
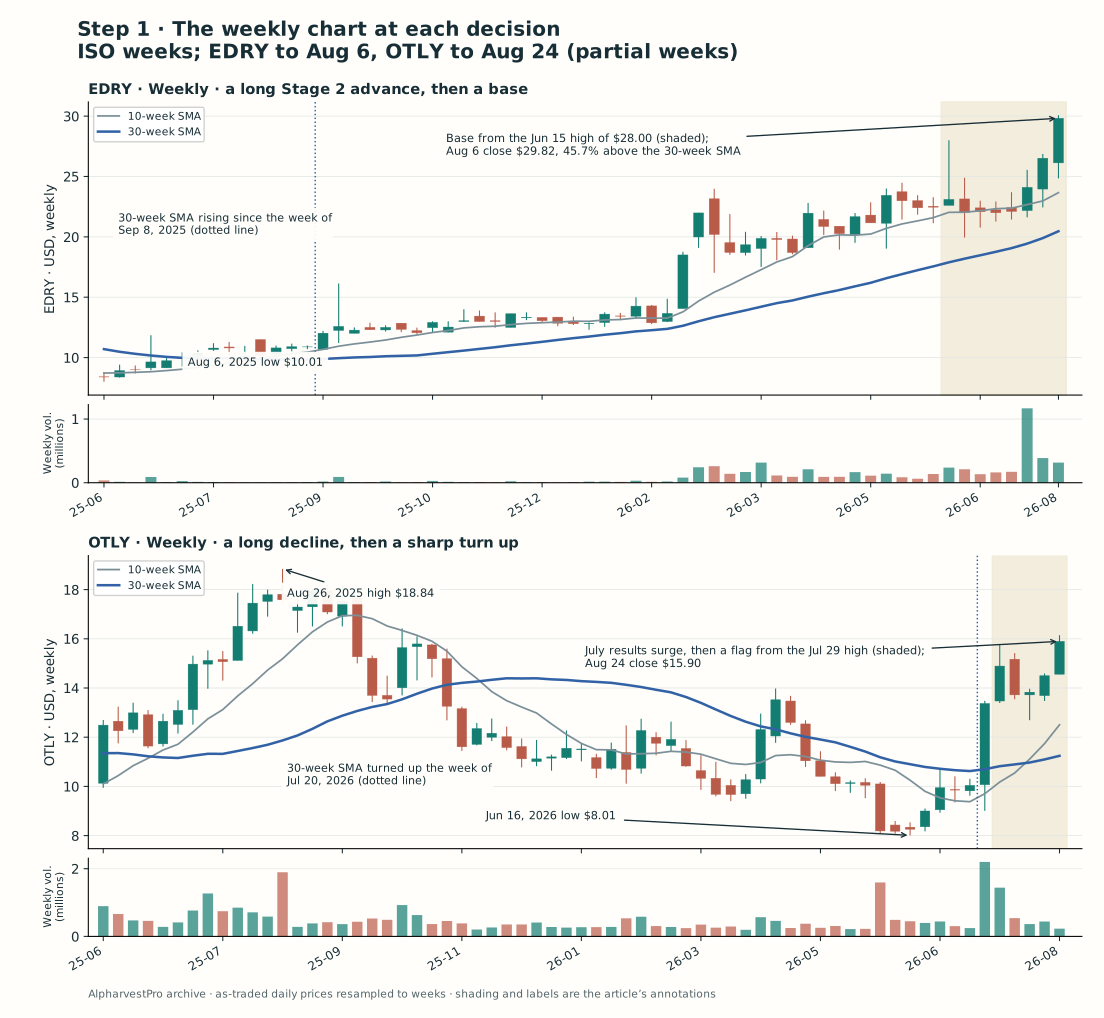
Weekly decision view. Weeks run Monday to Friday; each last bar is a partial week. The shading is this article’s reading of the chart.
The two stocks stood at different points of their stages. EDRY’s 30-week average, Stan Weinstein’s measure of the long-term trend, had been rising for 48 weeks, since the week of September 8, 2025, and the stock had nearly tripled from its August 2025 low of $10.01. OTLY had fallen from $18.84 in August 2025 to $8.01 in June 2026, and its 30-week average had turned up only in the week of July 20, after a jump on its quarterly results. EDRY was deep into Stage 2; OTLY was just entering it.
Steps 2 and 3: EDRY, a breakout on results day
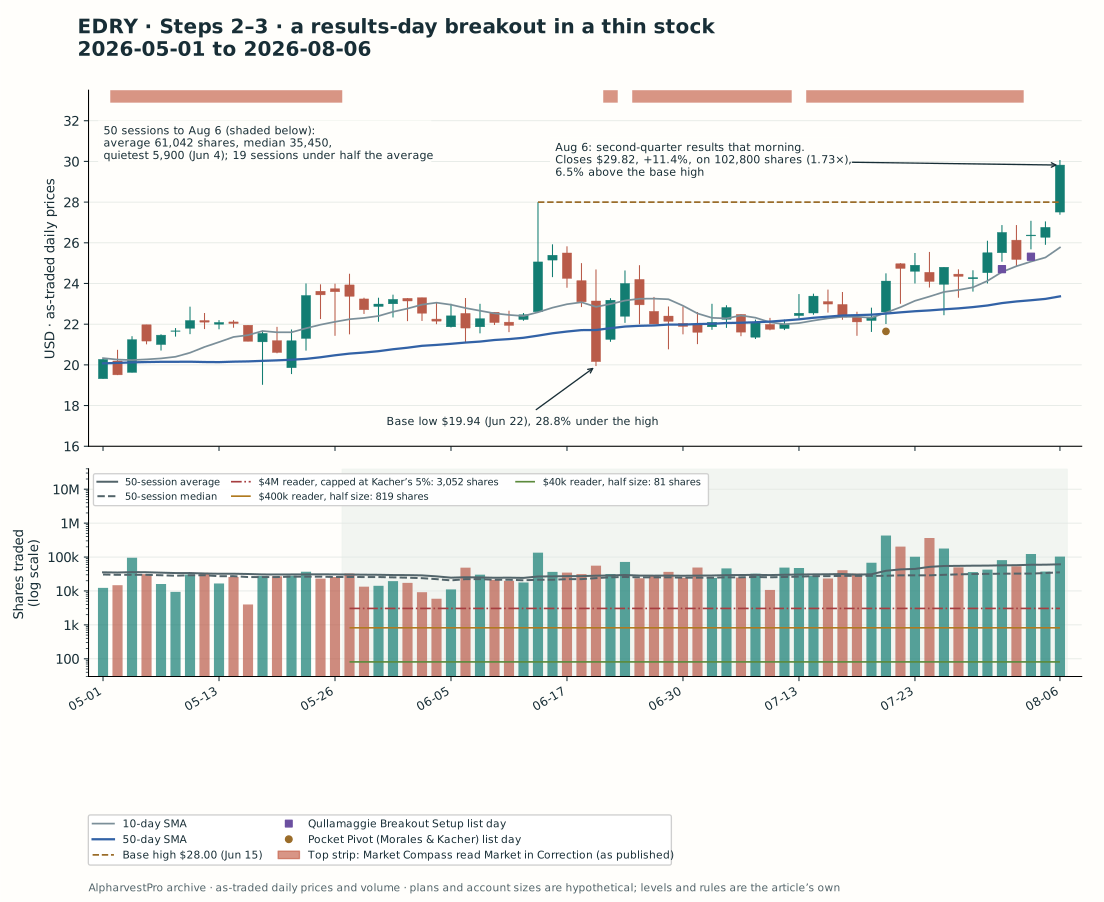
EDRY, daily decision snapshot. No bar after August 6 is shown. The volume panel’s log scale shows each order as a fraction of each day: one step on the axis is ten times the volume.
The base. EDRY reached $28.00 on June 15, fell 12.7% on June 22 to a low of $19.94 and then spent six weeks working back up. It made the Qullamaggie Breakout Setup list on July 31 and August 4.
The breakout. On August 6 EuroDry reported second-quarter results, with a conference call at 9:30 a.m. ET that day. Revenue rose 57.0%, to $17.7 million, and the company earned $2.32 a share after losing $1.12 a year earlier. It said charter rates had reached “levels last seen in 2022.” The stock closed at $29.82, up 11.4%, on 102,800 shares, 1.73 times its average and 6.5% above the base high. Market Compass read Confirmed Uptrend.
The plan. The series’ plan buys at the next open, $30.54 on August 7. That is 9.1% above the $28.00 base high. O’Neil: “If the stock is more than 5% or 10% above the exact buy point off the base, it should be avoided.” EDRY sat between his two numbers. The 8% stop was $28.10, $2.44 a share below the purchase and just above the old base high. Because the purchase is past O’Neil’s 5%, the plan buys half the usual size: each reader risks 0.5% of the account, not 1%.
The volume. Over the 50 sessions to August 6, EDRY averaged 61,042 shares a day, about $1.5 million. The median session traded 35,450. The quietest, June 4, traded 5,900, and 19 of the 50 sessions traded less than half the average. One session, July 21, traded 431,200 shares. By its average, EDRY cleared Minervini’s 50,000-share floor. By its typical day, it did not.
Steps 2 and 3: OTLY, a pocket pivot after a results surge
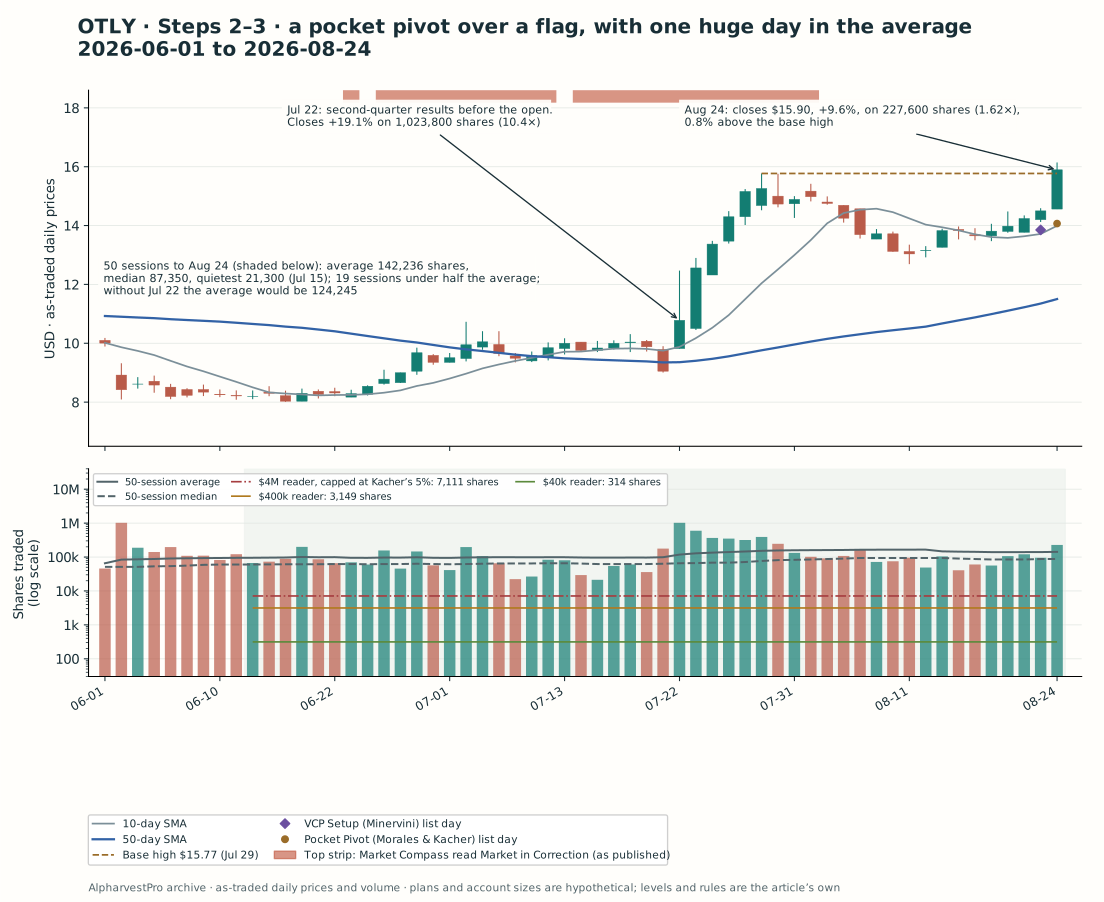
OTLY, daily decision snapshot. No bar after August 24 is shown.
The surge. Oatly reported second-quarter results before the open on July 22. Revenue rose 15.2%, the net loss narrowed to $31.3 million from $55.9 million, and the company raised its outlook for revenue growth this year. The stock rose 19.1% that day on 1,023,800 shares, more than ten times its average.
The flag and the trigger. OTLY peaked at $15.77 on July 29 and pulled back 19.5% to $12.69 on August 11. It made the VCP Setup (Minervini) list on August 21. On August 24 it closed at $15.90, up 9.6%, on 227,600 shares, 1.62 times its average and 0.8% above the base high, and made the Pocket Pivot (Morales & Kacher) list. Market Compass read Confirmed Uptrend. The plan buys at the next open, $15.90 on August 25, with the 8% stop at $14.63, $1.27 a share below.
The volume. Over the 50 sessions to August 24, OTLY averaged 142,236 shares a day, about $1.7 million. The median was 87,350. The quietest session traded 21,300, and 19 of the 50 traded less than half the average. July 22 alone supplied about one seventh of the 50 sessions’ volume; without it the average would have been 124,245. By its average, OTLY cleared Ryan’s 100,000-share floor. By its typical day, it did not.
The checks, before any order
This series asks every purchase to pass four checks that a chart cannot show: something new, numbers that show it, a market in an uptrend and a leading group. O’Neil’s numbers test is strict. He wants “earnings per share up at least 18% or 20% in the most recent quarter versus the same quarter the year before,” supported by “sales growth of at least 25% for the latest quarter.”
| At the decision | EDRY (August 6) | OTLY (August 24) |
|---|---|---|
| Something new | Charter rates at “levels last seen in 2022,” in the company’s words | A raised outlook: revenue growth of 8% to 10% at constant currency this year, up from 3% to 5% |
| Latest quarter | Revenue $17.7 million vs $11.3 million (+57.0%); earnings $2.32 a share vs a loss of $1.12 | Revenue $240.1 million vs $208.4 million (+15.2%); net loss $31.3 million vs $55.9 million |
| Market Compass | Confirmed Uptrend | Confirmed Uptrend |
| Group in the app’s ranking | Transportation-Ship: #30 of 192 | Food-Dairy Products: outside the top 50 |
| Relative-strength rank | 96 | 85 |
EDRY passed the market and group checks, and its sales cleared O’Neil’s 25% by a wide margin. Its earnings swung from a loss to a profit, which O’Neil’s percentage test cannot measure. OTLY failed two checks plainly: it was still losing money, its sales grew 15.2%, and its group was not among the leaders. On these four checks a strict reader would have passed EDRY, at a price past O’Neil’s 5%, and left OTLY alone. We keep OTLY because the question in this article is about the order, and its stop shows it most clearly.
Write the order before you buy
Here is each reader’s order, with the four volume numbers known on the evening of each decision. The share counts use the next morning’s opening price, so the arithmetic is concrete; on the evening of the decision you would use the close.
| EDRY at $30.54, stop $28.10, half size | $40,000 | $400,000 | $4,000,000 |
|---|---|---|---|
| Shares at 0.5% risk | 81 | 819 | 8,196 |
| … of the average day (61,042) | 0.13% | 1.34% | 13.43% |
| … of the median day (35,450) | 0.23% | 2.31% | 23.12% |
| … of the quietest day (5,900) | 1.37% | 13.88% | 138.92% |
| Kacher’s 5% cap: 3,052 shares | Not reached | Not reached | Cap: 3,052 shares |
| OTLY at $15.90, stop $14.63 | $40,000 | $400,000 | $4,000,000 |
|---|---|---|---|
| Shares at 1% risk | 314 | 3,149 | 31,496 |
| … of the average day (142,236) | 0.22% | 2.21% | 22.14% |
| … of the median day (87,350) | 0.36% | 3.61% | 36.06% |
| … of the quietest day (21,300) | 1.47% | 14.78% | 147.87% |
| Kacher’s 5% cap: 7,111 shares | Not reached | Not reached | Cap: 7,111 shares |
For the $40,000 reader, neither stock is thin. Each order is under 0.3% of an average day and under 2% of the quietest day.
The $400,000 reader is the interesting one. OTLY’s order passes Kacher’s cap but sits inside Zanger’s Baidu zone: 2.21% of an average day and 3.61% of the median day. EDRY’s half-size order looks safer at 1.34% of an average day, but against the median day it is back in the zone at 2.31%, and on the quietest day it would have been 13.88% of everything that traded.
The $4,000,000 reader is past every line, even at EDRY’s half size: 13.43% of an average day. Kacher’s cap cuts the order to 3,052 shares of EDRY and 7,111 of OTLY. At the same stops, the planned loss becomes $7,446.88 and $9,030.97, under a quarter of 1% of the account, instead of the roughly $20,000 and $40,000 the risk rule allowed. Most of the risk budget goes unused. Minervini would accept that: a small position in a small stock.
Before opening the outcome, decide: how many shares would each reader buy, of EDRY and of OTLY? Would the $4,000,000 reader buy either one?
Reveal what EDRY and OTLY did next
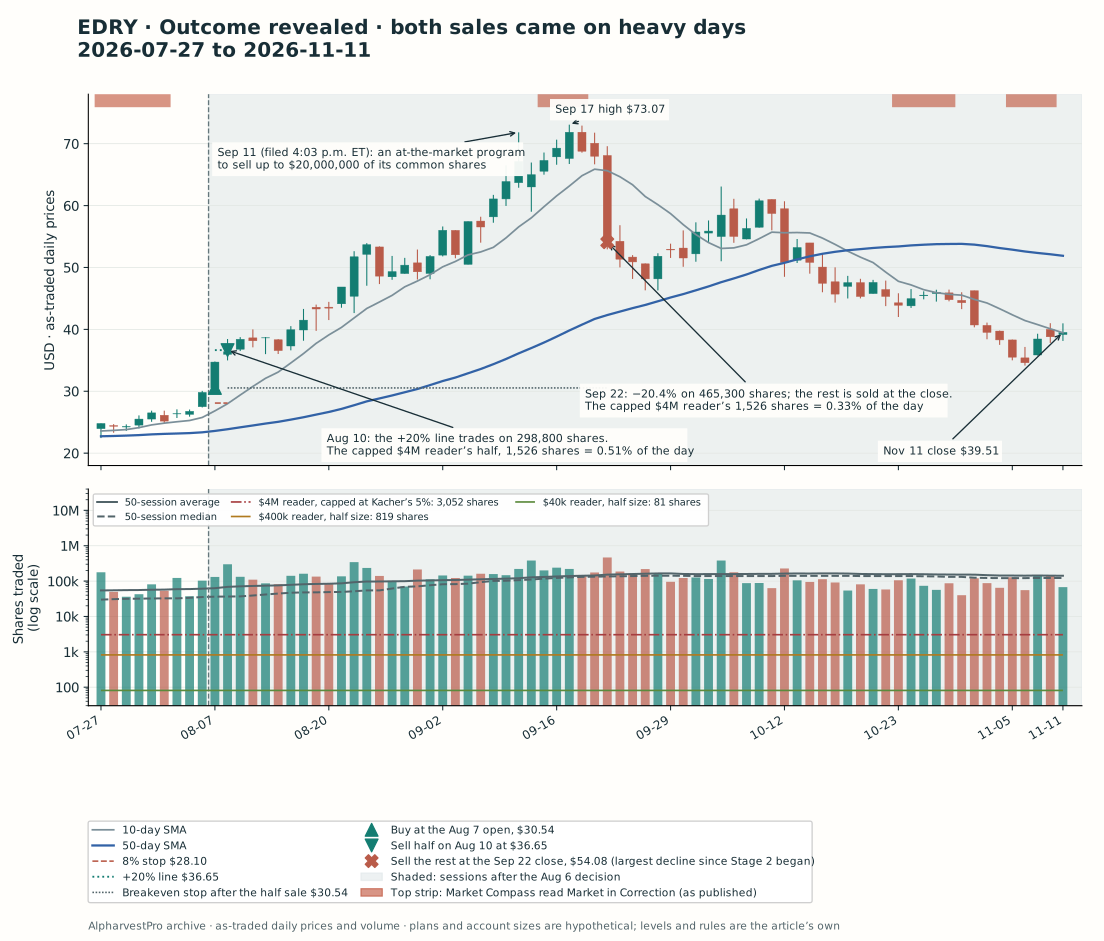
The shaded area was unknown at the decision. The top strip shows Market Compass’s published readings.
EDRY. The purchase filled at the August 7 open, $30.54. That day traded 131,100 shares, so the capped $4,000,000 reader’s 3,052 shares were 2.33% of the whole session, bought at a single opening price. The stock closed at $34.72. On August 10 it reached the +20% line, $36.65, on 298,800 shares, and each reader sold half: 40, 409 and 1,526 shares, or 0.01%, 0.14% and 0.51% of that day. The stop on the rest moved to $30.54.
On September 11 EuroDry filed an at-the-market program under which it could sell “up to $20,000,000 of its common shares” through a sales agent; EDGAR accepted the filing at 4:03 p.m. ET. It had 2,866,591 shares outstanding. EDRY peaked at $73.07 on September 17, 139.3% above the purchase. By its own later report, it sold 150,263 shares that month for $10.2 million, about 3.8% of all the EDRY shares traded in September. On September 22 the stock opened at $68.10 and closed at $54.08, down 20.4%, on 465,300 shares. It was the largest one-day decline since the Stage 2 advance began, larger than the 12.7% of June 22, and the plan sold the rest at the close: 0.33% of the day for the capped $4,000,000 reader. EDRY closed at $39.51 on November 11.
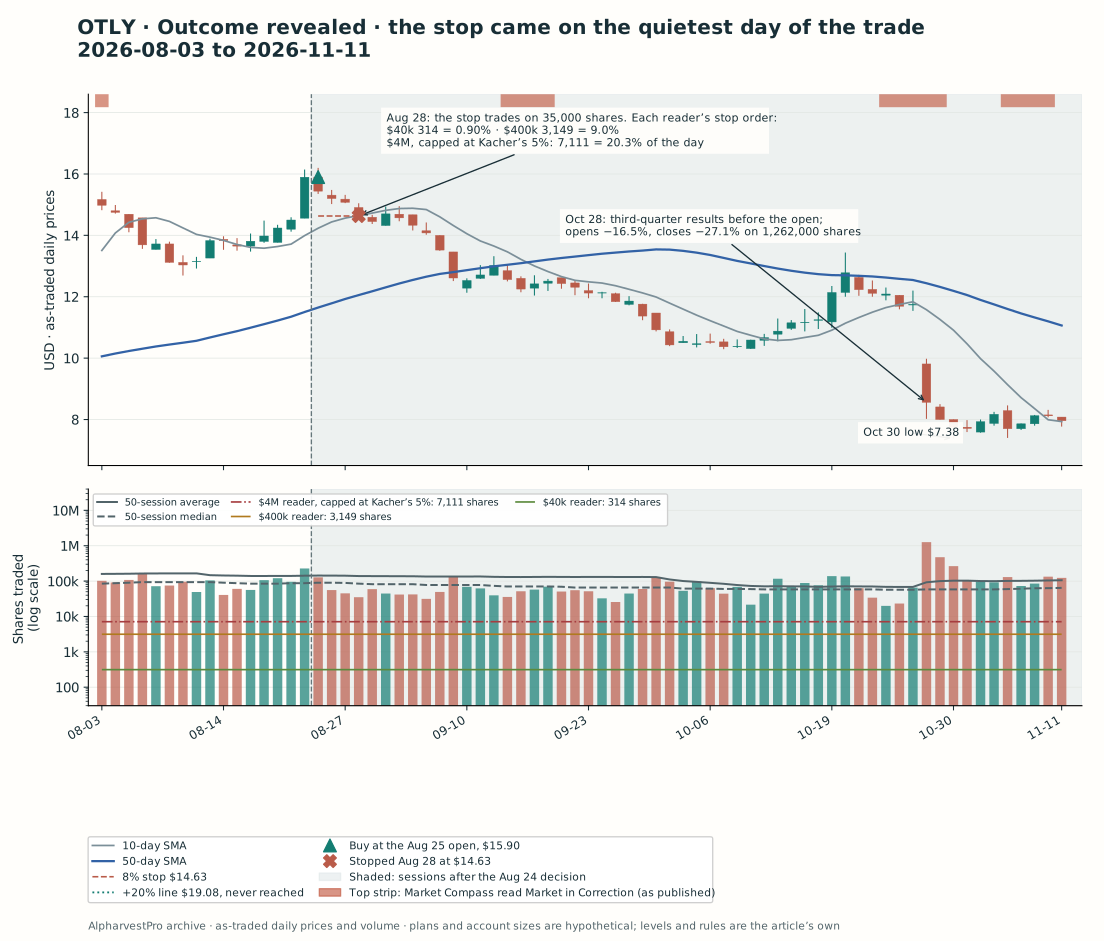
The top strip shows Market Compass’s published readings.
OTLY. The purchase filled at the August 25 open, $15.90, on a day of 128,000 shares; the capped $4,000,000 reader’s 7,111 shares were 5.6% of it. The stock closed at $15.44. Then volume dried up: 55,700 shares on August 26, 45,100 on August 27 and 35,000 on August 28, a quarter of the average. On August 28 OTLY opened at $14.91 and traded down to $14.56, through the $14.63 stop.
On that day the $40,000 reader’s 314 shares were 0.90% of the session. The $400,000 reader’s 3,149 shares were 9.0%, at least three times Zanger’s Baidu share. The capped $4,000,000 reader’s 7,111 shares were 20.3%. Without Kacher’s cap, the risk-sized order of 31,496 shares would have been 90.0% of everything that traded. Daily bars cannot show what price the larger orders would have received. They can show that the stop’s price assumed buyers who were not there in that number.
After the stop, OTLY did not trade above $15.05 before its next report. On October 28, before the open, Oatly reported third-quarter results and cut its outlook for adjusted EBITDA to $16 million to $20 million, from $25 million to $35 million. The stock opened 16.5% lower and closed down 27.1% on 1,262,000 shares. It reached $7.38 on October 30 and closed at $7.96 on November 11.
| Result to November 11, before costs | $40,000 | $400,000 | $4,000,000, capped at Kacher’s 5% |
|---|---|---|---|
| EDRY, half size | +$1,209.54 | +$12,150.39 | +$45,245.90 |
| OTLY, if every stop filled at $14.63 | −$398.78 | −$3,999.23 | −$9,030.97 |
| OTLY’s stop order, share of its day | 0.90% | 9.0% | 20.3% |
What the order size changed
The rules and the prices were the same for all three readers. What changed was the order’s share of each day, and that decided whether the prices in the table were real.
EDRY’s sales came on heavy days. The half sale came on a day of 4.74 times its average volume and the last sale on 3.23 times, the kind of day Zanger sells into: “When trading large positions or thinly traded stocks, it’s far easier to reduce into volume spikes after the stock has made a substantial run than to sell on down days with or without volume.” Even the capped $4,000,000 reader’s sales were 0.51% and 0.33% of their days. The pressure point for EDRY was the other end: the capped order of 3,052 shares was 8.6% of a typical day, bought at one opening price.
OTLY’s stop came on the quietest day of the trade. Nobody chose that day; the stop did. The average said 142,236 shares. The day said 35,000. For the $40,000 reader the difference did not matter. For the $400,000 reader the sale was 9.0% of the day, and for the capped $4,000,000 reader 20.3%. That is Zanger’s Baidu in miniature: the volume was there on most days, and not on the day it was needed.
Kacher’s cap held the large reader to 3,052 shares of EDRY and 7,111 of OTLY, and their planned losses to $7,446.88 and $9,030.97. It also held the EDRY gain to $45,245.90, about 1.1% of a $4,000,000 account. It did not make OTLY’s sale small: 20.3% of a quiet day is still a large order. The cap is a ceiling, not a guarantee.
The half size cost EDRY’s readers half the gain. The $40,000 reader made +$1,209.54; a full-size purchase would have made +$2,425.19. That is the price of the rule. It is there for the extended purchases that fail, and this one did not.
None of this needed hindsight. On the evenings of August 6 and August 24, the median and the count of quiet sessions were already on the page. Both said the same thing: on a typical day, these stocks traded about 60% of what their averages implied.
What these cases cannot show
- Selection. Both stocks came from a screen of the dated record, run after the outcomes were known, and were chosen to show a contrast. They do not measure how often thin stocks work or fail.
- Daily bars. Daily data shows how many shares traded, not at what prices or in what order. A sale’s share of a day’s volume is not a fill: it does not show the bids at the stop or the price an order would move. The results for the larger readers assume fills that a real order of that size might not have received, by an amount these data cannot measure.
- The case we dropped. The first draft of this article used IBEX (IBEX Limited). On October 19 it closed at $45.69 on 77,100 shares and appeared on NR7 Squeeze Setup (Linda Raschke), RS Leaders (O’Neil) and three other lists, but it had no buy point: under this series’ plan, its September 11 close of $39.80 stayed 6 cents below the September 3 high of $39.86. The draft’s reference trade, from the October 20 open of $45.95 with a stop at $42.90, was stopped on November 5 at a low of $42.70. After the close that day IBEX filed its quarterly results; EDGAR accepted the filing at 4:18 p.m. ET. The next day the stock traded down to $41.50, through this series’ 8% stop of $42.27, and closed at $49.52, up 15.2%. It closed at $55.32 on November 11. A window that ends early can teach the opposite lesson.
- Context checks. EDRY was bought 9.1% above its base high, at half size, the morning after a results-day breakout. OTLY failed the numbers and group checks. The published group ranking lists only the top and bottom 50 groups. The earnings check reads one quarterly release, and the market check uses Market Compass’s headline reading as published after each close.
- Events. EDRY’s at-the-market program put the company among the sellers in its own thin stock; the article draws no conclusion about why the stock fell on September 22. EuroDry filed another report on November 12, after this window. OTLY’s October report came after its stop. This article draws no conclusion about any company’s business or charter market.
- Fills and costs. Purchases use the next open. A stop fills at its level, or at the open if the stock opens below it. Commissions, spreads, slippage, market impact and taxes are excluded.
- Price basis. Prices and volumes are as traded. For both stocks the app’s chart bars match these prices.
- Whose rules. The volume floors are Minervini’s, Ryan’s, Ritchie’s, Zanger’s, Morales’s and O’Neil’s; the 5% cap is Kacher’s; a smaller position for an extended purchase is Morales and Kacher’s; the exits are O’Neil’s and Minervini’s; Market Compass adapts its counts from O’Neil. The three readers, the half size past 5%, the median and quiet-session check, the 2% to 3% computed from Zanger’s figures, the screen’s volume band and rounding the cap down are this article’s.
Running it in AlpharvestPro
- After the close, open a setup list, such as VCP Setup (Minervini), Pocket Pivot (Morales & Kacher) or Qullamaggie Breakout Setup (Pro and Ultra), and note the data date.
- Narrow the list by liquidity. The web screener’s Liquidity Floor filter (Liquidity floor in the WHOP app) applies named profiles, several of them named for the traders in this article. Their exact calibrations are proprietary, and the numbers in this article are the books’, not the app’s. Treat the floor as a first screen. It does not size your order.
- Weekly first, then the base and the trigger. Switch the chart to Weekly, then mark the base high and measure how far the close is past it. More than 5% is past O’Neil’s first number: if you still buy, buy smaller.
- Then the market. Open Market Compass and buy nothing while it reads Market in Correction.
- Read the volume panel. Look at the last 50 sessions and write four numbers: the average, a typical day, the quietest day and how many days traded less than half the average.
- Size the order twice. In the Kelly Position Sizing Calculator (Pro and Ultra), add to your risk inputs an Average Daily Volume and a Maximum ADV Participation of 5%, Kacher’s cap. It shows Shares Allowed by Risk, Shares Allowed by Liquidity and the Binding Constraint. Run it once with the average and once with the typical day. Without it, size the risk in the position-size calculator and divide by the volume yourself.
- Then the checks. Read the company’s latest release on its investor-relations page, since the app does not show report dates, and find the stock’s Industry Group in the Industry Subgroups ranking (full lists for Pro and Ultra).
- After the trade, write each sale’s share of that day’s volume next to its price.
Conclusion
The masters disagree on the number and agree on the question. Ritchie trades stocks with 25,000 shares a day and Zanger wants 2 million, but both size the order to the stock, because a stop is a price and the exit needs a buyer. Kacher puts a cap on the order. Minervini accepts a small position in a small stock. Zanger learned at 2% to 3% of an average day that even a liquid stock can run out of buyers.
EDRY and OTLY passed the floors on their averages and failed them on their typical days. For a $40,000 account that did not matter. For a $400,000 account it put the order in Zanger’s zone, and at OTLY’s stop the sale was 9.0% of the day. For a $4,000,000 account only Kacher’s cap kept the orders within reach, and even capped, OTLY’s stop order was 20.3% of its day.
Before your next order in a thin stock, write two numbers beside the chart: your shares as a share of a typical day, and as a share of the quietest day. If the second is large, the stop on your chart is a hope about other people’s bids. Buy fewer shares, or let this one go.
Reading and chart notes
Mark Minervini, Momentum Masters, Section 2, question 2 (Minervini, Ryan, Zanger and Ritchie on minimum volume; Zanger’s Baidu account) and Section 9, question 8 (Minervini’s sell-half rule; Zanger on reducing into volume spikes); Think & Trade Like a Champion, Section 9 (selling into weakness). Gil Morales and Chris Kacher, Trade Like an O’Neil Disciple, Chapter 2 (Kacher’s 5% of the average daily trade) and Chapter 4 (Morales on Lumisys and volume as a sign of sponsorship); In the Trading Cockpit with the O’Neil Disciples, Chapter 1 (a smaller position when the stock trades far above your exit point). William J. O’Neil, How to Make Money in Stocks, Chapter 3 (current earnings and sales), Chapter 5 (buying no more than 5% or 10% past the buy point), Chapter 8 (sponsorship), Chapter 11 (the 8% loss limit), Chapter 12 (average daily volume as a defense) and Chapter 20 (rule 10, several hundred thousand shares). Stan Weinstein, Secrets for Profiting in Bull and Bear Markets, on the 30-week average. Company facts come from EuroDry’s reports on Form 6-K of August 6, September 11 and October 5, 2026, and Oatly’s second- and third-quarter releases of July 22 and October 28, 2026; IBEX’s filing time is EDGAR’s acceptance time.
Prices and volumes are AlpharvestPro’s as-traded daily archive through November 11, 2026, retrieved November 13; weekly bars are built from the same daily data. List membership comes from the app’s stored daily list history, which begins July 7, 2026. VCP Setup has been on the web screener since May 2026; Pocket Pivot became a list of its own on July 16, 2026, from a signal recorded since February 4, 2026; Qullamaggie Breakout Setup was added on July 11, 2026. Group ranks come from AlpharvestPro’s published US industry-group ranking as it stood each day, which lists the top 50 and bottom 50 groups; the stocks’ groups are the app’s own assignments. Market readings are Market Compass’s headline as published after each close, from its dated archive, which begins May 1, 2026. All cases were selected retrospectively. The plans and account sizes are hypothetical, use whole shares and exclude costs; actual stop execution, and any fill for an order that is a large share of a day’s volume, is not guaranteed. A historical list match does not establish when an alert was delivered.

