
After the close on Thursday, October 22, 2026, two stocks on the AlpharvestPro Screener offered very different reasons to pay attention. TriNet (TNET) had finally cleared a high that had held since July. Union Pacific (UNP) had fallen through Monday’s low, then recovered it before the close. Both appeared on the Screener’s Pocket Pivot (PP) list, based on the work of Gil Morales and Chris Kacher. Each rose on more volume than on any down day in its previous ten trading sessions. Only one had broken out.
On October 21, Market Compass read Confirmed Uptrend. On October 22, the S&P 500 and the Nasdaq Composite both closed below their 50-day moving averages. The headline slipped to Uptrend Under Pressure. The rally panel answers a second question. Has the rebound shown enough strength to count as a new uptrend? The Nasdaq’s September 21 close was its highest in 252 trading sessions, about 52 weeks. That new high had confirmed the rally, and the confirmation still stood on October 22. A strong up day on rising volume, called a follow-through day, can also confirm a rally.
If you had $40,000 and room for one new position, would you buy TriNet’s breakout, take a smaller position in Union Pacific’s recovery, or leave the cash alone?
David Ryan explained how the market changes what he looks for in Momentum Masters. “If it is a choppy market, breakouts have a tendency to fail or not make much progress. In that case, I buy more pullbacks.” He also described the cost of waiting in a strong uptrend, when a leader can keep going before offering another entry. The choice of stocks, the Market Compass rule and the trades below are ours. Read the November 6 David Ryan story in its English tab
What a breakout buyer saw in TriNet
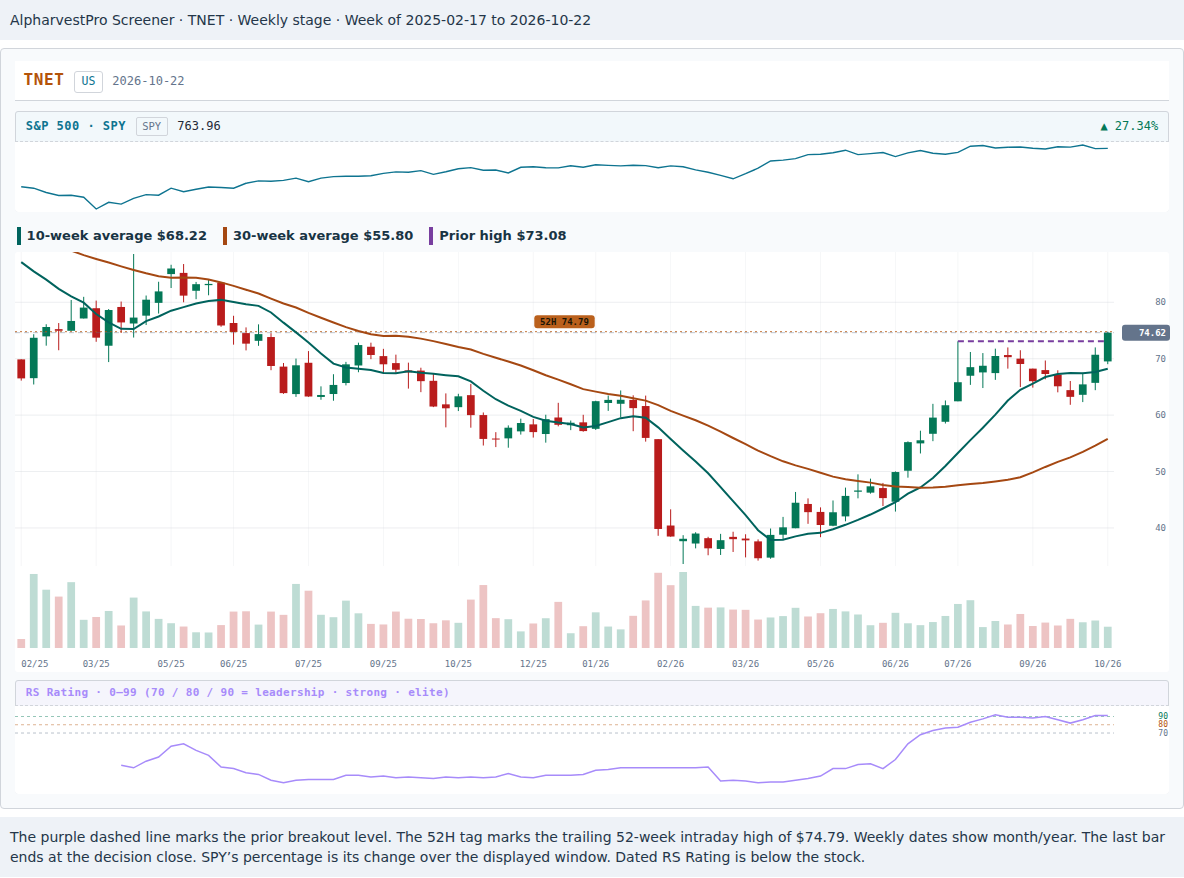
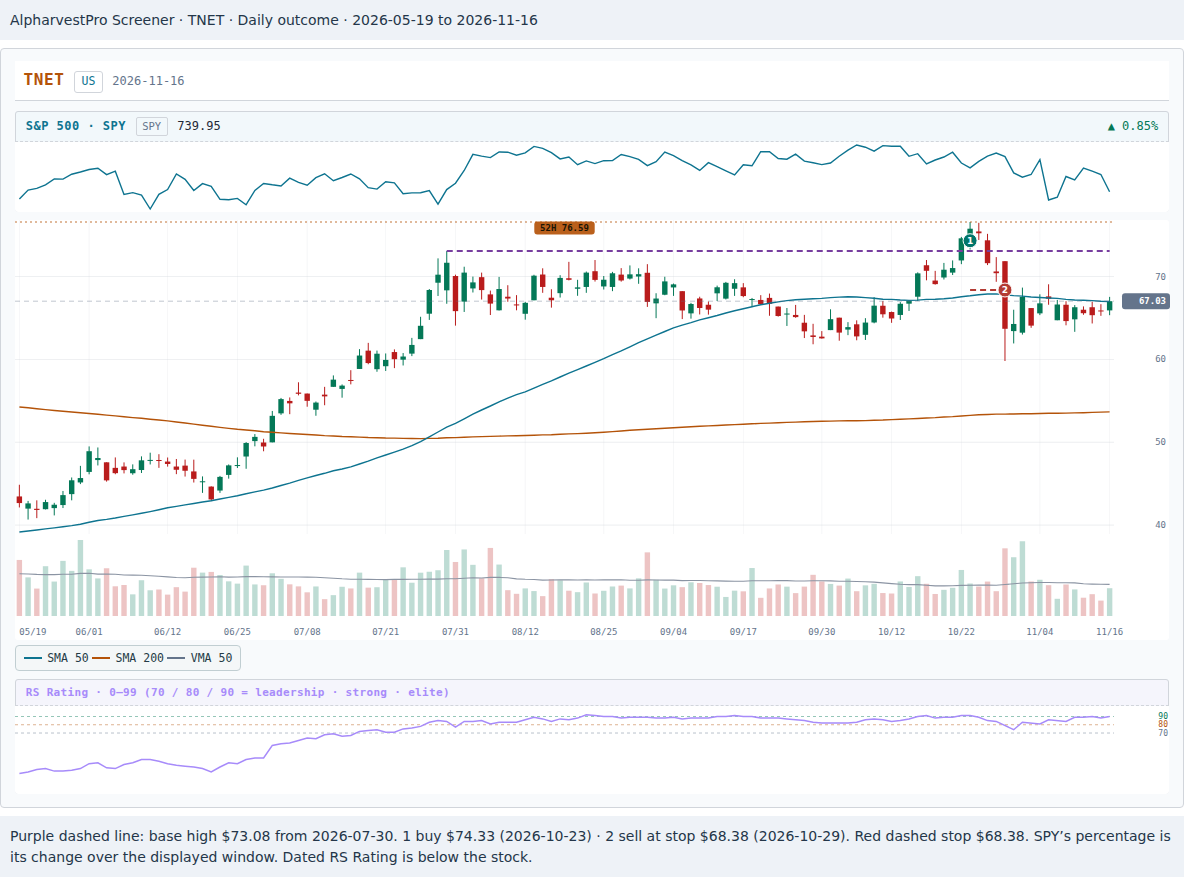
Start with the weekly chart. TriNet’s 10-week average was above its rising 30-week average. By Thursday’s close the stock had recovered from its September pullback and moved above the July high, with one trading day still left in the week. The purple line marks that earlier high of $73.08. The orange 52H tag marks a different price, the $74.79 high reached on October 22 itself.
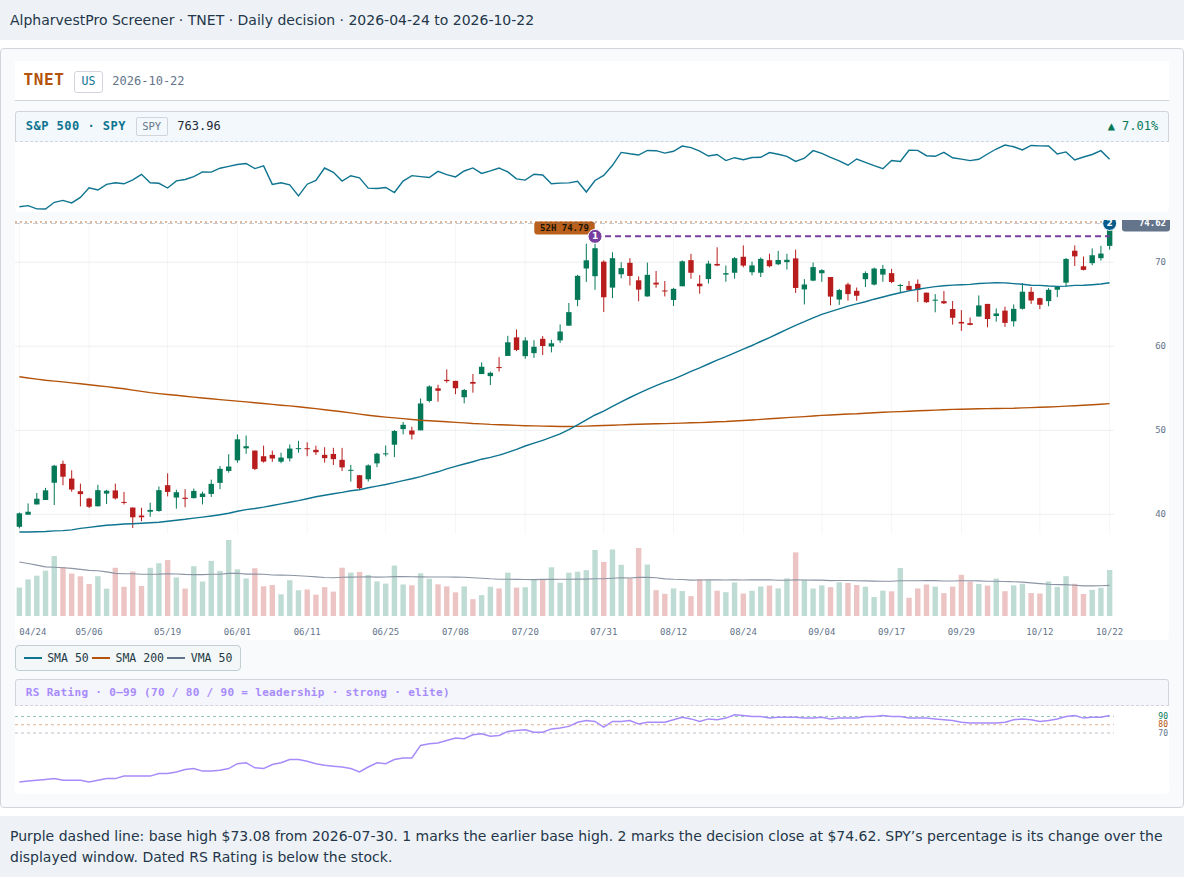
Switch to the daily chart to see the tests inside the base. The September 29 low was $61.83. Three sessions later, on October 2, the low was $62.26. By October 19, buyers stepped in at $69.03. The breakout was the close above the July 30 high of $73.08. On October 22, TriNet closed at $74.62 on 487,700 shares, about 52% above its prior 50-session average. That cleared the series’ 50% volume threshold. The PP flag answered a different question from the breakout level. It showed strong buying volume, while $73.08 marked the price buyers had struggled to get past. Its relative strength (RS) rating, which compares the stock’s price performance with other stocks, was 91, and the app’s Comml Svcs-Outsourcing group ranked 39th.
TriNet also had a business development to investigate. On October 13 it announced additions to its HR platform, including recruiting and leave-management tools. Its latest reported quarter was mixed. GAAP diluted earnings per share had risen 50% to $1.15, while revenue fell 5%. There was a date worth writing directly on the order ticket. TriNet had already scheduled its next earnings release for October 29 before the market opened. Buying on Friday meant taking that risk less than a week later. Product announcement · Second-quarter filing · Earnings schedule
What a pullback buyer saw in Union Pacific
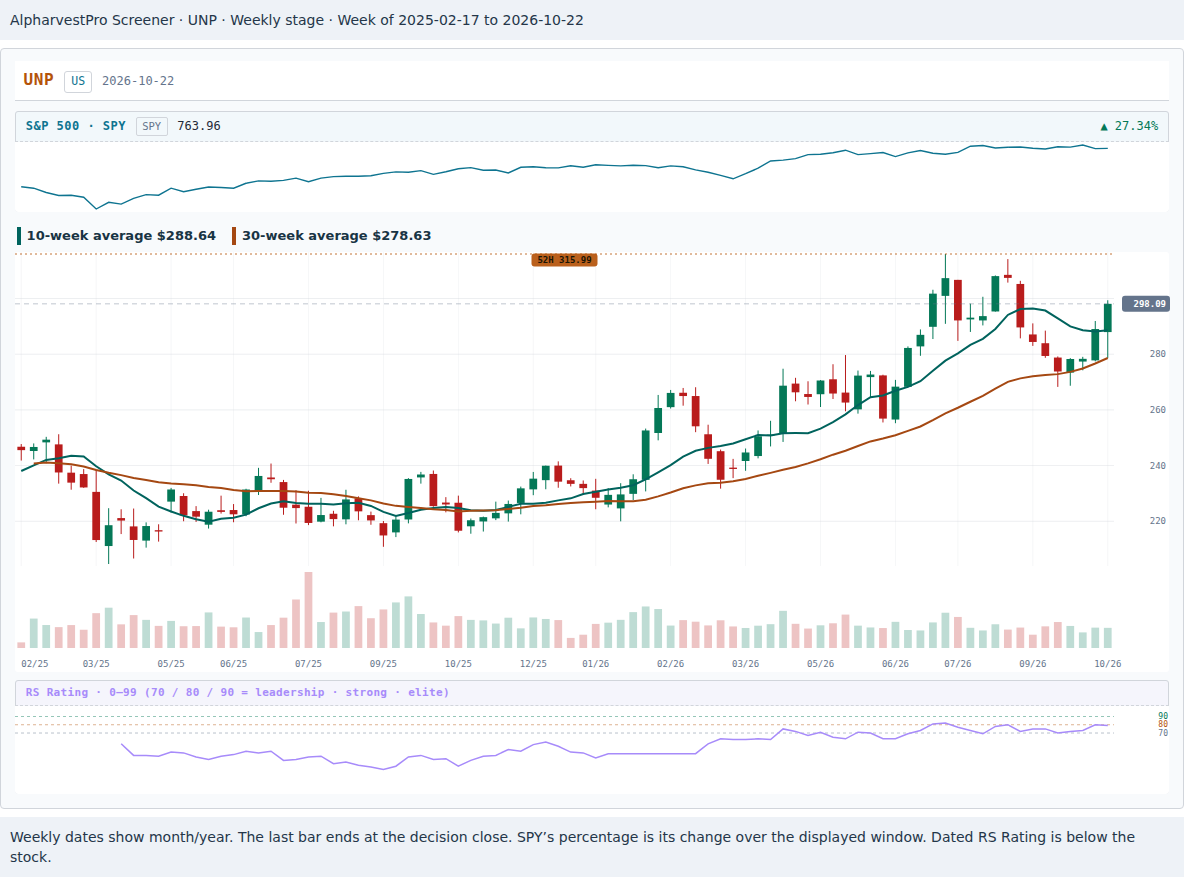
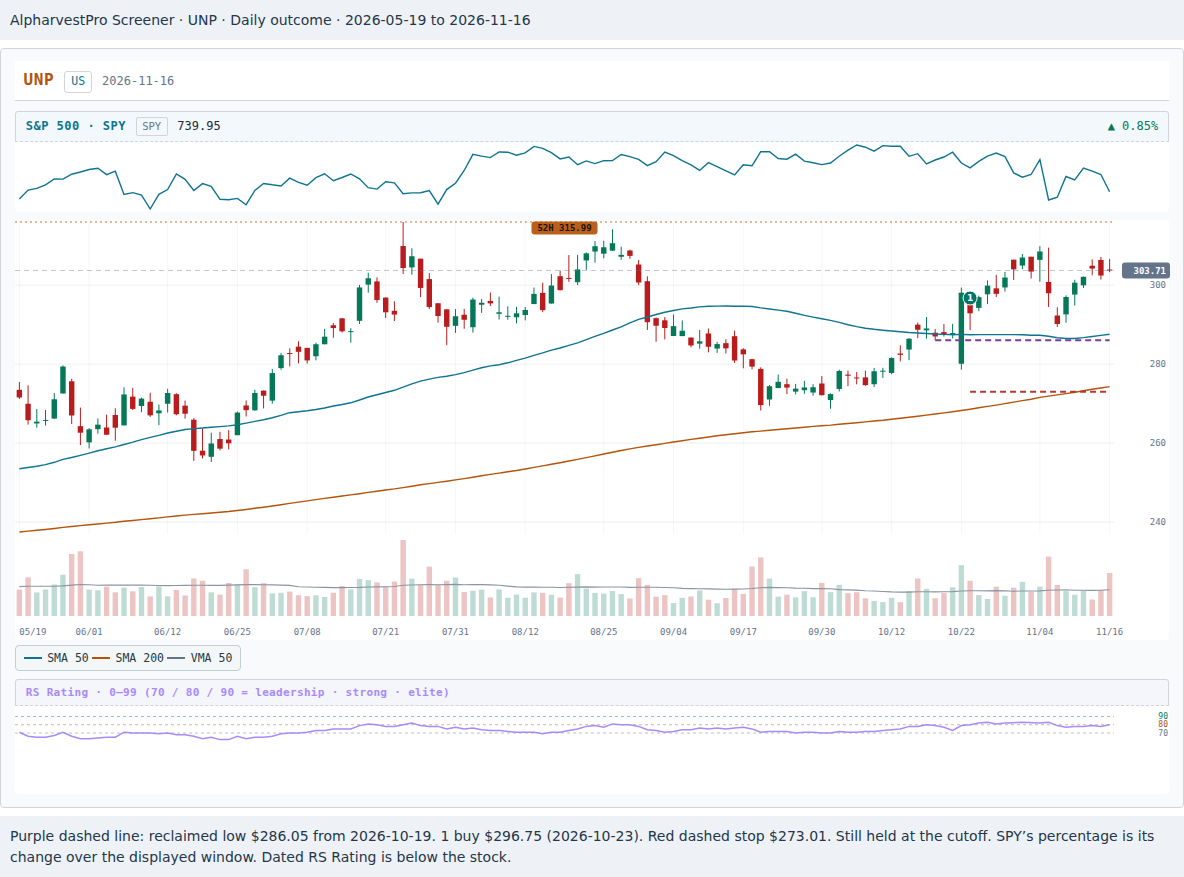
Union Pacific’s weekly chart also showed a 10-week average above a rising 30-week average. The stock was rebuilding beneath its July high of $315.99. The September 21 low was $268.26. Buyers stepped in at $274.22 on October 8 and at $286.05 on October 19. That last price gave Thursday’s move a level anyone could check.
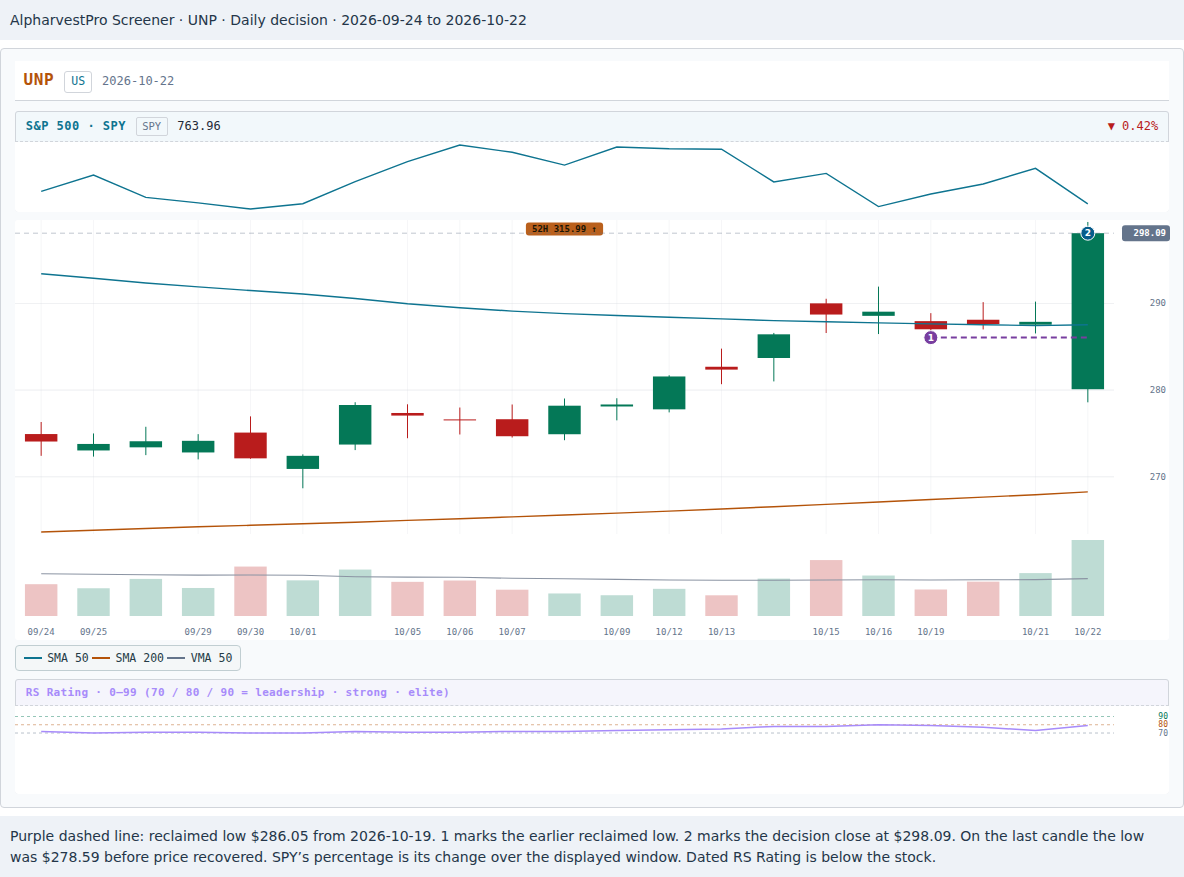
On October 22 the railroad traded down to $278.59, below $286.05, then finished at $298.09, back above it. That sequence is an Undercut & Rally (U&R). It explains why a stock still inside its base could earn a place on a pullback buyer’s list. UNP appeared on both U&R and PP that evening, on about 2.09 times its usual volume. Its RS rating was 79 and Transportation-Rail ranked 13th.
Why give that recovery any weight? The railroad had just reported quarterly operating revenue up 15% and GAAP diluted earnings of $3.49 a share, up from $3.01. Its proposed Norfolk Southern acquisition was still under regulatory review. The earnings release was scheduled for 7:45 a.m. Eastern that morning, so the evening buyer could read the numbers alongside the price action. The buyer also had to pay for the recovery. By the close, the stock was already more than $12 above the low it had reclaimed. Quarterly results · Release time
Three orders at Friday’s open
Thursday evening supplied the setups. Friday’s opening prices supplied the share counts. Each row is a separate hypothetical choice for the same $40,000 account. Plan A uses the usual $400 risk ceiling. B halves the budget on the same stock. C uses a $200 ceiling because the entry is still inside a base. Cash was also a reasonable choice, particularly for someone unwilling to hold through TriNet’s earnings.
| October 23 order | Entry | 8% stop | Risk per share | Shares | Position value | Planned loss |
|---|---|---|---|---|---|---|
| A · TriNet breakout | $74.33 | $68.38 | $5.95 | 67 | $4,980.11 | $398.65 |
| B · Same TriNet breakout, half budget | $74.33 | $68.38 | $5.95 | 33 | $2,452.89 | $196.35 |
| C · Union Pacific pullback, half budget | $296.75 | $273.01 | $23.74 | 8 | $2,374.00 | $189.92 |
For C, divide $200 by $23.74 and round down to eight whole shares. The earlier $286.05 low identified the setup. This comparison gives all three positions the same 8% protective-stop rule. A trader using the reclaimed low as the exit would need a different order ticket. The model uses the opening print for both sizing and execution. In a real order the fill can differ, and a gap through a stop can make the loss larger than planned.
Before opening the results, choose the order you could defend on Thursday’s evidence. If TriNet’s earnings date makes you uncomfortable, would cutting the share count be enough? If Union Pacific’s rebound already feels too expensive, what would you want to see before committing cash?
See the October trade results and what happened to the market’s rally attempts
What happened to the October orders?
| Plan | What happened through November 16 | Realized result | Open result |
|---|---|---|---|
| A · TriNet, 67 shares | Sold at the stop on October 29 | −$398.65 | $0.00 |
| B · TriNet, 33 shares | Sold at the same stop on October 29 | −$196.35 | $0.00 |
| C · Union Pacific, 8 shares | Still held at the November 16 close of $303.71 | $0.00 | +$55.68 |
TriNet initially closed above the purchase price. On October 27 it finished at $71.62, back below the breakout level. On earnings day it opened at $71.86 and traded down to $59.81, crossing the $68.38 stop during the session. Both plans use a $68.38 fill. The smaller position saved $202.30 on exactly the same price move. The company reported lower revenue and diluted earnings that morning, another reason to be cautious about assigning the whole loss to the market. TriNet’s October 29 results
Union Pacific’s eight shares were worth $6.96 more per share at the cutoff. The $55.68 gain was still open. The stock had triggered neither its stop nor the series’ 20% partial sale. Its merger review continued during the holding period. A railroad and an HR company can react to quite different news even when their charts share a date. Union Pacific merger docket
Why the market kept returning to correction
The October 23 correction reading came after the opening orders. By the close the Nasdaq Composite had fallen below the low where its earlier rally began. That ended the September confirmation. Twice in the weeks that followed, one of the indexes met the follow-through rule. A different price break ended each recovery.
Market Compass calls a session a follow-through day (FTD) when the S&P 500, Nasdaq Composite or NYSE Composite gains at least 1% on higher volume than the previous session, on day four or later of a rally attempt. That confirms a recovery in the rally panel. The headline also takes the condition of the three indexes into account. Market Compass methodology
The first rally lost its starting low
The October 29 report still said Market in Correction and showed a rally in progress. The report dated October 30 identified October 29 as the FTD. On day five of the rebound, the NYSE Composite had risen 1.05% on higher volume. The NYSE’s volume was up 6.6%, but on that same October 29 session the Nasdaq fell 1.38%. On October 30, when the headline improved to Uptrend Under Pressure, the S&P 500 fell 1.82% and the Nasdaq fell 2.86%. The S&P 500 slipped below its 50-day average and the Nasdaq stayed below its own. One index had met the confirmation rule while other indexes were weakening.
On November 5, the NYSE Composite fell below the low where its rebound had begun. Market Compass recorded that break as the reason the confirmation failed. The Nasdaq also closed below its 200-day average that day. The headline returned to Market in Correction.
The second rally lost the Nasdaq’s 200-day average
On November 11, day five of the next attempt, the Nasdaq Composite gained 1.60% on higher volume and regained its 200-day average. That day’s report recognized the FTD and the headline again read Uptrend Under Pressure. The S&P 500 and Nasdaq were still below their 50-day averages.
The November 16 report explains why that recovery also lost its confirmation. It dates the failure to November 13, when the Nasdaq closed below its 200-day moving average. Monday’s headline read Market in Correction. The November 13 headline is missing from the archive. Download the dated readings and reasons
What would have changed on an order ticket? A trader following the series could consider a new setup at the November 2 open using the October 30 report. At the November 6 open, the November 5 correction reading called for holding off on new purchases.
The second rally reopened that choice at the November 12 and 13 opens. For the November 16 open, the preceding session’s headline is missing, so this exercise cannot model a new purchase. The November 16 correction reading called for another wait at the November 17 open. Union Pacific, already owned in Plan C, still had its own stop. This is where Ryan’s distinction matters. A breakout needs buyers to keep paying up after the old high gives way. On a pullback, you can watch whether buyers defend a price inside the base.
How did the same breakout rule look in August?
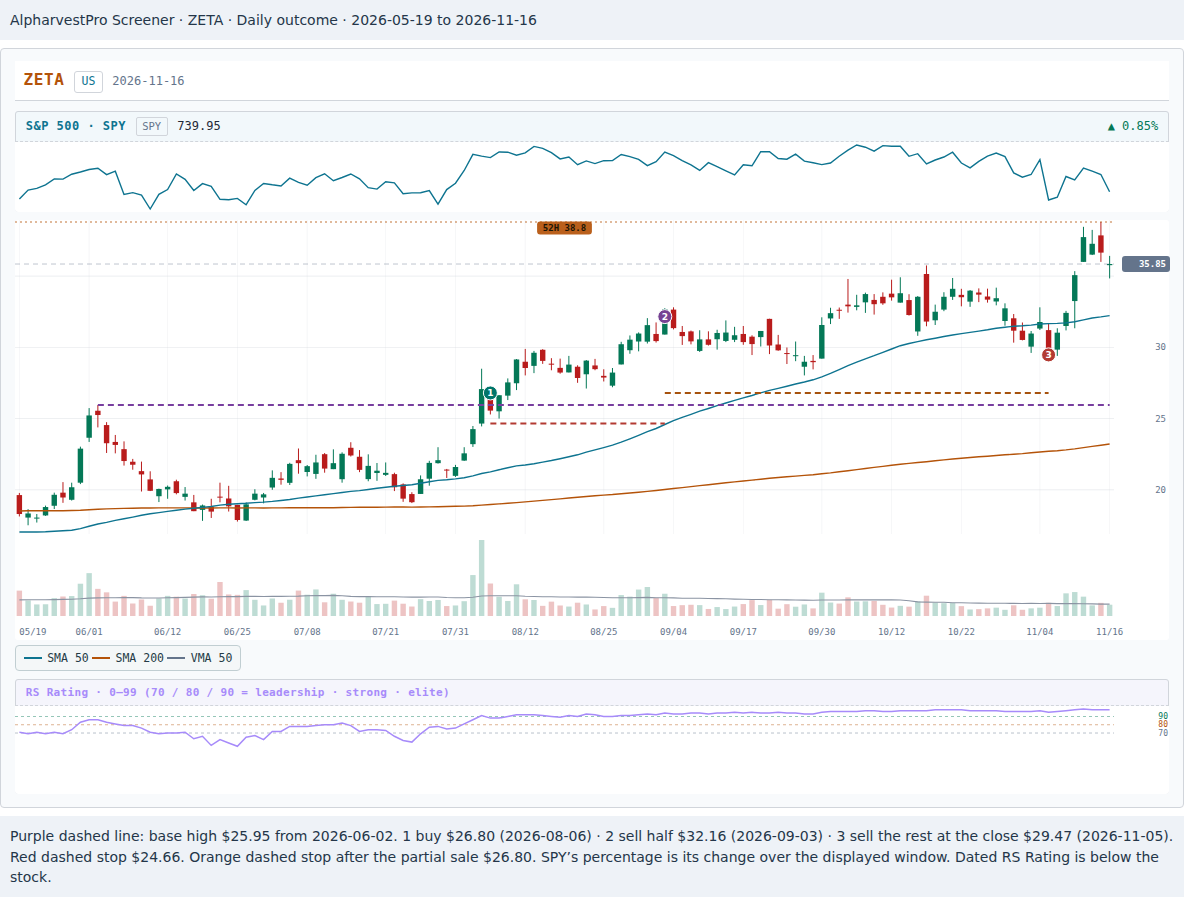
Zeta Global (ZETA) is a separate example of the breakout rule from a stronger market. On August 5, Market Compass read Confirmed Uptrend. Zeta’s weekly 10-week average was above its rising 30-week average. After falling to $17.77 in June, the stock held a higher low of $19.07 in late July. The weekly chart marks the June high of $25.95 in purple. The orange 52H tag shows the $28.50 intraday high reached on August 5.
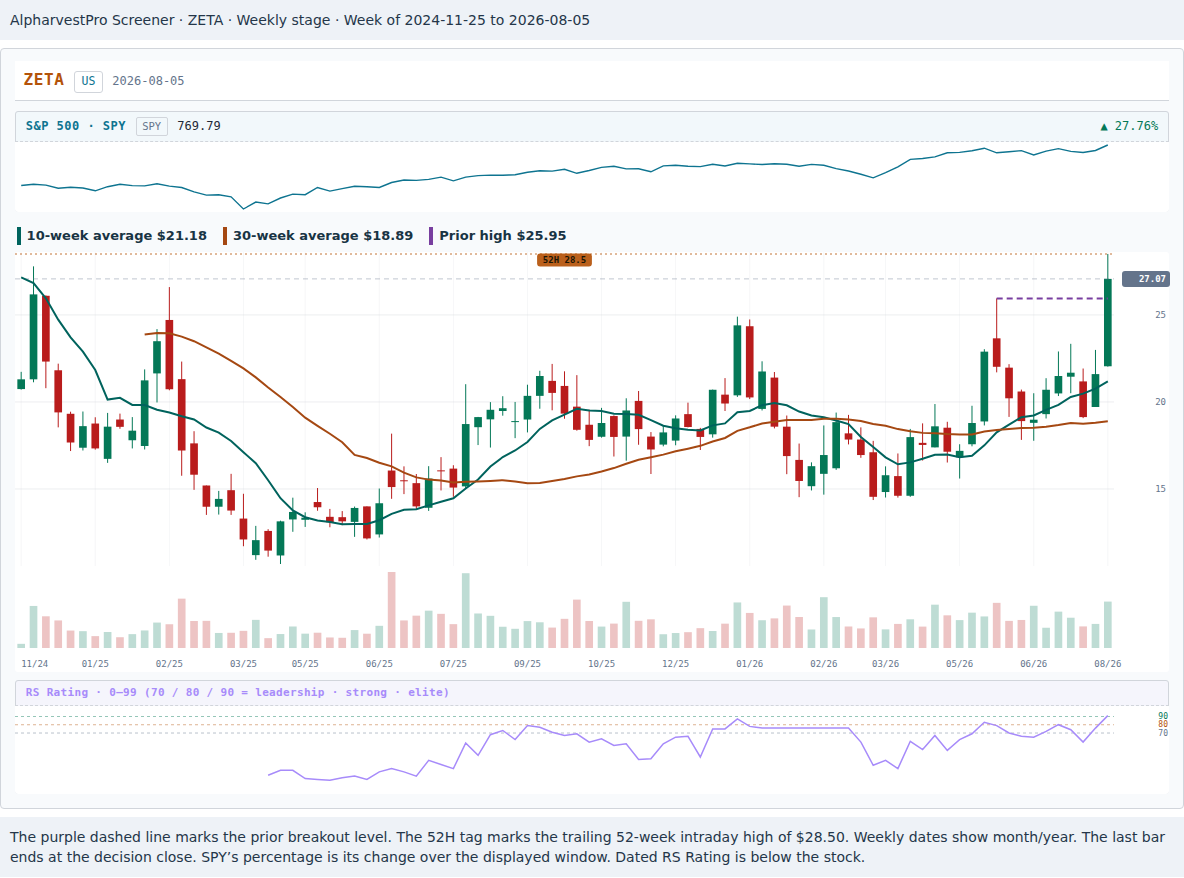
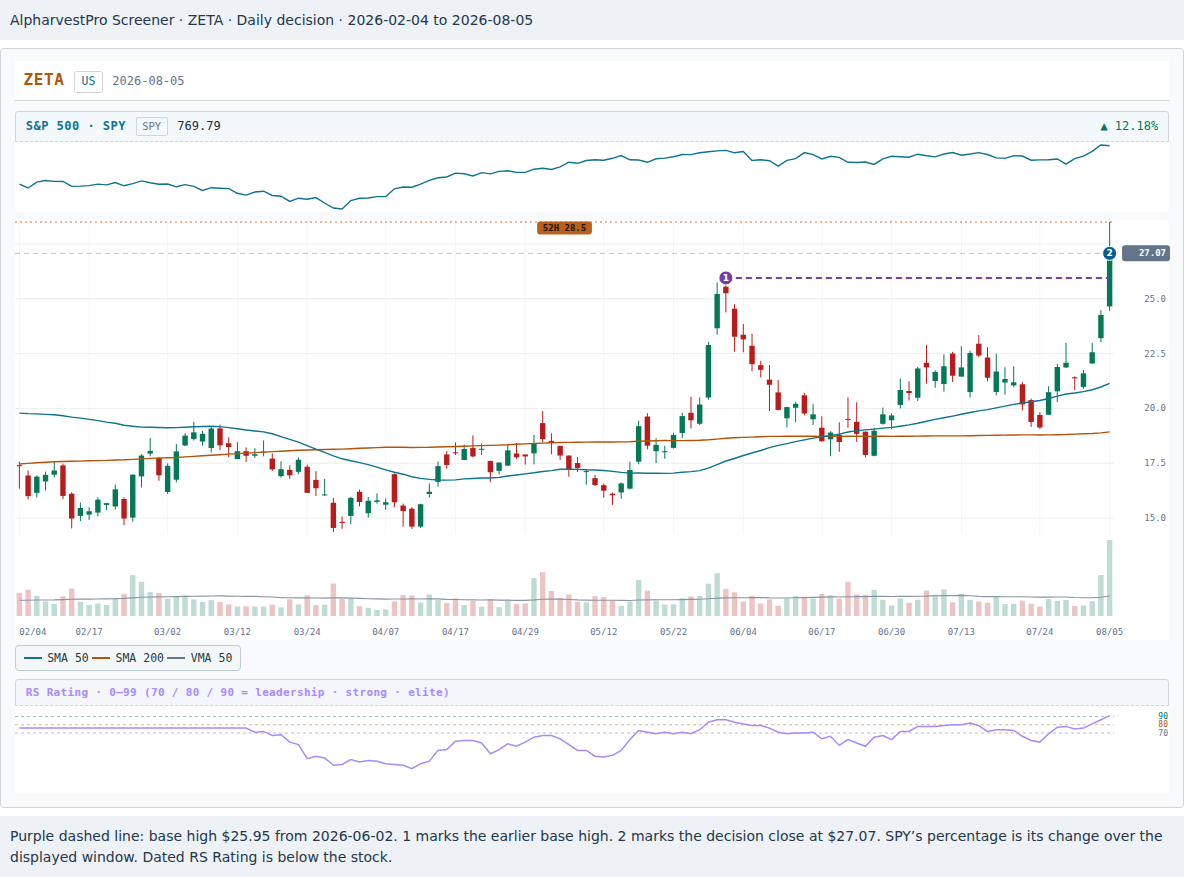
On the daily chart, Zeta closed at $27.07 above its June high of $25.95 on 4.05 times average volume. It appeared on the PP list with RS 91, and its Computer Sftwr-Database group ranked 41st. The previous day Zeta had reported 44% revenue growth and positive GAAP earnings and outlined how it would measure adoption of its AI products. August earnings release
See how the August breakout and its first pullback played out
The same full-risk breakout rule bought 186 shares at $26.80 on August 6, with a stop at $24.66 and $398.04 of planned risk. There was a pullback. That first day alone traded as low as $25.29, back below the old high. By August 28, 17 trading sessions including the entry day, Zeta closed at $30.54. That gives the August trade the same amount of time as the October comparison.
On September 3 the 20% target sold 93 shares at $32.16 and lifted the stop on the rest to the entry. The remaining 93 sold at the November 5 close of $29.47 on its biggest one-day percentage drop since the weekly uptrend began. Together the two sales realized +$746.79 before costs. We chose Zeta knowing its breakout later reached the partial-sale target. The August buyer earned that result by sitting through the first day’s retreat and holding the second half for three months. Zeta announced AthenaOS in October, while those shares were still held. October product announcement
A question for the next close
On the Screener, write down the Market Compass headline and the report date. Check the rally panel for the index that confirmed the recovery and the reason for any later failure. Use the report available before your order. Open the Weekly chart to locate the base, then the Daily chart to mark the price that buyers have to clear or recover. For a pullback, the Undercut & Rally (U&R) and OWL VDU Pullback Pocket Pivot lists offer different places to look. VDU means volume dry-up. A quiet pullback needs its own evidence of returning demand. In Union Pacific’s case the evidence was the recovery of a specific prior low.
Check the next earnings date with the company. Put the intended entry, stop and maximum dollar loss into the position-sizing calculator. Then write one sentence in your journal. “At this market reading, my entry price is [price] and my maximum planned loss is [dollars].” Leaving the order blank is a decision, too. AlpharvestPro position-sizing calculator
Reading and chart notes. Ryan’s passage is in Momentum Masters, Section Four, question 7. The two October cases share a decision evening. The August case follows the same full-risk breakout rule in a different market. All three were selected retrospectively from dated US lists. Their results cannot establish how often either entry works. The charts use the AlpharvestPro Screener renderer with historical prices as traded, SPY above price and volume, and dated RS below. Daily bars give modeled fills and cannot show the order of every intraday trade. The account figures exclude spreads, additional slippage, fees, taxes and dividends. Chart data and trading assumptions
