
On Monday night, September 14, 2026, two AlpharvestPro screens offered 255 different US stocks. VCP Setup (Minervini) listed 197. Three Weeks Tight (O’Neil) listed 60, with two names on both.
Nobody prepares 255 trades properly. A list that long hides the two decisions that matter: which stock is close enough to act on, and what it will cost if that stock fails.
Mark Minervini’s routine in Think and Trade Like a Champion starts simply: “Every night, I prepare for the next day’s trading.” He asks whether new candidates are “nearing the entry point for executing a trade.” William O’Neil, in How to Make Money in Stocks, says to “jot down the buy point at which you would consider buying each stock” and note its average daily volume. “In time, one or two of the stocks on your list will begin to approach your buy point.” When one trades there, he wants volume “at least 50% above average” and a positive general market.
Expect to be wrong, then prepare for it
Neither author promises a high hit rate. O’Neil writes that “you’ll probably be right less than half the time!” Minervini says that, over time, “you will likely be correct on only 50 percent of your purchases.” He would rather stay profitable at a 25 percent batting average than depend on a 75 percent one, because “it allows me to be wrong many times and still make money.”
That changes what a watchlist note must contain. The buy point tells you when to act. The exit and the position size decide whether being wrong is affordable, so a note without them is unfinished.
From 255 names to a short list
I applied a mechanical filter to that night’s lists, fixed before looking at what happened next. Keep stocks above $10 that traded at least $20 million a day on average. Mark a reference buy point at the highest price of the previous 15 sessions. Keep only stocks closing within 5% below it.
Sixty-two names remained. Over the next three weeks, 40 never closed above their marked level; those notes would simply have expired. Of the 22 that did, 10 did so on volume at least 50% above their 50-session average. These counts describe one night and one rule, not the performance of either author’s method or AlpharvestPro’s presets. They show the shape of the work: most notes expire, and only a few trigger the way the plan asked.
A note in five lines
- Why it’s here: the leadership evidence and the pattern.
- Buy point: the price that makes the setup actionable.
- Confirmation: the volume and market backdrop required, decided in advance.
- Failure level and size: where the idea is wrong, and the share count that keeps the loss within budget.
- Expiry: when to delete or rewrite the note — a date, a scheduled report, a close back below the buy point.
The first three lines describe the opportunity. The last two keep you in the game, and they are the ones most often left blank.
Natera: every line filled in
Natera (NASDAQ: NTRA) entered Three Weeks Tight (O’Neil) on September 14, according to AlpharvestPro’s dated screening record. This is the chart at that day’s close.
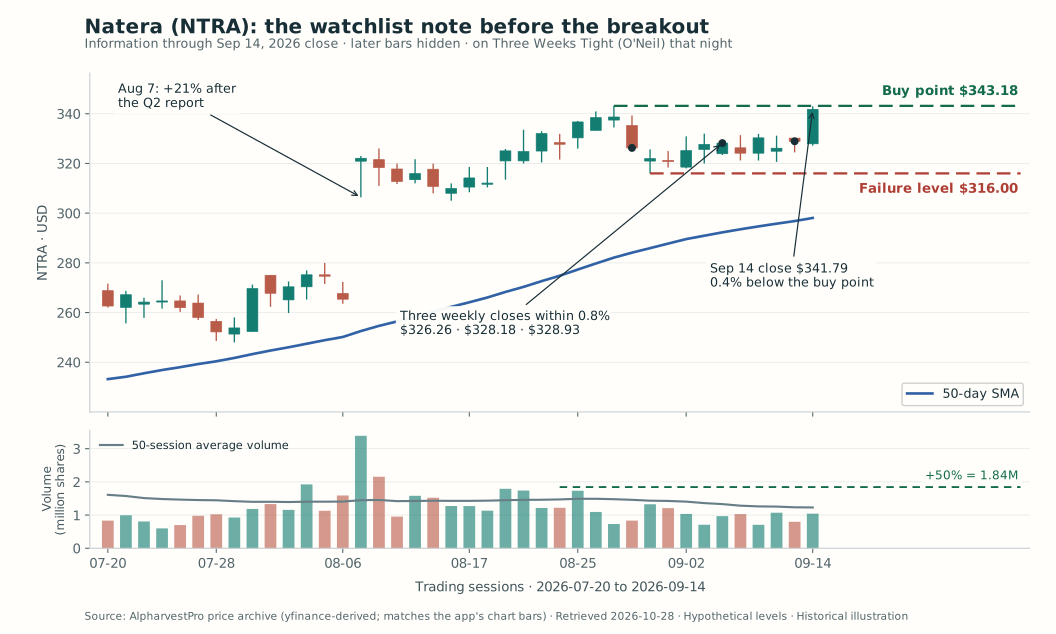
Green dashed: buy point. Red dashed: failure level. Black dots: the three weekly closes. Volume panel: the 50-session average, and a line 50% above its September 14 value. Tap or click any chart to open it at full size.
| Line | NTRA on the night of September 14 |
|---|---|
| Why it’s here | RS 95 and a Minervini trend-template Score of 10 out of 10 in AlpharvestPro. The $341.79 close was far above a rising 50-day average of $298.07. After a 21% jump on August 7, the session after its second-quarter report, NTRA printed three weekly closes within 0.8%: $326.26, $328.18 and $328.93. |
| Buy point | $343.18, the August 27 high at the top of the tight area and also the 52-week high. The close was 0.4% below it. |
| Confirmation | 50-session average volume of about 1.23 million shares, so 50% more is roughly 1.84 million. SPY closed 0.3% above a rising 50-day average. |
| Failure level and size | $316.00, the August 31 low at the bottom of the tight area, 7.9% below the buy point and inside O’Neil’s 7–8% loss limit. For a hypothetical $40,000 account risking 1% ($400): $27.18 per share, so 14 shares, about $4,805. |
| Expiry | Three weeks without a breakout. Natera had last reported on August 6; no new report date had been announced. |
Those closes match O’Neil’s picture of a constructive tight area: “several consecutive weeks’ prices closing unchanged or remarkably near the previous week’s close.”
Decide the volume rule while the chart is quiet. In the Momentum Masters roundtable, David Ryan likes breakout volume “up at least 25%,” a lower bar than O’Neil’s 50%. So, before revealing the outcome: if NTRA trades through $343.18 tomorrow on volume 44% above average, does your note say buy?
Reveal NTRA’s next six weeks
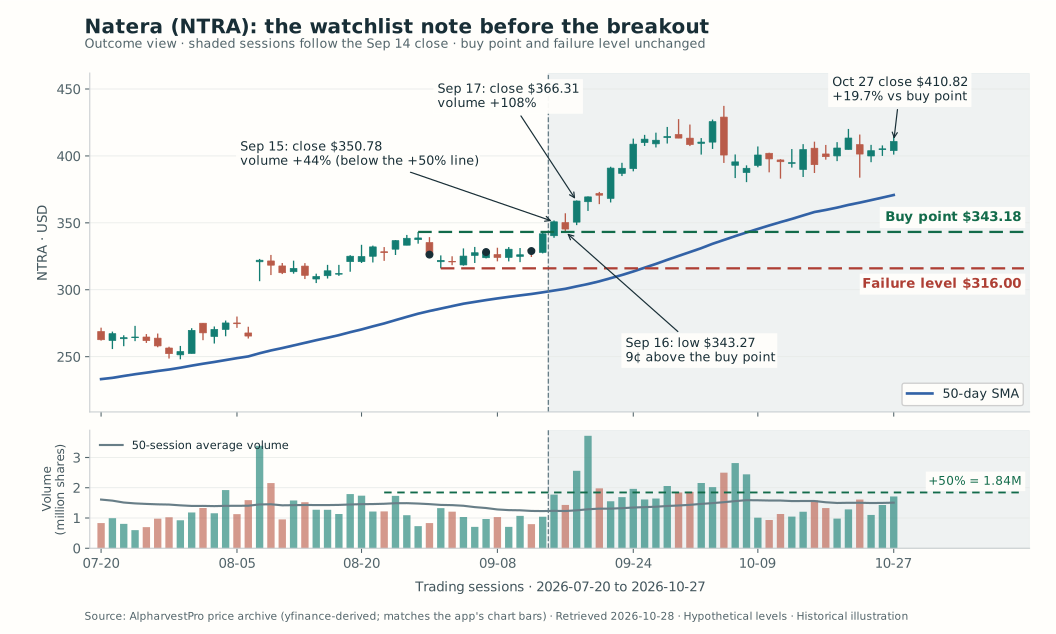
September 15: NTRA traded through the buy point and closed at $350.78, 2.2% above it, on 1.77 million shares, 44% above average. That cleared Ryan’s 25% but not O’Neil’s 50%, and SPY closed 0.2% below its 50-day line. A 50% note said “not yet.”
September 16: it dipped to $343.27, nine cents above the buy point, and closed at $345.34. Minervini notes that a stock will “pull back to or slightly below the initial breakout level” 40 to 50 percent of the time, and that this is normal “as long as the stock recovers fairly quickly.” He calls it the difference between a tennis ball and an egg.
September 17: 2.56 million shares, 108% above average, and a close of $366.31, 6.7% above the buy point.
NTRA did not close below the buy point again through October 27, when it finished at $410.82, 19.7% above it. The failure level was never tested. The note still had a cost to reveal:
| Hypothetical entry | Price | Failure level | Risk per share | Shares within $400 | Position value |
|---|---|---|---|---|---|
| At the buy point (traded September 15) | $343.18 | $316.00 | $27.18 | 14 | $4,804.52 |
| After the +108% volume day (September 17 close) | $366.31 | $316.00 | $50.31 | 7 | $2,564.17 |
Waiting for confirmation halved the position under the same budget. Keeping a similar size at $366.31 would have meant moving the exit up to about O’Neil’s 8% limit from that price, $337.01, which allows 13 shares. That level sits below the buy point, inside the zone where Minervini says normal pullbacks often reach. There is no free choice, only one made before the excitement.
CHEF: the same pattern, without the volume
The Chefs’ Warehouse (NASDAQ: CHEF) sat on the same Three Weeks Tight list from September 28 to October 2. On paper it looked similar: RS 94, a Score of 10 out of 10, and weekly closes of $110.45, $110.85 and $110.27, within 0.5%. Its buy point was $115.15, the September 8 high, with the $117.65 52-week high from September 1 just overhead. Average volume was about 684,000 shares, so the note’s volume line sat near 1.03 million.
On October 2, CHEF closed at $116.42, 1.1% above the buy point, on 632,400 shares: 8% below average.
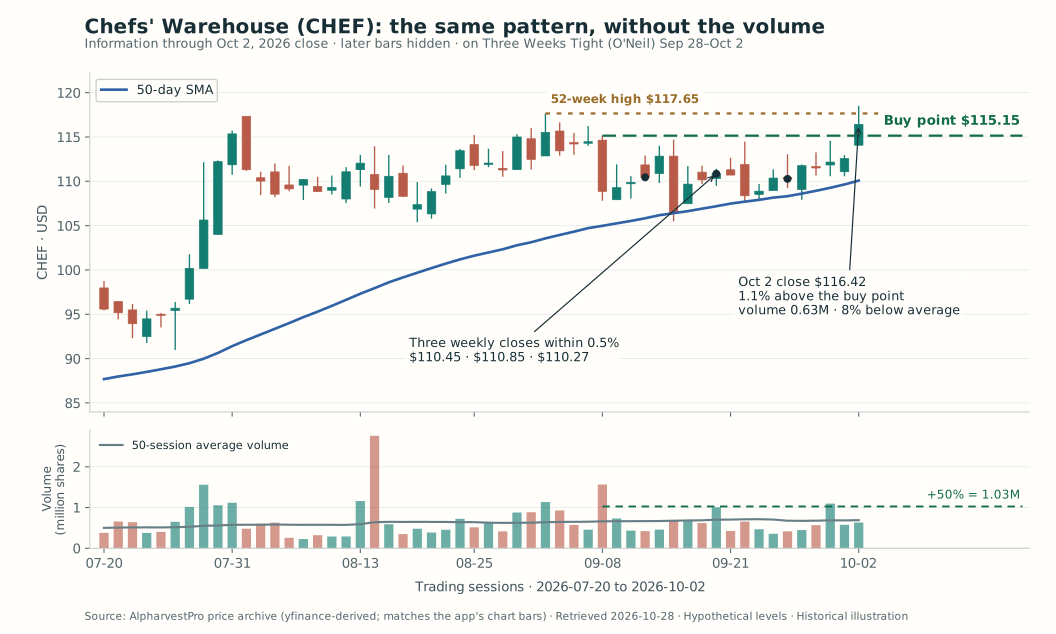
Same conventions. The gold dotted line marks the September 1 high; October 2 traded above it intraday but closed below it.
The price line is satisfied; the volume line is not even close. SPY closed 0.8% above a rising 50-day average, so the market was not the obstacle. What does your note say?
Reveal CHEF through October 27
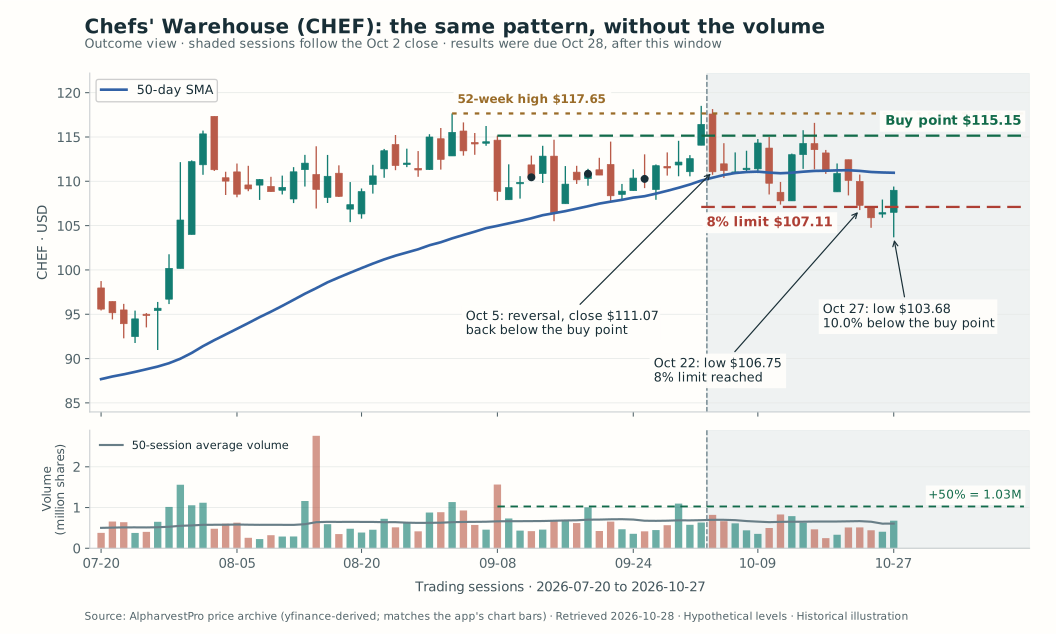
On October 5, CHEF reversed and closed at $111.07, back below the buy point, on volume 20% above average: the egg, not the tennis ball. It traded down to $106.75 on October 22 and $103.68 on October 27, 10.0% below the buy point.
Suppose someone bought anyway at the $116.42 close. O’Neil’s 8% limit from that price was $107.11: $9.31 of risk per share, so 42 shares within the same $400 budget. The limit was first reached on October 22, for a planned loss of $391.02 before costs and slippage, roughly 1% of the account. A note that also said “exit on a close back below the buy point” would have acted on October 5, about 4.6% below that purchase.
Either way, the failed breakout cost a planned 1% or less of the account. That is what building failure into the system looks like. CHEF had announced on October 14 that it would report before the open on October 28, so this decline preceded the report; in a live note, that date belonged in the expiry line.
Volume did not sort the winners alone
ZD sat on the same September 14 list as NTRA. On September 15, as NTRA cleared its buy point on 44% more volume than usual, ZD closed above its own reference high of $57.68 on volume 71% above average. It closed back below that level three sessions later.
NTRA is the clean case here, not the typical one. In those weeks, many names from the same lists slipped back below their buy points, just as both books’ batting-average warnings would suggest. The volume line is a condition for acting, not a prediction. The failure level and the share count are what keep a string of reasonable, failed attempts from becoming a large drawdown.
Running the routine in AlpharvestPro
The screener’s Daily EOD routine follows the same order: Market regime → Leading groups → Candidate screen → Chart review → Watchlist and risk.
- Backdrop: confirm the data date, and check breadth in Market Compass.
- Screen: run VCP Setup (Minervini) or Three Weeks Tight (O’Neil). Three Weeks Tight also shows each stock’s Close Spread and distance from its 52-week high.
- Chart: mark the buy point and failure level with the drawing tools; the volume panel already shows a 50-period average.
- Watchlist: star a stock only when all five lines are written. On Pro and Ultra plans, Watchlist Alerts flag a starred stock entering another preset. AlpharvestPro’s record shows NTRA entering Pocket Pivot (Morales & Kacher) on September 17 and RVOL Leaders on September 18. An alert is a reason to reread the note.
- Size: enter the buy point, failure level and risk budget in the position-size calculator; our CPAY example shows the arithmetic.
Tonight, cap your list at five names and write all five lines for each. If the failure level and share count are blank, the stock is not ready for tomorrow, however good the chart looks. A long list feels like opportunity; a short list with the exits already written lets you keep taking the next good setup after the last one fails.
Reading and chart notes
Mark Minervini, Think and Trade Like a Champion, Sections 1, 2, 3 and 5, on pullbacks after a breakout, risk-first trading, batting average and evening preparation; David Ryan in Momentum Masters, Section 4, on breakout volume. William J. O’Neil, How to Make Money in Stocks, Chapters 2, 10 and 17, on tight price areas, the 7–8% loss limit and listing buy points. The five-line note, the triage filter and the modern examples are this article’s own applications.
NASDAQ: NTRA, CHEF and ZD; SPY for the market check. Daily prices come from the archive behind AlpharvestPro’s charts, retrieved October 28, 2026; list appearances come from the dated screening record. NTRA’s first chart ends at the September 14 close and CHEF’s at the October 2 close; both outcome charts end October 27. Buy points, failure levels, entries and position sizes are hypothetical and exclude costs, slippage and gaps. The cases were chosen after the outcomes were known and do not measure how often any method works.

