
There is a particularly frustrating way to lose money: get the company right, get the direction mostly right, and still struggle with the trade.
The stock appears on a leadership list. Its chart slopes upward. Every pullback seems to attract buyers. You finally buy, and a perfectly ordinary retreat suddenly feels like an emergency.
What interests me in Mark Minervini’s writing is how much work remains after a stock qualifies for attention. In Section 6 of Think and Trade Like a Champion, the trend template narrows the field. The particular setup and purchase still require judgment. William O’Neil makes a related distinction between leadership and a properly formed entry in Chapters 2 and 7 of How to Make Money in Stocks.
I read those passages as a warning against treating a good screening result as a completed trade plan. The list has helped us find something worth studying. We still have to decide what we are willing to pay for the uncertainty.
Put NVIDIA’s chart on pause
Here is NVIDIA through November 7, 2024. Its closing price that day was $148.88. The preceding advance is visible; the following sessions are hidden.
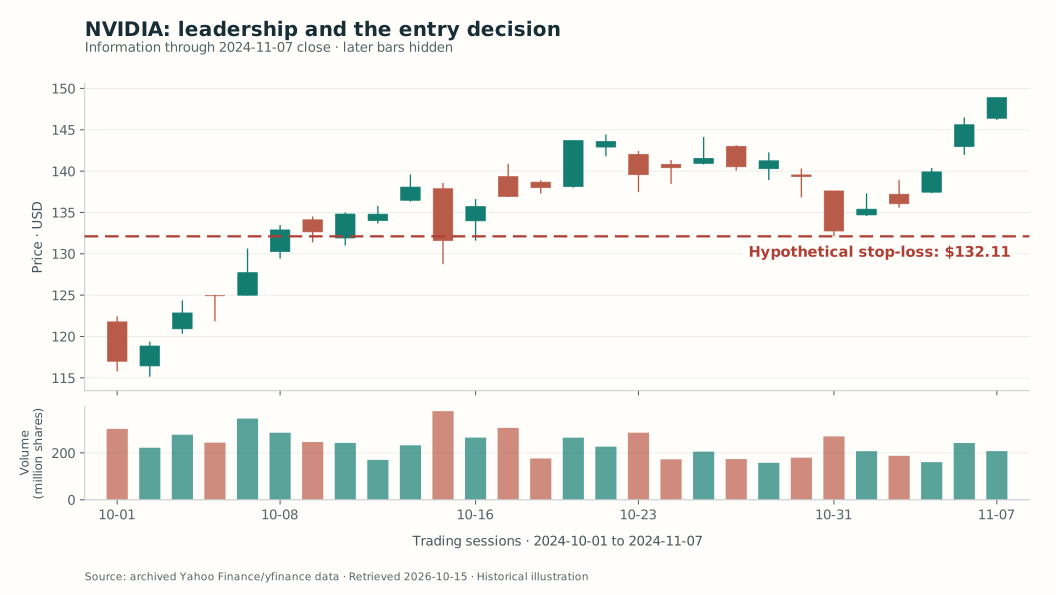
The red dashed line marks the hypothetical stop-loss at $132.11 used in the comparison below.
Before revealing the outcome, ask: where would you exit if the trade failed, and how far below your purchase price would that be?
Stay with NVIDIA’s chart. For this exercise, suppose a trader plans to exit at $132.11, the October 31 low. That is a hypothetical exit chosen for this comparison. Now compare two possible entries using the closing prices already visible on the chart:
| Hypothetical entry date | NVIDIA closing price used as the entry | Distance to the same $132.11 exit |
|---|---|---|
| November 5 | $139.91 | $7.80 per share |
| November 7 | $148.88 | $16.77 per share |
Buying at the higher price leaves more than twice as much downside to the same exit. With the same number of shares, the planned dollar loss would also more than double. NVIDIA could still look strong, but paying more has made the trade harder to manage.
Reveal the later NVIDIA chart
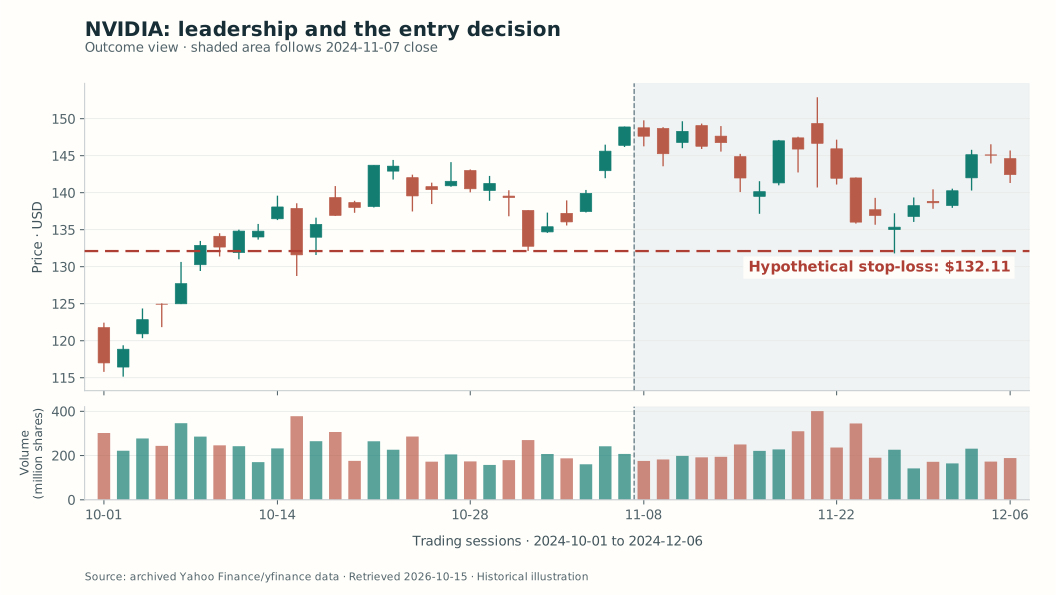
By November 15, NVIDIA closed at $141.98, about 4.6% below the November 7 close. It then closed at $147.01 on November 19. A retreat followed by a recovery can produce very different experiences for traders with different entries and exit plans.
These observations do not identify an ideal purchase or establish that November 7 was a valid setup. They show why a strong-looking chart leaves an important question unanswered: can this particular entry tolerate the stock’s movement?
The uncomfortable permission to pass
Minervini writes, “Have a process, any process, but have a process.” In context, he is explaining the value of a defined process that can be evaluated and improved. That line makes me think about the small moment between finding a candidate and deciding to own it.
Passing can feel intellectually inconsistent. You just argued that the stock was strong; now you are declining to buy it. Yet a research opinion and a position are different commitments. A position adds an entry price, a size, an exit problem, and a claim on your attention.
In AlpharvestPro, I would use public research views such as RS Leaders or the Minervini Trend Template to begin that investigation. Their appearance in this discussion does not establish that NVIDIA passed a historical scan on the dates shown. The chart must still support a decision you can explain without pointing to the name of the preset.
For the next candidate you study, try writing a two-sentence note. First, explain why the stock deserves attention. Then explain why the current price offers an acceptable trade—or why you are waiting. If the second sentence merely repeats the first, there is more work to do.
I find that distinction freeing. You can respect a powerful stock without making every strong session your entry.
Reading and chart notes
Mark Minervini, Think and Trade Like a Champion, Section 1, “Have a Process,” and Section 6, the trend-template discussion. William J. O’Neil, How to Make Money in Stocks, Chapters 2 and 7, the pivot-point and leadership discussions. The interpretation and arithmetic exercise above are original applications, not a combined rule set endorsed by the authors.
NVIDIA (NASDAQ: NVDA), USD; historical daily OHLCV, October 1–December 6, 2024. Decision cutoff: November 7 close. The entry prices and exit form a hypothetical comparison, not reported trades or a recommended stop; actual execution can differ. Prices come from the existing Yahoo Finance/yfinance-derived archive, retrieved October 15, 2026. Chart methodology and limitations.
Chart methodology and limitations
Charts were drawn by AlpharvestPro from the existing Yahoo Finance/yfinance-derived daily price archive. Candles use the stored open, high, low and close fields, not the separate adjusted-close field. Volume is in millions of shares. Non-trading days are compressed. This is a later-retrieved archive; historical adjustments can differ from prices originally quoted. A selected chart is an illustration, not a backtest.
For NVIDIA, the observation chart ends at the November 7, 2024 close; the separate outcome panel ends December 6. The archive was retrieved October 15, 2026.
Educational commentary; not personalized investment advice or a buy/sell recommendation.