
The market is finally recovering. SPY is climbing, the watchlist is turning green, and the stock you have been patiently defending still needs another good day just to get back to where it was.
That is an uncomfortable place to be. It becomes easier to understand when you rewind the chart to the correction. Was your stock holding up while the market struggled, or was it already falling further behind?
Larry Williams gives that comparison a central role in Chapter 2 of his 1972 book, The Secret of Selecting Stocks for Immediate and Substantial Gains. One phrase captures the idea: a stock “holds up better than the averages” during market weakness. He compares individual stocks with the broad market to look for differences in their behavior.
What I take from that reading is a reason to pay attention before the recovery feels reassuring. A falling market can make every chart look unpleasant. It can also reveal which stocks are resisting the pressure and which need the market to rescue them.
Here is a modern example using Celsius (CELH), lululemon (LULU), and SPY, the ETF tracking the S&P 500. These are our historical examples, not stocks Williams discusses in the book.
First, stop at the market’s trough
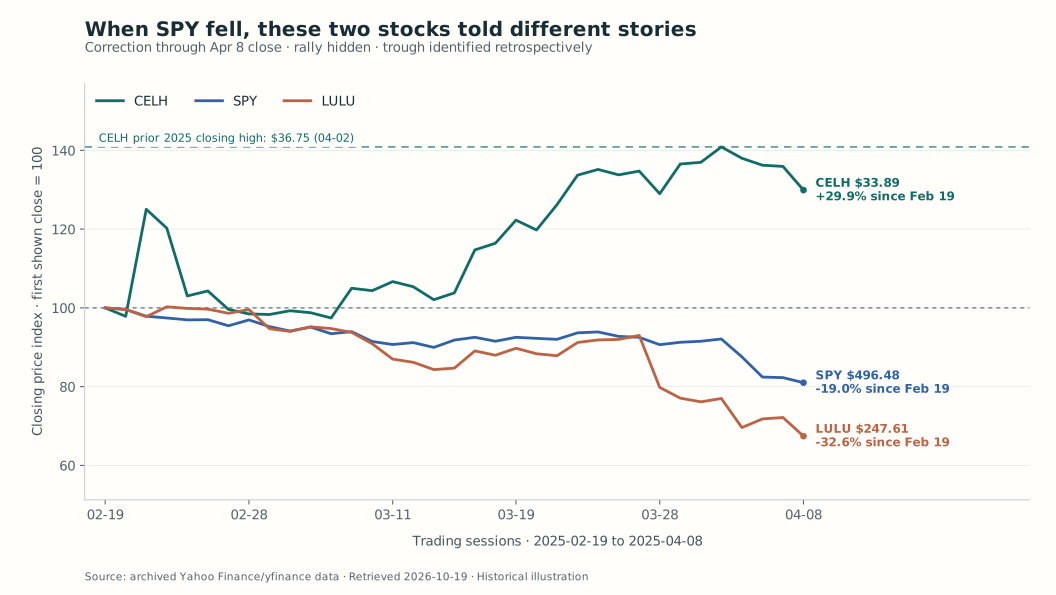
Use one common window: February 19 to April 8, 2025. SPY fell from its February 19 closing peak of $612.93 to $496.48, a decline of 19.0%.
April 8 was the closing-price trough of this correction; the lowest intraday price occurred on April 7. We can identify the trough looking back. A trader standing at the April 8 close could not know that lower closes were finished.
The first chart ends there. Every line starts at 100 on February 19, making different-priced shares comparable. The numbers at the right give each ticker’s actual closing price and its change over the same period.
| Ticker | February 19 close | April 8 close | Change during SPY’s correction |
|---|---|---|---|
| CELH — stronger | $26.09 | $33.89 | +29.9% |
| SPY — benchmark | $612.93 | $496.48 | −19.0% |
| LULU — weaker | $367.22 | $247.61 | −32.6% |
CELH had gained ground while the benchmark lost nearly a fifth of its value. It still had uncomfortable sessions: the April 8 close was below its April 2 closing high of $36.75, marked by the green horizontal line. Relative strength does not mean a stock rises every day.
LULU had fallen more than SPY. Calling that decline “the market being weak” would miss something useful: the market was weak for CELH too, but the two stocks were responding very differently.
There was company-specific news in this period. Celsius announced its Alani Nu acquisition on February 20. This is a comparison of observed price behavior, not an experiment isolating the effect of relative strength from earnings, acquisitions or other business developments.
At the cutoff, I would have a clearer reason to keep investigating CELH. LULU being further below its old price would not, by itself, make it the more attractive momentum candidate. Neither observation supplies an entry, a stop or a position size.
Now let the market recover
Before opening the next chart, consider the question: if the broad market improves, which stock has already shown it can make progress under difficult conditions?
The outcome window ends on June 27, 2025, the first subsequent session when SPY closed above its February 19 peak. That gives the comparison a benchmark-based endpoint, rather than stopping on whichever day makes one stock look best.
Reveal the rally: April 8 to June 27, 2025
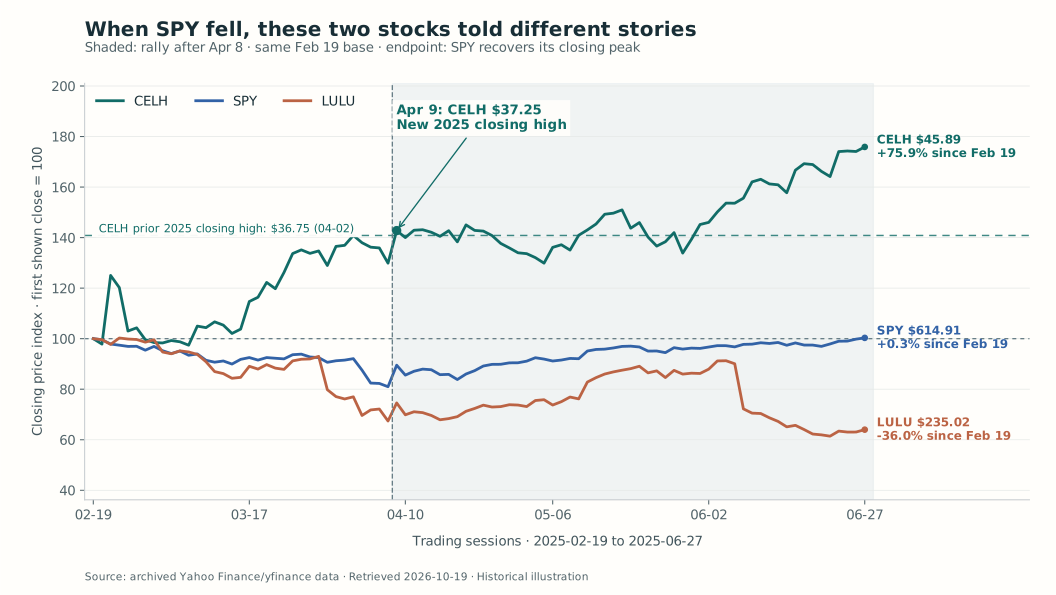
Both charts retain February 19 = 100. Their endpoint percentages therefore describe the entire correction-and-recovery window. The next table separately measures the rally from the April 8 close.
| Ticker | April 8 close | June 27 close | Change after the market’s closing trough |
|---|---|---|---|
| CELH | $33.89 | $45.89 | +35.4% |
| SPY | $496.48 | $614.91 | +23.9% |
| LULU | $247.61 | $235.02 | −5.1% |
On April 9, SPY rebounded to $548.62, up 10.5% in one session. CELH closed at $37.25, above the $36.75 high it had established before the trough. That was a new 2025 closing high to that date, not an all-time high. The arrow and horizontal line mark the comparison directly on the chart.
By June 27, CELH had reached another 2025 closing high at $45.89. SPY finally closed above its February peak at $614.91. LULU finished at $235.02, lower even than its April 8 close and 36.0% below its February 19 close.
LULU did have a substantial bounce. It reached $335.19 on June 4 before giving that progress back. Its June 5 results announcement included a lower full-year earnings outlook, and the next session closed sharply lower. Calling the whole period “no rally” would be wrong. The useful distinction is that its recovery did not last through SPY’s return to its old high.
The stronger stock built on its earlier strength. The weaker one offered a rebound, then left a holder waiting again. That is the contrast this particular example illustrates; it is not a rule that every strong stock wins or every laggard stays weak.
The habit I would take from Williams
During a correction, I want a watchlist that records what the stocks are doing, not just how much cheaper they look.
That means comparing them over the same market decline. A stock holding its ground while SPY falls deserves a different note from one falling faster than SPY. Then I want to see whether that strength persists as the market stabilizes: does the stock reclaim a meaningful prior high, or does it struggle even with the market helping?
That is where the AlpharvestPro screener can make Williams’s idea part of a daily routine. In Advanced filters, use Stronger Than Index in Last or Weaker Than Index in Last, selecting a recent trading window and reviewing each list separately. After the market data updates, check the data date, open the candidates’ charts, and update your watchlist. The stronger list helps focus your search for resilience; the weaker list gives you names to examine more critically, including holdings you may be making excuses for. Repeat that review as the market recovers, and a useful passage from a book becomes a practical research habit.
For a stock I already own, this also creates an uncomfortable but useful review question. Am I seeing renewed demand, or am I treating a broad-market rebound as a promise that my particular holding will recover? The entry and exit rules still belong to the trade plan. A comparison chart helps me examine the assumption behind that plan.
This case was selected after its outcome was known. It demonstrates the idea clearly, but it cannot tell us how often it works across a full watchlist. The price paths alone also cannot identify who was buying or prove professional accumulation.
What stays with me is the value of doing the comparison while the market is still difficult. By the time the index has recovered, a laggard’s old price can feel like a destination it is owed. The chart has never made that promise.
Reading and chart notes
Larry Williams (1972), Chapter 2, particularly the comparative-strength discussion and the accumulation/distribution chart patterns. The modern tickers, dates, calculations and commentary are this article’s applications; the book did not select this 2025 period.
NASDAQ: CELH and LULU; NYSE Arca: SPY. Daily closing-price comparisons, February 19–June 27, 2025; first-view cutoff April 8. Prior 2025 closing highs were checked from the January 2 session onward. The series use the archive’s close field, exclude dividends and trading costs, and are not total returns or executed-trade results. The historical case and its trough were selected retrospectively.

