
Mark Minervini 2021: A Research Journal
Read the journey
August 9, 2021 · Record steel earnings supported the candidate. A local entry inside the structure offered a different risk equation from chasing the full breakout.
An early entry is attractive when it puts a clear failure point nearby. It becomes a different proposition when “early” means buying before the stock has shown that the decline is over. NUE lets us distinguish those situations.
Our cutoff is August 6, and we open AlpharvestPro’s replay of that close. Prices are the archive’s revised adjusted units.
What AlpharvestPro’s replay shows at the Aug. 6 close
AlpharvestPro’s history archive replays today’s presets, relative strength and Market Compass over 2020–2021 prices. It uses the current stock roster, so it carries survivorship bias. NUE is here because it is one of Minervini’s 2021 setups, not because the app selected it. The replay shows how AlpharvestPro’s tools read the chart at the cutoff, not what any screen displayed in 2021 or what Minervini used.
| At the Aug. 6 close | AlpharvestPro replay |
|---|---|
| AlpharvestPro Market Compass (provisional) | Confirmed Uptrend since the S&P 500’s July 23 follow-through day. The tracked indexes were mixed that day, and the Russell closed below its 50-day average; the S&P 500, Dow and NYSE Composite closed at new highs. |
| AlpharvestPro RS (reconstructed, current roster) | 93. Earlier readings: 90 on July 9 (20 sessions before), 92 on May 7 (63 sessions) and 33 on Feb. 5 (126 sessions); its range over the last 63 sessions was 88–95. |
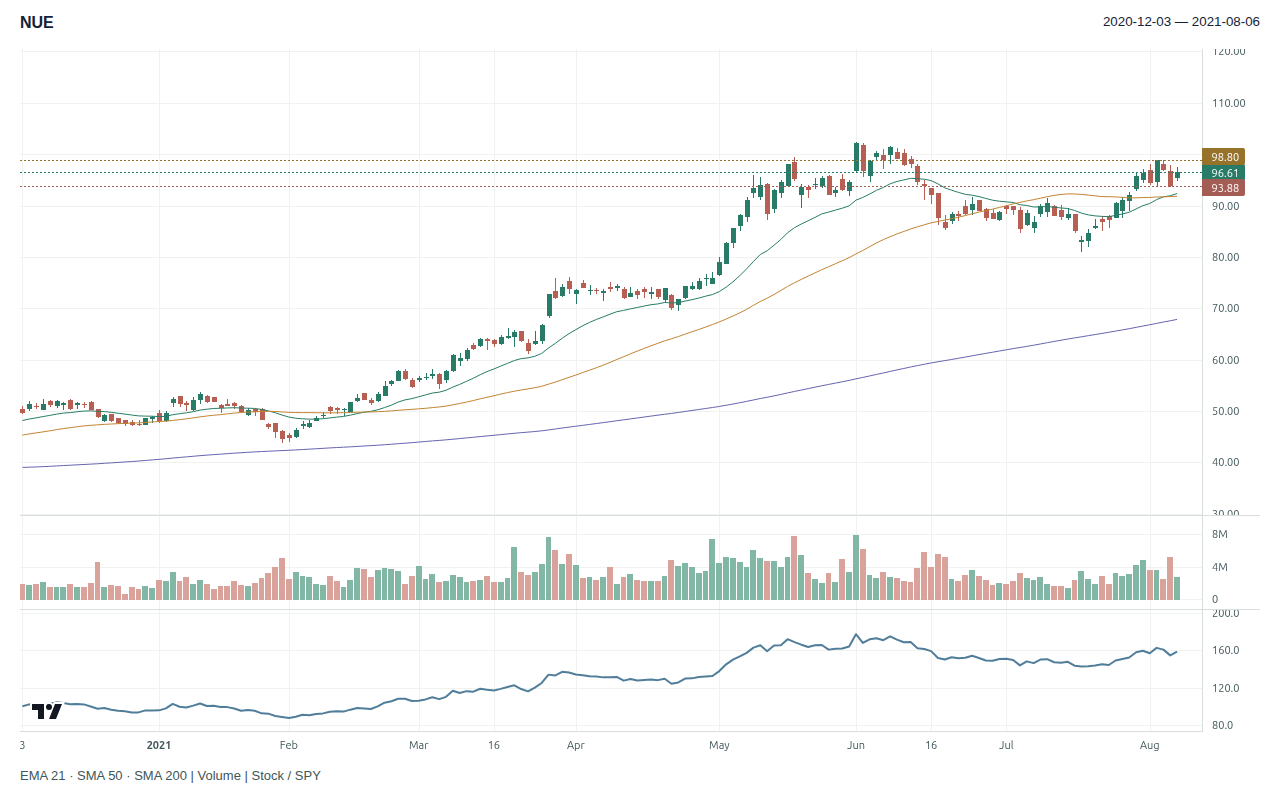
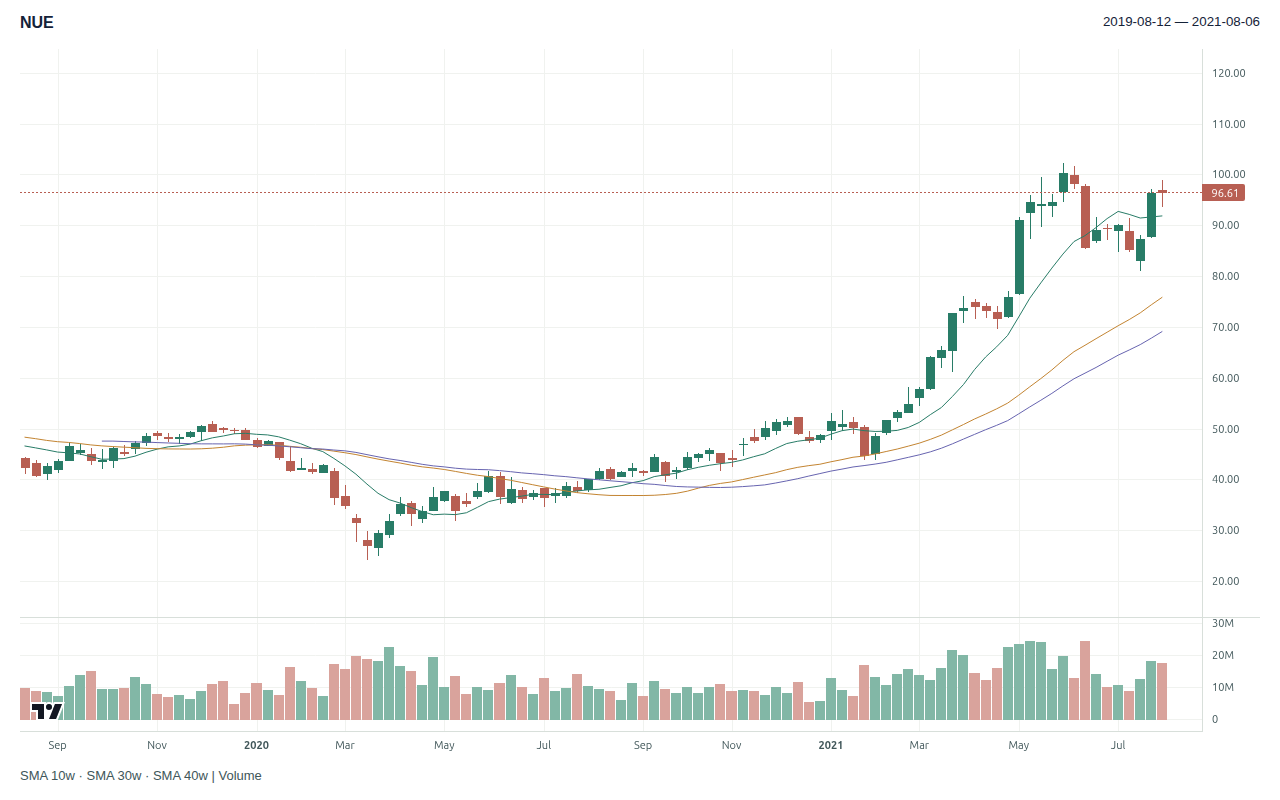
| Price and averages | $96.61, above the 50-day average of $91.82 and above the 200-day average of $67.85. It closed 5.6% below its 52-week high of $102.34 on June 1. |
| AlpharvestPro presets in the week before Aug. 9 | Five sessions, Aug. 2 to Aug. 6: AlpharvestPro Near 52-Week High, every session; AlpharvestPro RS Leaders, every session; AlpharvestPro Trend Template, every session; AlpharvestPro QAB, on Aug. 2, Aug. 3 and Aug. 6; AlpharvestPro VVT, on Aug. 2, Aug. 3 and Aug. 4. These replays agree closely with the live app, except QAB and VVT, which agree moderately. Also shown, but not relied on because its replay agrees poorly with the live app: AlpharvestPro NR7 Squeeze, on Aug. 4. |
| AlpharvestPro presets the stock was on | AlpharvestPro RS Leaders, every session since March 24; AlpharvestPro Trend Template, every session since Nov. 5, 2020; AlpharvestPro QAB, every session since Aug. 6; AlpharvestPro Near 52-Week High, every session since July 29. The RS Leaders, Trend Template and Near 52-Week High replays agree closely with the live app. The QAB replay agrees moderately. |
| AlpharvestPro early-Stage-2 check | Not passed, on two conditions: its 150-day average had been rising for longer than an early-stage advance and the stock had already advanced far above its base low. |
| Industry peers | Steel: the two largest companies by today’s market value that traded then; the choice uses today’s knowledge, the readings do not. Arcelor Mittal NY Registry Shares NEW (MT): RS 94; on AlpharvestPro RS Leaders, Trend Template, Near 52-Week High and COOL Leaders; 2.7% below its 52-week high, above its 50-day average; up 5% over three months. Steel Dynamics, Inc. (STLD): RS 89; on AlpharvestPro RS Leaders, Trend Template, Near 52-Week High and AVWAP Pullback Watch; 5.6% below its 52-week high, above its 50-day average; little changed over three months. NUE’s RS of 93 was between them. |
Nucor’s rank had transformed in six months, from 33 to the 90s, and the stock had been an AlpharvestPro RS Leader since March. AlpharvestPro QAB, AlpharvestPro’s quiet-accumulation breakout preset, listed it on August 2 and 3 and again on the cutoff day, and AlpharvestPro VVT on August 2, 3 and 4; both replays agree moderately with the live app. The chart shows an undercut: from the June 1 high, NUE fell about 21% to $81.23 on July 19, below its July 16 low of $84.87, then recovered to $98.86 on August 3 and pulled back about 5% to $93.89 on August 5.
Agreement with the live app is the replay’s median daily overlap with the live AlpharvestPro app’s stored preset results from July 7 to November 6, 2026. A preset with low agreement is shown when it appears, but it is not relied on.
Prior-close market and screening context · 2021-08-06
| SPY adjusted close | +3.08% versus its 50-session average |
| VIX close | 16.15 |
| AlpharvestPro RS (reconstructed) | 93 · current stored roster, not a 2021 published ranking |
| AlpharvestPro Market Compass (provisional) | Confirmed Uptrend |
| AlpharvestPro presets (33 of 36; 3 left out for near-zero agreement) | 4 of 25 evaluated at close or moderate agreement listed the stock; 0 of 8 at low agreement, shown but not relied on; 0 could not be evaluated |
Retrospective context. Compass headlines and preset membership have unresolved validation limits; distribution-day counts and broad breadth classifications are withheld. No screen output proves a historical order or full SEPA qualification.
The earnings had already arrived
Nucor’s July 22 release reported record quarterly net earnings of $1.51 billion, or $5.04 per diluted share. That compared with $3.10 in the first quarter and $0.36 a year earlier. Management described robust demand and expected another record in the following quarter. The company had also been buying back stock under a $3 billion authorization.
The current quarter was reported evidence; the following-quarter statement was an expectation. A trader could use the operating strength to prioritize the chart while retaining a plan for the possibility that expectations were already reflected in price.
The proposed technical interpretation combines a cup-and-handle structure, an undercut and recovery, and a cheat-area entry. Minervini’s description of the 3-C pattern requires a tightening pause as the stock turns back toward the primary trend. A lower purchase price on its own is not the qualification.
| SEPA element | Evidence before August 9 | Assessment |
|---|---|---|
| Trend | AlpharvestPro RS 93; on AlpharvestPro RS Leaders, Trend Template, Near 52-Week High and QAB. | Supported |
| Fundamentals | July 22: record earnings, stronger sequential and year-over-year EPS. | Supported |
| Catalyst | Strong steel demand and management outlook already public. | Supported context; forecast is uncertain |
| Entry | Cheat/undercut interpretation; exact historical pivot and contraction bounds absent. | Conditional |
| Exit | No authenticated initial stop or sales. | Unknown |
Less distance can mean more exposure
The teaching plan uses Minervini’s structure with our own fixed conventions. After its August 3 high, NUE pulled back for three sessions, August 4 to 6, in a 5.0% range. The trigger sits one cent above that pullback’s high, at $98.80, and the stop one cent below its low, at $93.88: a 4.98% distance on the revised adjusted basis, inside Minervini’s 10% ceiling. The $400 example budget permits 81 shares, or $8,002.80 of exposure.
| Teaching calculation | Archive-adjusted units |
|---|---|
| Final contraction | 2021-08-04 to 2021-08-06 |
| Illustrative account / risk budget | $40,000 / $400 (1%) |
| Conditional trigger / stop | $98.80 / $93.88 |
| Risk per share / distance | $4.92 / 4.98%, within Minervini’s 10% ceiling |
| Whole shares / planned stop loss | 81 / $398.52 |
| Position value / account exposure | $8,002.80 / 20.01% |
A teaching calculation with fixed conventions of our own: trigger 1¢ beyond the final contraction’s high (low for a short) and stop 1¢ beyond its other side, read from bars up to the cutoff, sized so the loss at the stop stays within $400. The 10% ceiling is Minervini’s: “keep your losses to 10 percent or less” (Think & Trade Like a Champion).
A plausible plan would insist that the recovered area hold, wait for the selected trigger, and exit on failure rather than defend a cyclical earnings forecast. A large gap would require new sizing. The tighter reference improves the arithmetic only if the local support is meaningful; an arbitrary tight stop can create repeated avoidable losses.
The last five sessions’ average volume was not below the trailing 50-session average in this archive. That does not disprove a quiet final pivot, but it cautions against describing the whole approach as a uniform volume dry-up without specifying the dates.
Your decision: does the local structure provide enough confirmation to act inside the larger base, or would you require the conventional breakout?
Reveal the later Nucor chart
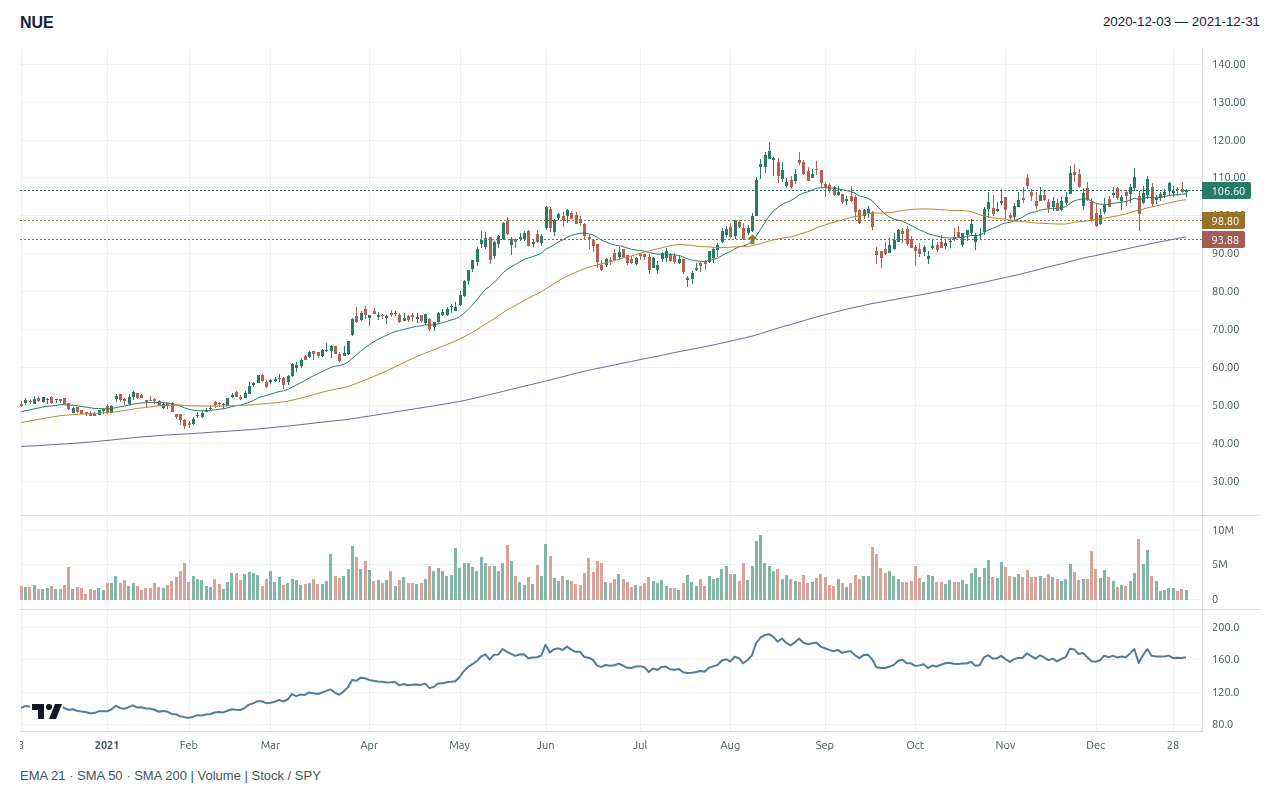
August 9’s adjusted close was about $99.82. On August 10 the stock rose another 9.6%. The archive reached approximately $119.30 on August 13, followed by a decline that took the September 20 range through the $93.88 initial stop. In the exit scenario below, the stop had already moved to breakeven on August 11, and the trade closed at the entry price on September 14. NUE ended the year near $106.60.
AlpharvestPro at the August 9 close. The S&P 500 fell 0.09%; AlpharvestPro Market Compass read Confirmed Uptrend. NUE’s AlpharvestPro RS stayed at 93. The replay added AlpharvestPro ANTS, at moderate agreement. NUE rose 3.3% on 1.53 times its average daily volume over the previous 50 sessions.
The early gain followed by a substantial retreat makes the profit-protection rule central. Under the breakeven rule the scenario gave back the whole gain but no capital; selling into strength, which the scenario does not model, is the rule that would have kept part of it. None of this establishes what Minervini did.
| Hypothetical exit scenario | Through December 31, 2021 |
|---|---|
| Entry | 2021-08-09 at $98.80 |
| Initial stop | $93.88 |
| Stop changes | 2021-08-11: stop raised to breakeven; 2021-09-08: 50-day average reached the entry |
| Exit | 2021-09-14 at $98.80 (breakeven stop) |
| Result | +0.00% · +0.00 R · +$0.00 on 81 shares |
Fixed rules adapted from Minervini’s guidance in Think & Trade Like a Champion: the initial stop; the stop to breakeven once the price has moved three times the risk; and, once the 50-day average reaches the entry, an exit on a close beyond it (“breakeven or better”). Selling into strength is not modelled. Our conventions: a stop change takes effect from the next session; an exit on a close is valued at that close; an entry that opens past the trigger is resized to keep the $400 risk. Daily bars cannot show the order of moves within a day. R is the initial risk per share. A teaching scenario, not Minervini’s trade; no costs, borrow or slippage.
NUE’s lesson is to compare entries by invalidation and exposure, not by which one looks closest to the bottom afterward. When a stock joins an AlpharvestPro breakout preset inside its base, write the local failure point before describing the entry as an advantage.
Reading: Minervini, Think & Trade Like a Champion, Section 7, 3-C pattern. Corporate source: July 22, 2021 release. Chart, RS, presets, volume and Market Compass: AlpharvestPro history archive replay; secondary management commentary does not supply verified fills or net returns.
AlpharvestPro wrote and published this independent research journal. AlpharvestPro is not affiliated with or endorsed by Mark Minervini.

