
Mark Minervini 2021: A Research Journal
Read the journey
January 11, 2021 · A familiar automaker was acting like a fresh candidate. The question was how much of that promise belonged in the entry price.
An established company can acquire a new market story. That creates an awkward choice: buy the excitement as it spreads, or demand a specific place on the chart where the idea can fail. GM’s January setup lets us examine that choice using only what was known at the time.
Our decision cutoff is January 8, and we open AlpharvestPro’s replay of that close. The date under review is January 11; the exact historical order is unavailable.
What AlpharvestPro’s replay shows at the Jan. 8 close
AlpharvestPro’s history archive replays today’s presets, relative strength and Market Compass over 2020–2021 prices. It uses the current stock roster, so it carries survivorship bias. GM is here because it is one of Minervini’s 2021 setups, not because the app selected it. The replay shows how AlpharvestPro’s tools read the chart at the cutoff, not what any screen displayed in 2021 or what Minervini used.
| At the Jan. 8 close | AlpharvestPro replay |
|---|---|
| AlpharvestPro Market Compass (provisional) | Confirmed Uptrend since the S&P 500’s Nov. 4, 2020 follow-through day. All five tracked indexes closed above their 50- and 200-day averages; the S&P 500, Nasdaq Composite, Dow and NYSE Composite closed at new highs. |
| AlpharvestPro RS (reconstructed, current roster) | 74. Earlier readings: 81 on Dec. 9, 2020 (20 sessions before), 67 on Oct. 8, 2020 (63 sessions) and 25 on July 10, 2020 (126 sessions); its range over the last 63 sessions was 63–89. |
| Price and averages | About $41.27, above the 50-day average of $39.68 and the 200-day average of $29.31. |
| AlpharvestPro presets in the week before Jan. 11 | Five sessions, Jan. 4 to Jan. 8: AlpharvestPro RS Leaders, every session; AlpharvestPro Trend Template, every session; AlpharvestPro Near 52-Week High, on Jan. 6, Jan. 7 and Jan. 8. Each of these replays agrees closely with the live app. |
| AlpharvestPro presets the stock was on | AlpharvestPro RS Leaders and AlpharvestPro Trend Template, every session since Oct. 16; AlpharvestPro Near 52-Week High since Jan. 6. All three replays agree closely with the live app. |
| AlpharvestPro early-Stage-2 check | Not passed, on two conditions: the stock had already advanced far above its base low, and its RS was below the check’s own floor. |
| Industry peers | Auto Manufacturers: the two largest companies by today’s market value that traded then; the choice uses today’s knowledge, the readings do not. Tesla, Inc. (TSLA): RS 99; on AlpharvestPro RS Leaders, Trend Template, Near 52-Week High, ANTS, COOL Leaders, Gappers, Momentum Burst and QAB; 0.5% below its 52-week high, above its 50-day average; up 107% over three months. Toyota Motor Corporation (TM): RS 39; on AlpharvestPro Trend Template; 2.2% below its 52-week high, above its 50-day average; up 15% over three months. GM’s RS of 74 was between them. |
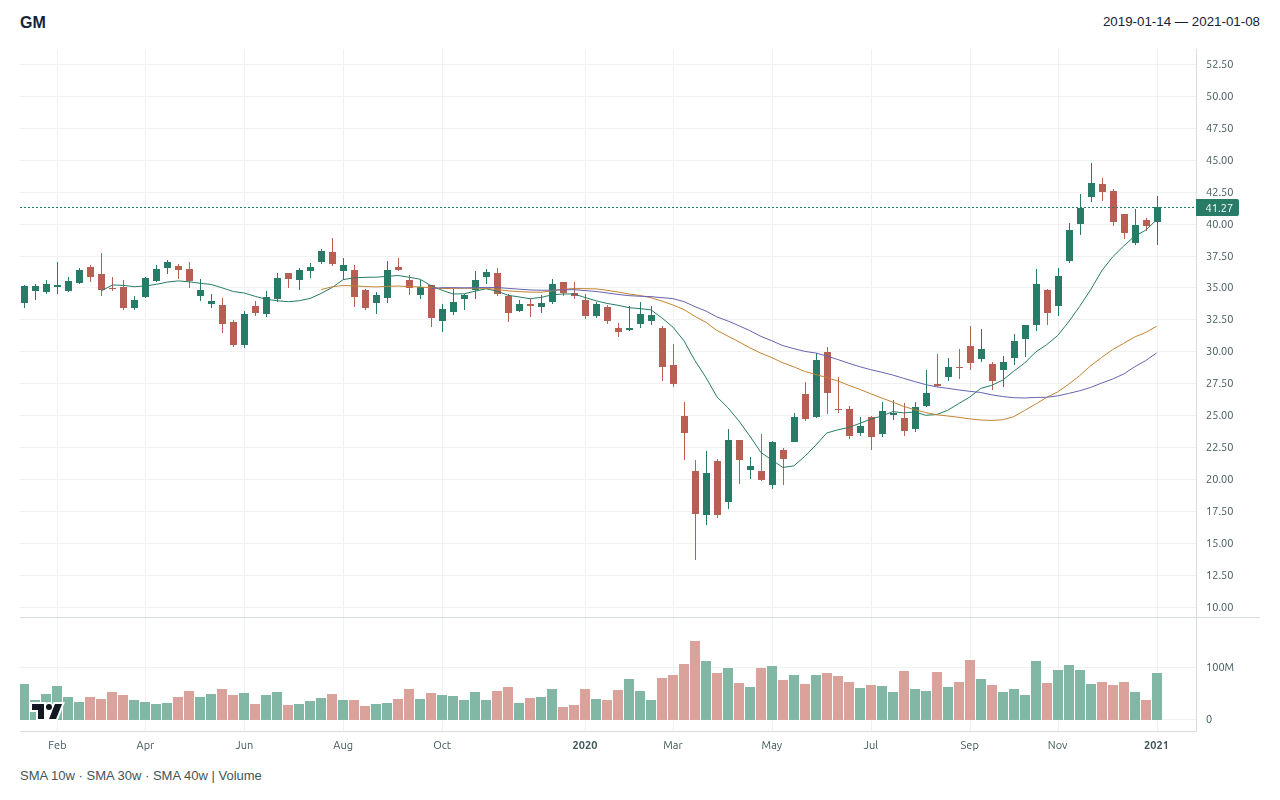
The market gave GM the backdrop Minervini’s rules ask for, and AlpharvestPro’s trend presets agree. Relative strength was the weak spot. GM’s reconstructed AlpharvestPro RS of 74 is above 70, the minimum Minervini’s Trend Template sets on a published ranking. The two scales are not the same, so the reading cannot show whether GM met his criterion in 2021. He also writes that the rank is “preferably in the 80s or 90s, which will generally be the case with the better selections.” GM’s reading had slipped from 81 while the stock pulled back from its November 24 high of $44.77. At the cutoff the close was 7.8% below that high.
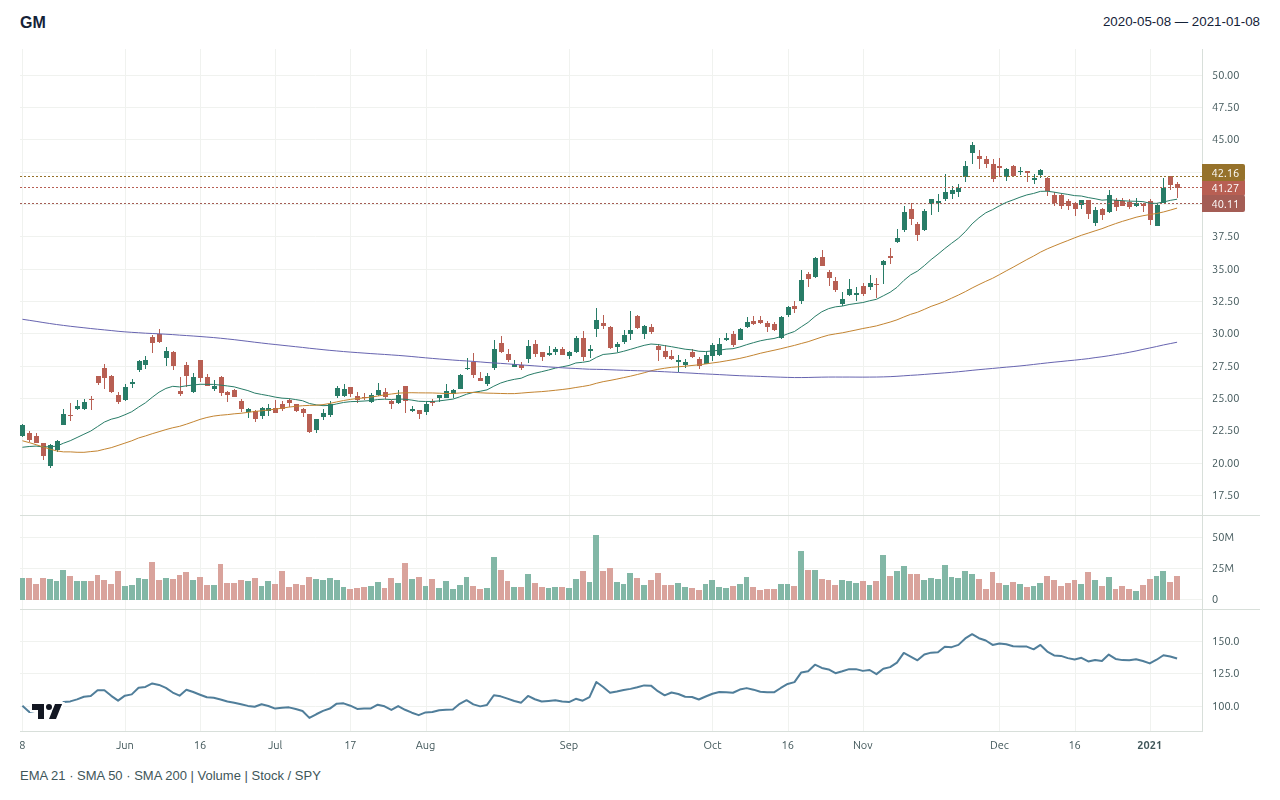
The decision chart below shows that pullback as a base. GM fell to $38.40 on December 21, returned to that level on January 4 and 5 with a low of $38.38, then rebounded and held a narrower range from January 6 to 8, between $40.12 and $42.15. That structure gave a trader something to examine rather than a reason to buy at any price.
Agreement with the live app is the replay’s median daily overlap with the live AlpharvestPro app’s stored preset results from July 7 to November 6, 2026. A preset with low agreement is shown when it appears, but it is not relied on.
Prior-close market and screening context · 2021-01-08
| SPY adjusted close | +5.87% versus its 50-session average |
| VIX close | 21.56 |
| AlpharvestPro RS (reconstructed) | 74 · current stored roster, not a 2021 published ranking |
| AlpharvestPro Market Compass (provisional) | Confirmed Uptrend |
| AlpharvestPro presets (33 of 36; 3 left out for near-zero agreement) | 3 of 25 evaluated at close or moderate agreement listed the stock; 0 of 8 at low agreement, shown but not relied on; 0 could not be evaluated |
Retrospective context. Compass headlines and preset membership have unresolved validation limits; distribution-day counts and broad breadth classifications are withheld. No screen output proves a historical order or full SEPA qualification.
The business behind the screen
GM’s November 5, 2020 earnings release reported third-quarter net income of $4.0 billion and adjusted EBIT of $5.3 billion. Diluted EPS was $2.78, or $2.83 adjusted. Full-size pickups and SUVs were an important part of that performance, while the company also discussed investment in electric and autonomous vehicles.
The narrative was also being refreshed in public. On January 8, the day of our cutoff, GM unveiled a new logo and an “Everybody In” electric-vehicle campaign ahead of CES 2021, the all-digital show that opened on January 11, the date under review.
The distinction matters. A trader could find a forward-looking vehicle narrative interesting without pretending the quarter’s reported earnings already came from that future business. Strong existing operations and expectations for a different future can coexist; they should be assessed separately.
| SEPA element | Evidence available before Jan. 11 | Assessment |
|---|---|---|
| Trend | Jan. 8: on AlpharvestPro RS Leaders, Trend Template and Near 52-Week High; AlpharvestPro RS 74, down from 81 on Dec. 9, 2020, 20 sessions earlier. | Supported, with rank limitations |
| Fundamentals | Nov. 5 release: profitable quarter, strong pickup/SUV performance. | Supported operating recovery |
| Catalyst | EV/AV investment discussed publicly; Jan. 8 logo and EV campaign ahead of CES; no verified link between a particular announcement and the historical order. | Plausible theme; causation unknown |
| Entry | Consolidation after an advance; exact pivot and fill not documented. | Conditional price plan |
| Exit | No authenticated initial stop or sale. | Unknown |
The price of being early
Minervini’s five-part SEPA framework keeps the entry and exit questions alongside the business case. The teaching plan uses his structure with our own fixed conventions. After retesting the base low on January 5, GM paused for three sessions, January 6 to 8, in a 4.8% range, 5.8% below the November 24 base high: a cheat entry inside the base. The trigger sits one cent above the pause high, at $42.16, and the stop one cent below its low, at $40.11. Both are adjusted archive units, not GM’s original tape quotes or Minervini’s reported orders.
| Teaching calculation | Archive-adjusted units |
|---|---|
| Final contraction | 2021-01-06 to 2021-01-08 |
| Illustrative account / risk budget | $40,000 / $400 (1%) |
| Conditional trigger / stop | $42.16 / $40.11 |
| Risk per share / distance | $2.05 / 4.86%, within Minervini’s 10% ceiling |
| Whole shares / planned stop loss | 195 / $399.75 |
| Position value / account exposure | $8,221.20 / 20.55% |
A teaching calculation with fixed conventions of our own: trigger 1¢ beyond the final contraction’s high (low for a short) and stop 1¢ beyond its other side, read from bars up to the cutoff, sized so the loss at the stop stays within $400. The 10% ceiling is Minervini’s: “keep your losses to 10 percent or less” (Think & Trade Like a Champion).
The stop is 4.86% away, inside Minervini’s 10% ceiling, and the $400 budget allows 195 shares. A stop at the base low, $38.38, would have been nearly 9% away; the pause supplies a visible failure level closer to the entry. Choosing a small stop merely to justify a larger position would reverse the reasoning; here the chart supplies it.
A conditional plan would require a controlled move through the trigger, cancel or recalculate after a material gap, and exit if the stop traded. If the trade works, the exit scenario in the reveal applies fixed rules adapted from Minervini’s guidance in Think & Trade Like a Champion: the stop moves to breakeven once the price has risen three times the risk, and once the 50-day average catches up with the entry, a close below it ends the trade. No later automotive headline would justify expanding the original dollar risk.
Your decision: is the evidence strong enough for a 4.86% risk inside the base, or would you wait for GM to clear the $44.77 base high?
Reveal the later GM chart
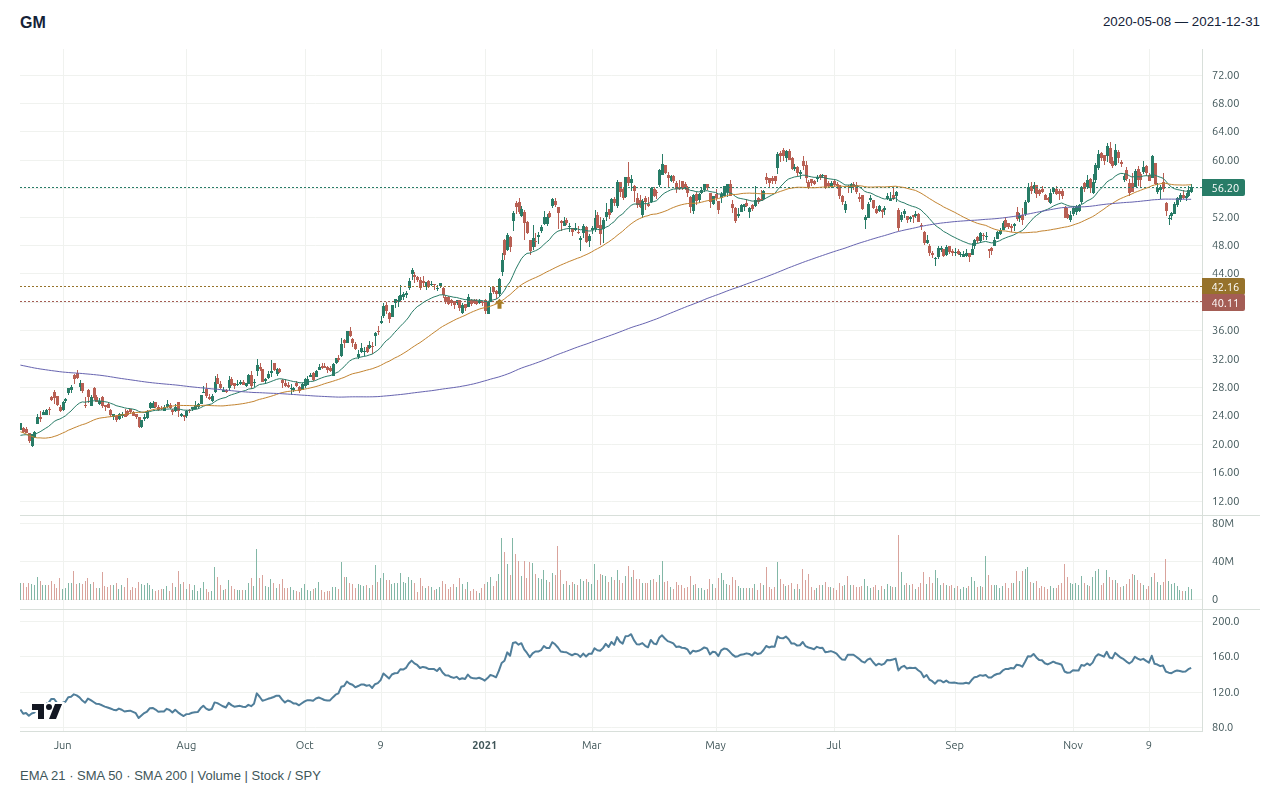
January 11’s adjusted range reached approximately $43.40 and closed at $43.14, above the $42.16 trigger. The later archive path reached $62.47 on November 18 and finished the year near $56.20. That long interval contains many possible holding periods and management choices.
AlpharvestPro at the January 11 close. All five indexes fell, the S&P 500 by 0.66%, and AlpharvestPro Market Compass still read Confirmed Uptrend. GM’s AlpharvestPro RS rose to 78. On 1.65 times its average daily volume over the previous 50 sessions, the replay added AlpharvestPro VVT (Volatility-Volume Thrust) and AlpharvestPro QAB (Quiet Accumulation Breakout), two presets built on AlpharvestPro’s own method, whose replays agree moderately with the live app. The close was still 3.6% below the November high: on the archive’s data, January 11 was not yet a close above the base.
The next day GM launched BrightDrop, a commercial electric-delivery business, and the stock closed above its November high for the first time.
A secondary analyst’s estimated exit cannot tell us which of those choices Minervini made. We therefore leave his realized GM return blank. The chart supports a study of opportunity and give-back risk, while execution evidence would be needed to judge his actual handling of either.
| Hypothetical exit scenario | Through December 31, 2021 |
|---|---|
| Entry | 2021-01-11 at $42.16 |
| Initial stop | $40.11 |
| Stop changes | 2021-01-13: stop raised to breakeven; 2021-01-22: 50-day average reached the entry |
| Exit | 2021-04-20 at $53.45 (close below the 50-day average) |
| Result | +26.79% · +5.51 R · +$2,202.51 on 195 shares |
Fixed rules adapted from Minervini’s guidance in Think & Trade Like a Champion: the initial stop; the stop to breakeven once the price has moved three times the risk; and, once the 50-day average reaches the entry, an exit on a close beyond it (“breakeven or better”). Selling into strength is not modelled. Our conventions: a stop change takes effect from the next session; an exit on a close is valued at that close; an entry that opens past the trigger is resized to keep the $400 risk. Daily bars cannot show the order of moves within a day. R is the initial risk per share. A teaching scenario, not Minervini’s trade; no costs, borrow or slippage.
GM’s practical lesson is to put a number beside enthusiasm. When a stock with a new story reaches AlpharvestPro’s Near 52-Week High preset, check its RS path before the headline: GM’s was fading. Then record the latest reported source of profits, the proposed trigger, and the maximum loss the position would create.
Sources: GM release, November 5, 2020; TechCrunch, January 8, 2021; IndustryWeek on BrightDrop (outcome); Minervini, Trade Like a Stock Market Wizard, Chapter 3; AlpharvestPro history archive (reconstructed prices, RS, presets and Market Compass) at January 8. Prices incorporate later split/dividend adjustments. Chart selection is retrospective; fills, costs, sizes, and actual exits are unknown.
AlpharvestPro wrote and published this independent research journal. AlpharvestPro is not affiliated with or endorsed by Mark Minervini.

