
Mark Minervini 2021: A Research Journal
Read the journey
April 5, 2021 · GreenBox combined a strong preceding price move with mixed operating results. The two deserved separate verdicts.
It is easy to call an early price surge a good trade. It is harder to establish the entry, define the loss that was acceptable, and show how the position would be managed whichever way the price moved next. GBOX forces those questions into the foreground.
The decision cutoff is April 1, the preceding U.S. market session before April 5, and we open AlpharvestPro’s replay of that close. The historical archive series was recovered under the company’s later ticker, RVYL. The corporate identity is documented in a later filing; that record identifies the company and is not treated as news available to a trader in April 2021.
What AlpharvestPro’s replay shows at the April 1 close
AlpharvestPro’s history archive replays today’s presets, relative strength and Market Compass over 2020–2021 prices. It uses the current stock roster, so it carries survivorship bias. GBOX is here because it is one of Minervini’s 2021 setups, not because the app selected it. The replay shows how AlpharvestPro’s tools read the chart at the cutoff, not what any screen displayed in 2021 or what Minervini used.
| At the April 1 close | AlpharvestPro replay |
|---|---|
| AlpharvestPro Market Compass (provisional) | Confirmed Uptrend. The uptrend had held since the S&P 500’s new 52-week closing high on March 11, with 11 sessions at Uptrend Under Pressure along the way, the latest on March 31. All five tracked indexes rose that day and closed above their 50- and 200-day averages; the S&P 500 closed at a new high. |
| AlpharvestPro RS (reconstructed, current roster) | 99. Earlier readings: 99 on March 4 (20 sessions before), 99 on Dec. 30, 2020 (63 sessions) and 99 on Sept. 30, 2020 (126 sessions); it was 99 in every one of the last 63 sessions. |
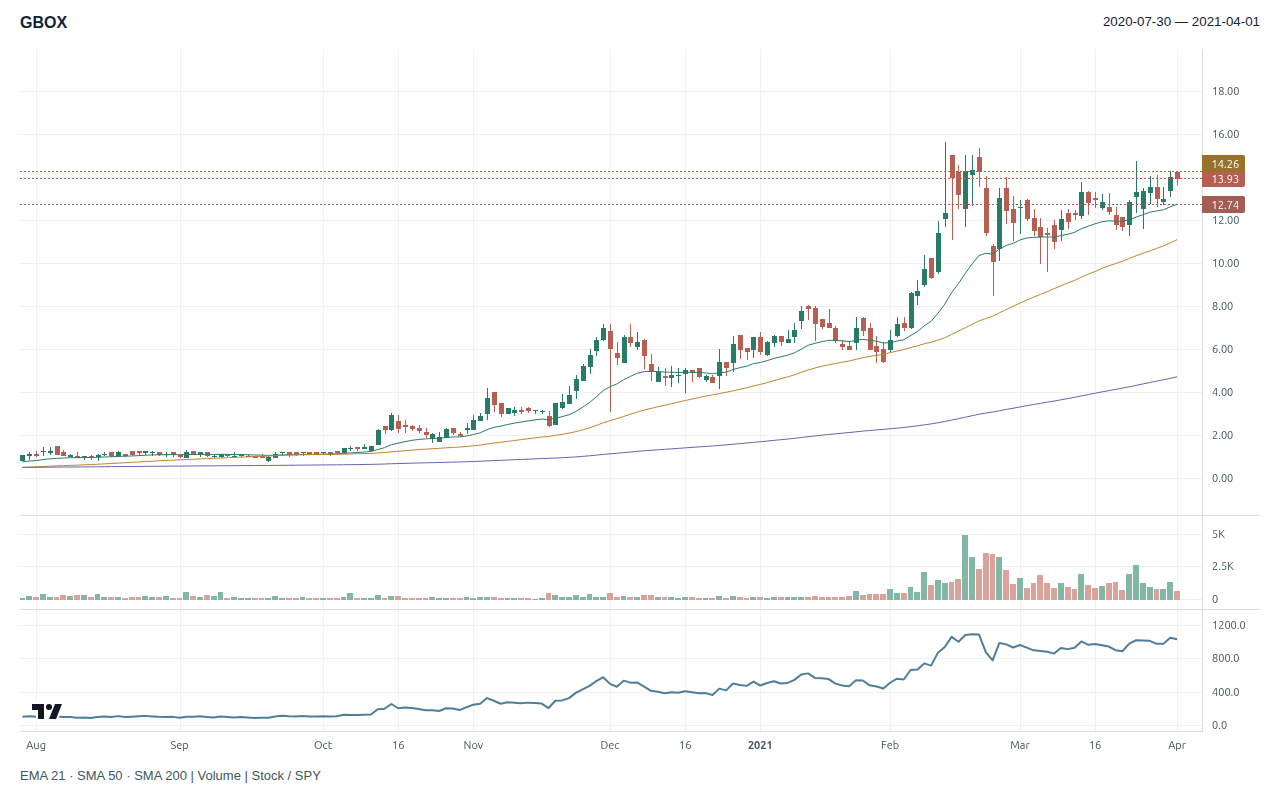
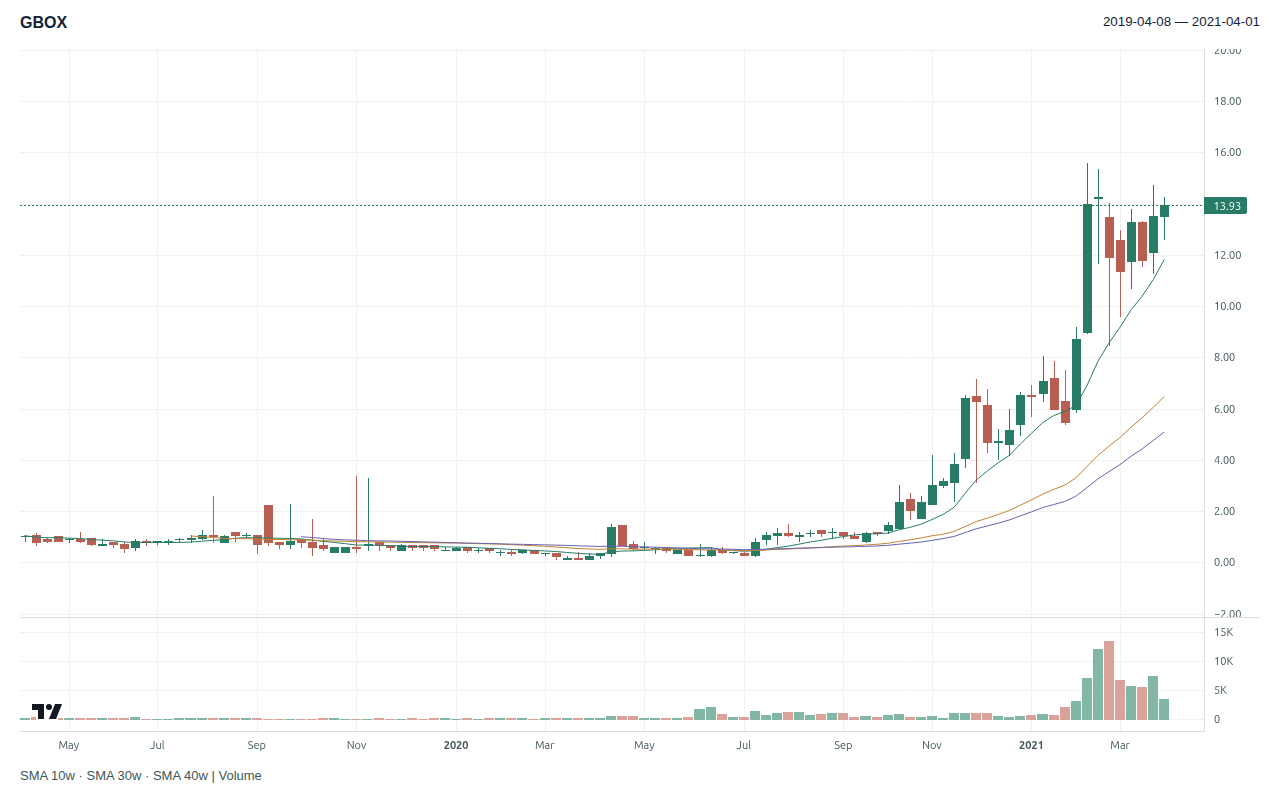
| Price and averages | $13.93, above the 50-day average of $11.07 and above the 200-day average of $4.70. It closed 10.7% below its 52-week high of $15.60 on Feb. 11. |
| AlpharvestPro presets in the week before April 5 | Five sessions, March 26 to April 1: AlpharvestPro RS Leaders, every session; AlpharvestPro Trend Template, every session; AlpharvestPro QAB, on March 26. These replays agree closely with the live app, except QAB, which agrees moderately. Also shown, but not relied on because its replay agrees poorly with the live app: AlpharvestPro NR7 Squeeze, on April 1. |
| AlpharvestPro presets the stock was on | AlpharvestPro RS Leaders, every session since July 21, 2020; AlpharvestPro Trend Template, every session since Aug. 7, 2020. Both replays agree closely with the live app. AlpharvestPro NR7 Squeeze also appears from April 1, but its replay agrees poorly with the live app. |
| AlpharvestPro early-Stage-2 check | Not passed, on two conditions: it stood far above its 150-day average and the stock had already advanced far above its base low. |
| Industry peers | Software – Infrastructure: the two largest companies by today’s market value that traded then; the choice uses today’s knowledge, the readings do not. Microsoft Corporation (MSFT): RS 30; on AlpharvestPro Trend Template and Ichimoku Cloud Breakout; 1.3% below its 52-week high, above its 50-day average; up 10% over three months. Palantir Technologies Inc. (PLTR): no RS reading; on no preset the replay relies on; down 8% over three months. GBOX’s RS of 99 was above Microsoft Corporation’s; Palantir Technologies Inc. had no reading. |
Prices here are converted from the archive’s revised units at 350 units per 2021 dollar. The conversion and its check against a dated quote are explained after the reveal.
In the week before April 5, AlpharvestPro QAB listed GBOX on March 26, at moderate agreement; otherwise only the two trend presets appeared at reliable agreement. The low-agreement readings in the table are not relied on.
AlpharvestPro had ranked GBOX at the very top of its roster for months, and both trend presets agreed. The early-stage check read the same chart differently: the stock stood about three times its 200-day average. The base was wide. From the February 11 high, GBOX fell about 46% to $8.50 on February 23, then pulled back about 18% from March 12 to March 23 and about 14% from March 24 to March 29. On April 1 volume was less than half its 50-session average.
Agreement with the live app is the replay’s median daily overlap with the live AlpharvestPro app’s stored preset results from July 7 to November 6, 2026. A preset with low agreement is shown when it appears, but it is not relied on.
Prior-close market and screening context · 2021-04-01
| SPY adjusted close | +3.54% versus its 50-session average |
| VIX close | 17.33 |
| AlpharvestPro RS (reconstructed) | 99 · current stored roster, not a 2021 published ranking |
| AlpharvestPro Market Compass (provisional) | Confirmed Uptrend |
| AlpharvestPro presets (33 of 36; 3 left out for near-zero agreement) | 2 of 19 evaluated at close or moderate agreement listed the stock; 1 of 7 at low agreement, shown but not relied on; 7 could not be evaluated |
Retrospective context. Compass headlines and preset membership have unresolved validation limits; distribution-day counts and broad breadth classifications are withheld. No screen output proves a historical order or full SEPA qualification.
The release available before the setup
GreenBox’s March 31, 2021 results announcement reported 2020 revenue of $8.5 million, down 14.8%, alongside an improvement from a gross loss to $3.7 million of gross profit. The full-year net loss was about $5.0 million.
That combination supports a business undergoing change, with improved gross economics and continuing losses. It does not support a simple claim of uninterrupted sales-and-profit growth. Larger processing-volume figures must also be kept separate from the revenue the company actually recognized.
Six weeks earlier, on February 17, GreenBox had moved to Nasdaq with a public offering of 4.15 million shares at $10.50, later raised to about $50.1 million when the underwriters exercised their option. The listing widened the stock’s audience; the offering added shares.
Minervini’s five-part SEPA assessment is useful here precisely because it prevents one attractive chart description from filling every evidence gap. A possible breakout can be discussed without declaring that the fundamentals, trend qualification, and exit plan are all verified.
| SEPA element | Evidence available | Assessment |
|---|---|---|
| Trend | April 1: AlpharvestPro RS 99; on AlpharvestPro RS Leaders and Trend Template since summer 2020; early-Stage-2 check not passed. | Supported price strength; extended |
| Fundamentals | March 31: revenue down; gross profit improved; net loss persisted. | Mixed; clean profit-growth thesis unsupported |
| Catalyst | Feb. 17 Nasdaq listing and offering; fresh results on March 31; order-specific motive unknown. | Public developments, uncertain trade link |
| Entry | April 5 date under review; pivot and fill not authenticated. | Insufficient execution evidence |
| Exit | No documented stop, size, or sale. | Unknown |
What a defensible plan would still need
The decision chart contains only bars through April 1, converted to 2021 dollars. On Minervini’s structure, the final three sessions, March 30 to April 1, ran from $14.25 down to $12.75. A trigger one cent above that area, at $14.26, and a stop one cent below it, at $12.74, put the risk at 10.66%, just beyond the 10% Minervini sets as his maximum loss, so the plan is not taken. Liquidity and a possible gap beyond the stop would need separate allowance.
| Teaching calculation | 2021 dollars (archive units ÷ 350) |
|---|---|
| Final contraction | 2021-03-30 to 2021-04-01 |
| Illustrative account / risk budget | $40,000 / $400 (1%) |
| Conditional trigger / stop | $14.26 / $12.74 |
| Risk per share / distance | $1.52 / 10.66%, beyond Minervini’s 10% ceiling, so the plan is not taken |
| Whole shares / planned stop loss | 263 / $399.76 |
| Position value / account exposure | $3,750.38 / 9.38% |
A teaching calculation with fixed conventions of our own: trigger 1¢ beyond the final contraction’s high (low for a short) and stop 1¢ beyond its other side, read from bars up to the cutoff, sized so the loss at the stop stays within $400. The 10% ceiling is Minervini’s: “keep your losses to 10 percent or less” (Think & Trade Like a Champion).
A trader could wait for a clearer financial qualification or a controlled trigger with a defensible stop. We will not reconstruct an attractive share count from the later peak. Nor can we decide whether Minervini followed his system without evidence of his actual risk plan.
Your decision: what minimum information would you require before promoting this from an interesting chart to an executable plan?
Reveal the later GBOX path
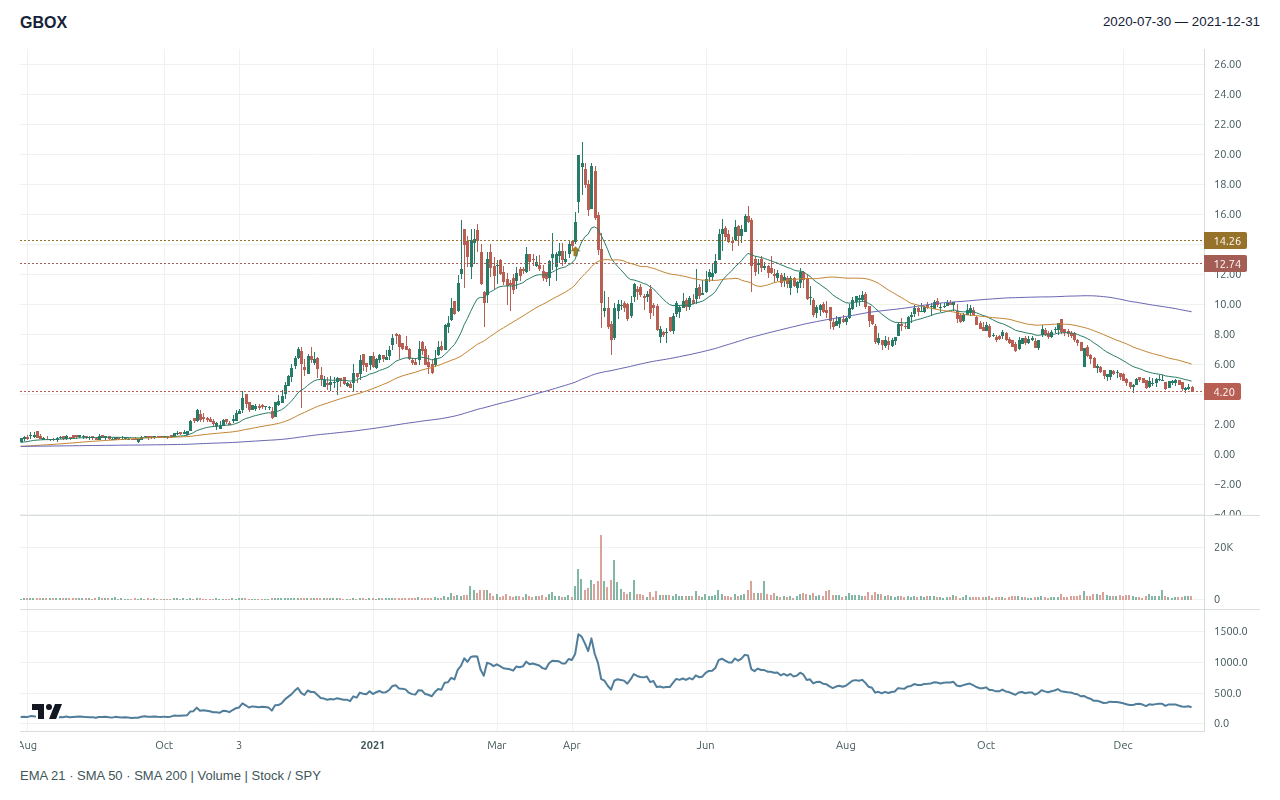
Price units. The 350-to-1 conversion reflects the company’s later 1-for-10 (September 2023) and 1-for-35 (January 2026) reverse splits. It checks against a dated quote: the archive’s July 8, 2021 close converts to exactly the $11.72 last sale stated in GreenBox’s Form S-3 filed July 9, 2021. Volume is shown as stored.
On April 5, GBOX rose 11.1% to about $15.48, trading above its February high during the day. On April 6, after the company doubled its 2021 payment-processing outlook to $1.2 billion from $600 million in a release published after the April 5 close, the stock rose another 28.6% to about $19.90 on 8.18 times its 50-session average volume. It reached about $20.78 on April 7, closed at about $16.35 on April 9 and ended 2021 near $4.20.
The April 5 session came before the outlook raise was published, so the move on the date under review was not a reaction to it.
AlpharvestPro at the April 5 close. The S&P 500 rose 1.44%; AlpharvestPro Market Compass read Confirmed Uptrend. GBOX’s AlpharvestPro RS stayed at 99. The replay added AlpharvestPro Near 52-Week High and AlpharvestPro Breakout Setup, at close agreement; AlpharvestPro QAB, at moderate agreement; and AlpharvestPro RVOL Leaders, whose replay agrees poorly with the live app. It dropped AlpharvestPro NR7 Squeeze. GBOX rose 11.1% on 3.61 times its average daily volume over the previous 50 sessions.
The archive high is not a documented sale. The path could accommodate very different outcomes depending on entry price, stop, partial profits, and timing. No realized result is assigned.
Exit scenario. None: the plan’s 10.66% risk is beyond Minervini’s 10% ceiling, so the scenario takes no position.
The case’s lesson is to keep the threshold for evidence steady. In AlpharvestPro, an RS of 99 and two trend presets say the stock has been strong; they do not repair mixed fundamentals or supply an exit plan. Complete each part of the assessment on its own evidence.
Corporate sources: GreenBox release dated March 31, 2021, as originally announced (figures also in the 2020 Form 10-K); February 17, 2021 prospectus. Outcome: GreenBox release “GreenBox POS Raises 2021 Processing Volume Estimates”, April 5, 2021, after the close. Method: Minervini, Trade Like a Stock Market Wizard, Chapter 3. Later SEC records connect GBOX and RVYL under the same registrant and document the reverse splits; they are identification and price-basis evidence only. Chart, RS, presets and Market Compass: AlpharvestPro history archive replay.
AlpharvestPro wrote and published this independent research journal. AlpharvestPro is not affiliated with or endorsed by Mark Minervini.

