
Mark Minervini 2021: A Research Journal
Read the journey
January 20, 2021 · The chart invited speculation about a new business. A short price history and regulatory milestones made the missing evidence part of the decision.
A young company can offer a large addressable opportunity long before it offers a long earnings record. For a momentum trader, that creates a temptation to substitute the size of the possible future for the quality of the present setup.
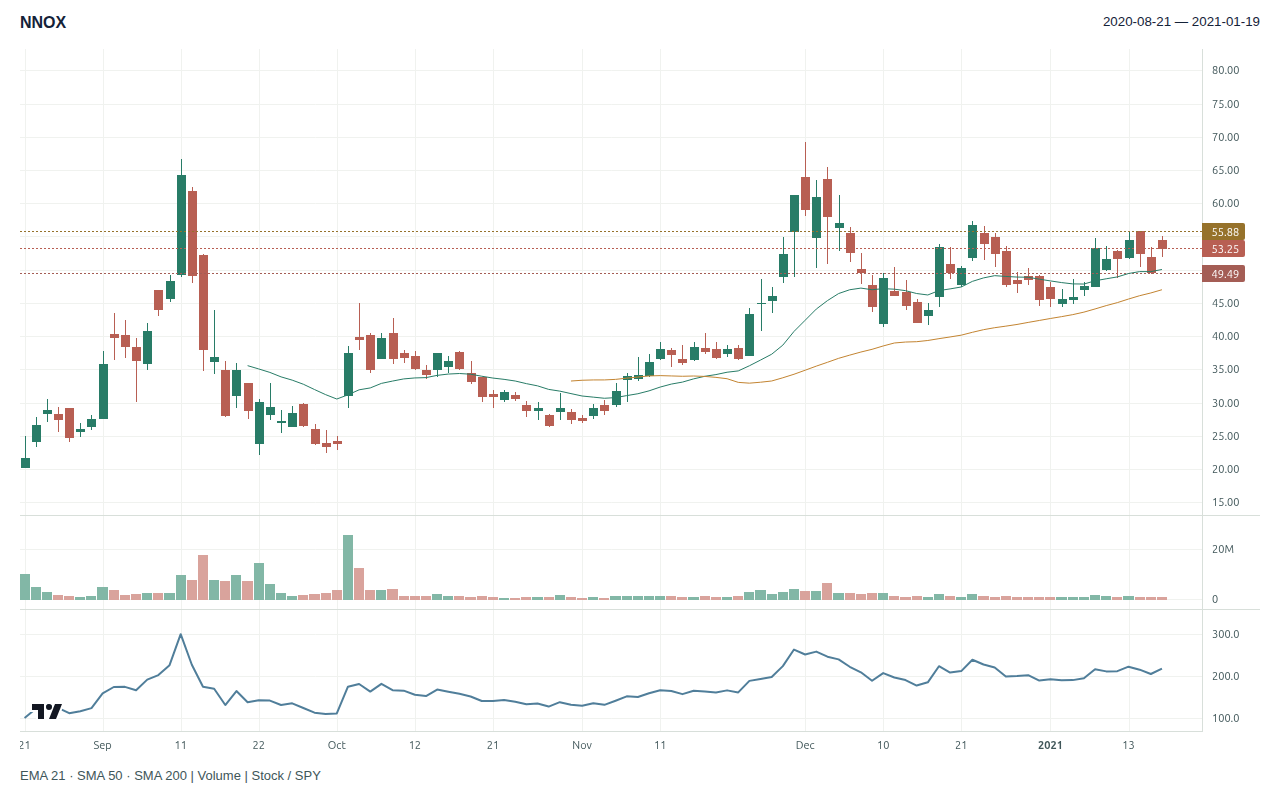
For NNOX we stop at January 19, the session before the date under review, and open AlpharvestPro’s replay of that close. Only 103 valid prior bars were available, because the stock had listed in August 2020.
What AlpharvestPro’s replay shows at the Jan. 19 close
AlpharvestPro’s history archive replays today’s presets, relative strength and Market Compass over 2020–2021 prices. It uses the current stock roster, so it carries survivorship bias. NNOX is here because it is one of Minervini’s 2021 setups, not because the app selected it. The replay shows how AlpharvestPro’s tools read the chart at the cutoff, not what any screen displayed in 2021 or what Minervini used.
| At the Jan. 19 close | AlpharvestPro replay |
|---|---|
| AlpharvestPro Market Compass (provisional) | Confirmed Uptrend since the S&P 500’s Nov. 4, 2020 follow-through day. All five tracked indexes rose that day and closed above their 50- and 200-day averages. |
| AlpharvestPro RS (reconstructed, current roster) | No reading. NNOX’s 103 sessions were fewer than AlpharvestPro’s RS ranking needs. |
| Price and averages | $53.25, above the 50-day average of about $46.99. There was not yet enough history for a 200-day average. |
| AlpharvestPro presets in the week before Jan. 20 | None. In the five sessions from Jan. 12 to Jan. 19 most presets were still unknown for a stock this young, and the replay showed it on none of the others. |
| AlpharvestPro presets the stock was on | None. A stock this young had too little history for 28 of the 33 presets, which are unknown, not failed; the replay did not show it on any of the other 5. |
| Industry peers | Medical Devices: the two largest companies by today’s market value that traded then; the choice uses today’s knowledge, the readings do not. Abbott Laboratories (ABT): RS 30; on AlpharvestPro Trend Template; 1.8% below its 52-week high, above its 50-day average; up 3% over three months. Medtronic plc (MDT): RS 28; on AlpharvestPro Trend Template and AVWAP Pullback Watch; 1.3% below its 52-week high, above its 50-day average; up 8% over three months. NNOX had no RS reading to compare. |
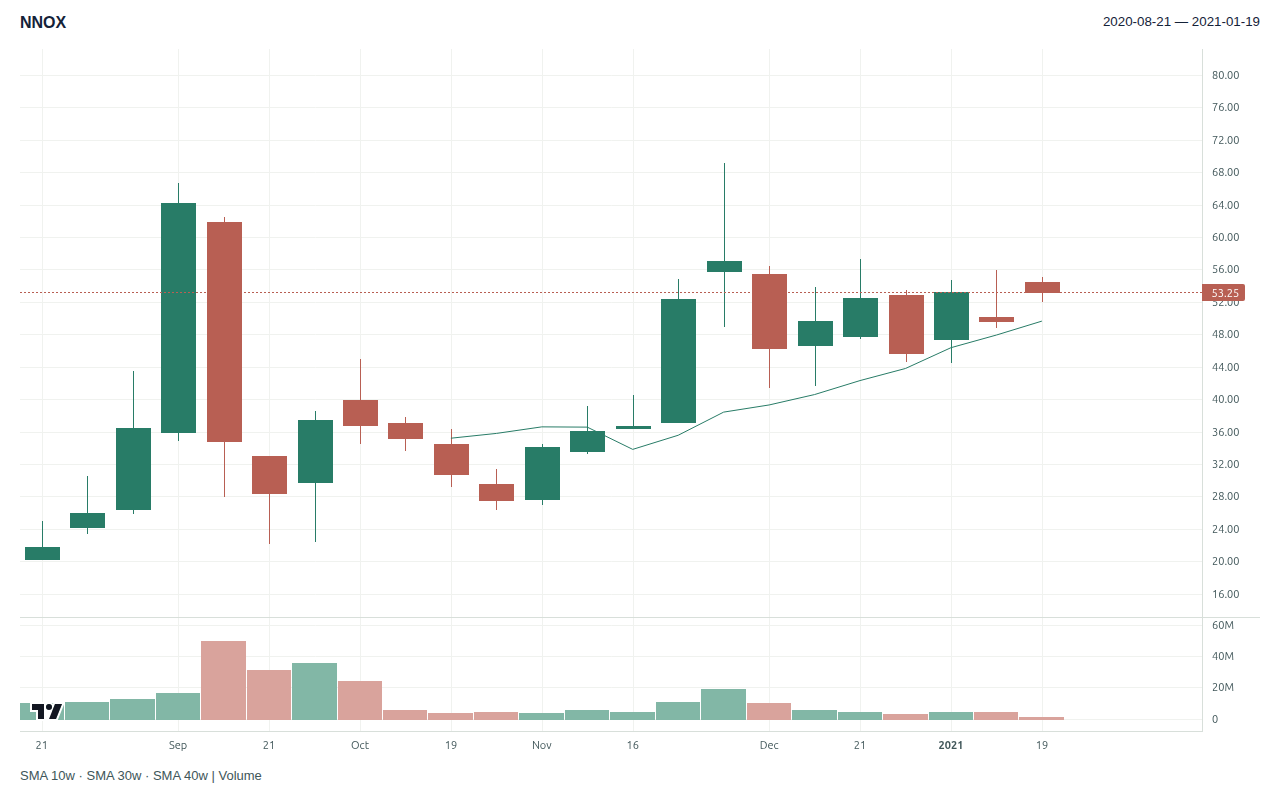
The replay therefore cannot say whether AlpharvestPro would have shown NNOX at all. The chart still has a shape. After running from its August listing to a high of $69.18 on December 1, NNOX pulled back about 40% to $41.50 on December 10, then about 22% from $57.26 to $44.55 by January 5, then about 11% from $55.77 on January 13 to $49.50 on January 15. Volume ran below 60% of its 50-session average on ten of the fifteen sessions from December 24 to January 15.
Those tightening pullbacks on quieter trading resemble the contractions Minervini looks for in a base. On five months of prices, though, no Trend Template test can be completed. That is insufficient history, not a rating of zero and not a failed business verdict.
Prior-close market and screening context · 2021-01-19
| SPY adjusted close | +3.50% versus its 50-session average |
| VIX close | 23.24 |
| AlpharvestPro RS (reconstructed) | Unavailable · current stored roster, not a 2021 published ranking |
| AlpharvestPro Market Compass (provisional) | Confirmed Uptrend |
| AlpharvestPro presets (33 of 36; 3 left out for near-zero agreement) | 0 of 4 evaluated at close or moderate agreement listed the stock; 0 of 1 at low agreement, shown but not relied on; 28 could not be evaluated |
Retrospective context. Compass headlines and preset membership have unresolved validation limits; distribution-day counts and broad breadth classifications are withheld. No screen output proves a historical order or full SEPA qualification.
What the screen could not show
Nanox’s November 9, 2020 business update described development of its Nanox.ARC imaging system and reported $240.0 million of cash, cash equivalents and marketable securities. The quarter produced an $11.1 million net loss. Deployment agreements described in the release were subject to regulatory approvals and other conditions.
The update also set out a regulatory timetable rather than a result. It said the company had further advanced its 510(k) application for the single-source Nanox.ARC and was on track for clearance of the multi-source version by mid-2021. No FDA clearance had been granted at our cutoff, and no later clearance should be written backward into January.
Those are reasons to investigate a developing company and its financing. They are not a recurring-profit record, completed deployments, or regulatory clearance. Under Minervini’s SEPA framework, the catalyst question and the fundamentals question remained distinct.
| SEPA element | Evidence at the cutoff | Assessment |
|---|---|---|
| Trend | 103 prior bars; close above the available 50-day average; no 200-day average, AlpharvestPro RS or preset readings. | Partial support; long template untestable |
| Fundamentals | Nov. 9 update: $11.1m quarterly loss; substantial cash after IPO. | Profit-growth thesis unsupported |
| Catalyst | 510(k) application in progress; deployment agreements conditional on regulatory approvals. | Potential catalyst with material uncertainty |
| Entry | Date under review Jan. 20; exact intraday entry absent. | Unknown actual trigger |
| Exit | No documented stop or sales. | Unknown |
A small position does not make the thesis complete
The teaching plan uses Minervini’s structure with our own fixed conventions as far as a young chart allows. The final contraction, January 13 to 19, ran from $55.87 down to $49.50. A trigger one cent above it, at $55.88, and a stop one cent below it, at $49.49, put the risk at 11.44%, beyond his 10% ceiling, so the plan is not taken. The $400 example budget would permit 62 shares. That arithmetic limits planned exposure; it cannot make a headline gap respect the stop.
| Teaching calculation | Archive-adjusted units |
|---|---|
| Final contraction | 2021-01-13 to 2021-01-19 |
| Illustrative account / risk budget | $40,000 / $400 (1%) |
| Conditional trigger / stop | $55.88 / $49.49 |
| Risk per share / distance | $6.39 / 11.44%, beyond Minervini’s 10% ceiling, so the plan is not taken |
| Whole shares / planned stop loss | 62 / $396.18 |
| Position value / account exposure | $3,464.56 / 8.66% |
A teaching calculation with fixed conventions of our own: trigger 1¢ beyond the final contraction’s high (low for a short) and stop 1¢ beyond its other side, read from bars up to the cutoff, sized so the loss at the stop stays within $400. The 10% ceiling is Minervini’s: “keep your losses to 10 percent or less” (Think & Trade Like a Champion).
The distance is also wider than Minervini’s own limit. “You should definitely keep your losses to 10 percent or less,” he writes in Think & Trade Like a Champion, because losses work against you geometrically. The chart offered nothing tighter at the cutoff: that final contraction was itself 11.4% deep. Under his rule, that width is a reason to wait or pass, not a reason to accept a larger loss on a smaller position.
One defensible response is to wait: wait for a trigger, a narrower structure, or better milestone evidence. A trader accepting the speculative case would need to identify the catalyst being traded, define failure before entry, and avoid adding to a loss. Minervini’s advance-planning discussion in Think & Trade Like a Champion provides the relevant discipline even where the evidence does not establish a conventional earnings-led setup.
Your decision: is this a qualified long under the method you intended to use, or a separate speculative exception that needs its own rules?
Reveal the later NNOX path
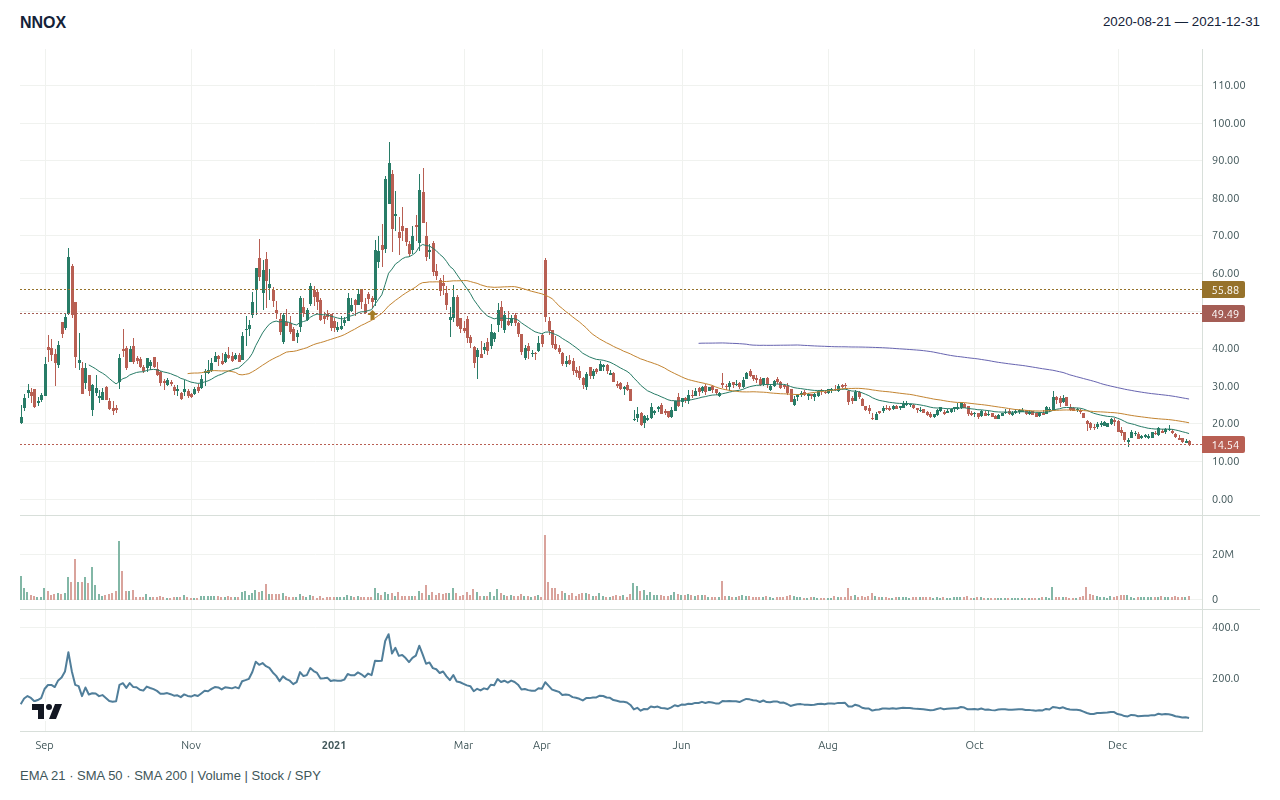
January 20’s high was $54.00, $1.88 short of our $55.88 trigger. The trigger was first touched on January 21, when NNOX broke out: it rose 26.2% to close at $66.21 on 3.27 times its average daily volume over the previous 50 sessions. This mismatch is useful. A date under review does not authenticate the trigger we reconstructed, and an earlier entry inside the structure is possible but undocumented.
AlpharvestPro at the January 20 close. All five tracked indexes closed at new highs, and AlpharvestPro Market Compass read Confirmed Uptrend. The replay still had no RS reading for NNOX and showed it on no preset, with most presets still unknown.
The archive later records a $94.81 high on January 27. On January 30 the FDA sent Nanox additional information requests on the single-source Nanox.ARC application, asking for more support on its intended use and its comparability with the predicate device; the company disclosed them in a February 1 filing. NNOX closed 8.2% lower that day. The February 23 range crossed the illustrative initial stop level, and the stock ended the year at $14.54.
These observations do not establish a trade sequence or Minervini’s realized outcome. They show why a rapid early advance cannot settle the risk-management question, and how a pending regulatory decision can turn against a young company after the entry.
Exit scenario. None: the plan’s 11.44% risk is beyond Minervini’s 10% ceiling, so the scenario takes no position.
For a young listing, AlpharvestPro’s replay may show nothing at all: no RS, no presets. Write “not enough history” explicitly beside every unavailable test. Then decide whether to wait or to apply a different, clearly named strategy. Quietly treating an unavailable prerequisite as a pass teaches the wrong lesson from an exciting chart.
Sources: Nanox update, November 9, 2020; Nanox Form 6-K, February 1, 2021 (outcome only); Minervini, Trade Like a Stock Market Wizard, Chapter 3, and Think & Trade Like a Champion, Sections 1 and 2. Chart, RS, presets and Market Compass: AlpharvestPro history archive replay; the January 19 cutoff excludes all later bars. Actual executions, sizes, stops, and exits are not established.
AlpharvestPro wrote and published this independent research journal. AlpharvestPro is not affiliated with or endorsed by Mark Minervini.

