
Mark Minervini 2021: A Research Journal
Read the journey
Discussion and conclusion: small initial positions, earned exposure, partial profits and the compounding of a $1 million account.
A stock doubles. The account does not. If the original position used 5% of the account, its advance cannot become a 100% portfolio gain. And if half was sold on the way up, the shares still held tell only part of the story.
After 22 cases from Mark Minervini’s 2021 journey, this is the final question: how do promising charts become money retained in an account? The answer needs position sizes, partial sales, failed plans and decisions made before earnings. A list of eventual winners cannot supply them.
We begin with US$1,000,000. The following account is hypothetical. Minervini’s organizer-reported 2021 result was +334.8% in the $1 million-plus stock division; the selected charts are not its complete trade ledger. His published principles help us specify a teaching model, then see where it agrees with the evidence and where it falls short.
Earn exposure before increasing commitment
Section 5 of Think & Trade Like a Champion describes pilot purchases followed by greater exposure as existing positions work. Minervini’s 2018 first-person interview and 2021 interview explain that feedback loop: successful current commitments earn more capital; repeated stops call for less. We should not wait for every winner to be completely sold before recognizing traction.
The book’s 25%, 50%, 75% and 100% exposure examples concern the portfolio. They do not mean putting half or all of the account into one ticker. Section 8 describes starting individual positions around 5–10% and a preference for 20–25% allocations in the strongest names. Its printed outer limit is 50%; our study adopts a stricter 25% cap on any new ticker.
His January 29, 2025 X example illustrates the distinction directly: he describes building exposure across seven stocks over several days. The companion post lists a sequence of pilot purchases. These authenticated posts are later teaching examples, not evidence of 2021 orders or inputs to our trade dates.
Compounding changes the dollars behind a percentage. A 20% allocation is $200,000 in a $1 million account and $250,000 after the account reaches $1.25 million. A 10% gain on that second position contributes about $25,000 before costs, or 2% of the then-current account. We do not apply the stock’s return to the entire balance.
Our new positions progress through 5%, 10% and 20% target allocations. Initial-risk budgets are respectively 0.3125%, 0.625% and 1.25% of the preceding close’s account equity. The smaller of the capital allowance, risk allowance and available cash determines the whole-share order. A wide stop can reduce an allocation below its target; an entry more than 10% from its initial stop is rejected.
One position showing at least 1R of open profit, or a profitable partial sale, can earn the second step. Two working positions, or a further profitable sale, can earn the third. Aggregate open P&L must be nonnegative, and the model advances at most one step per close. A completed gross losing trade takes priority and reduces the next-entry step. Here 1R is the original fill-to-stop distance. These are our numerical conventions, not a recovered Minervini sizing algorithm.
After a loss, a sale from an older position cannot by itself restore a larger allocation step. New profit credit must come from a position opened on or after that reduction, or from the required number of currently working positions. This keeps an old runner’s later sale from standing in for fresh traction.
Total exposure allowed for new orders is capped at 25%, 50% or 100% at those steps. Existing holdings keep their written exits. New orders use the preceding close’s equity, cash and exposure; an exit today cannot finance an entry today. A growing account can support more dollars at the same allocation percentage. Profits do not automatically justify a larger percentage bet.
A winner needs more than an initial stop
Minervini’s June 13, 2021 X post emphasizes preserving a decent profit. His June 21 rules image also calls for taking profits during strength and reducing aggression when trading turns cold. Both were checked through X’s official public embed data. The book supplies the fuller discussion of partial sales, rapid advances, abnormal weakness and earnings risk.
We turn those ideas into the following reproducible policy. Each numerical threshold belongs to this study. A 10% reference gain comes from a book example; it is not a measured average of Minervini’s trades.
| Condition | This study’s instruction |
|---|---|
| Initial failure | Prior-close contraction stop; reject entry risk above 10%. Gap beyond an active stop fills at the opening price. |
| Meaningful advance | At the smaller of +2R or +10%, arm a breakeven stop, including the modeled round-trip charge in the cost variant. |
| First strength sale | Sell half the original shares at +2R; leave any odd share in the runner. An opening gap beyond the target uses the open. |
| Back stop | After +20% favorable movement, protect at least +10% on the remaining shares, subject to gaps. |
| Rapid-run proxy | At a close with at least +25% over 10 sessions, at least 7 favorable days, a positive final day and at least +20% gain from entry, queue half the remaining shares for the next open. |
| Abnormal weakness | After protection is armed and at least 3 held sessions, the largest adverse close-to-close chart move from the marked session onward on at least 1.5× prior average volume queues the runner for next open. The marked session’s full return can include movement before an intraday fill. Use up to 50 prior sessions; require at least 10 sessions and complete volumes throughout the chosen window. Missing volume disables this signal. |
| Moving-average exit | Once the 50-session average has been observed on the initial stop’s side and then catches entry, a close beyond that line queues the runner for next open. Short rules mirror the long rules. |
The rapid-run test is a warning proxy. It cannot establish the late-stage base count, valuation expansion or complete climax pattern discussed in the book. Selling into strength does not promise the exact high. A closing signal becomes an instruction for the next open, when the price may have changed.
The book generally favors selling or reducing a flat or losing position before earnings; a meaningful cushion can justify holding. Our rule is stricter: exit every remaining share below a 10% cushion at the open of the last safe session, based on the previous close. A before-open release uses the preceding trading session; an after-close release uses report-day open. The schedule must already have been known at the decision cutoff.
Before revealing the results, decide what you would do with a fast winner. Would you bank half, protect the rest and accept missing some upside? Would a small cushion justify holding through earnings? Write the share count and exit instruction before opening the outcome.
Open the revised trade outcomes and $1 million account comparison
What the dated decisions produce
Daily prices give us a marked date, not a broker fill. Conditional entries retain the prior-close contraction triggers and stops from the individual stories. A long enters at the trigger if reached, or at a higher opening gap; the short mirrors that convention. A plan rejected by the loss ceiling stays rejected.
The table’s OHLC4 is (open + high + low + close) ÷ 4. It is a descriptive average known only after the session, not VWAP or an executable order price. The archive contains no intraday transactions from which to calculate genuine session VWAP. OHLC4 does not fund these portfolios.
Stock prices below use revised split/dividend-adjusted archive units, with TSP’s as-traded exception. They are not literal 2021 broker quotes or actual historical share quantities. These notional units keep the price-path arithmetic consistent.
| Marked date / case | OHLC4 reference | Fill / initial stop | Initial stock loss | Shares / account weight | Max favorable stock move while held | Whole-trade return | Whole-trade P&L |
|---|---|---|---|---|---|---|---|
| TSP · 2021-06-08 | $42.12 | $39.48 / $37.93 | -3.93% | 5,598 / 20.00% | +15.88% | +3.93% | $8,676.90 |
| MRNA · 2021-06-25 | $221.01 | $224.58 / $205.54 | -8.48% | 732 / 14.74% | +121.52% | +46.45% | $76,367.74 |
| SKY · 2021-07-30 | $56.21 | $56.08 / $53.14 | -5.24% | 4,237 / 20.00% | +3.12% | +2.48% | $5,889.43 |
| PAG · 2021-09-01 | $79.72 | $80.04 / $76.82 | -4.02% | 3,100 / 20.00% | +0.88% | -4.02% | −$9,985.97 |
| ASYS · 2021-10-26 | $12.13 | $12.18 / $11.47 | -5.83% | 20,912 / 20.00% | +29.56% | +10.55% | $26,871.92 |
| NVDA · 2021-12-03 · short | $31.10 | $30.73 / $33.28 | -8.30% | 6,404 / 15.06% | +11.70% | -0.94% | −$1,851.94 |
These are the progressive account’s own allocations and partial-sale results. A trade’s percentage return uses its original position value as the denominator; its dollar P&L determines the account effect. The initial-stop loss describes planned stock risk, not a guaranteed maximum loss.
The maximum favorable stock move is observed while some shares remain. It is not the account’s peak open profit: earlier sales have already reduced the number of shares participating.
TuSimple shows why the bar ordering matters. The primary mixed route sells half at 2R and stops the remainder at entry on the marked day, producing +3.93%. Under uniform low-before-high ordering, the low precedes entry and the remaining shares survive into the later advance, producing +39.34%. Daily data cannot identify which route occurred.
Tesla illustrates the longer sequence under the primary policy: half sells at 2R, a further half of the remainder follows a rapid run, and the last shares sell after abnormal price/volume weakness. After the second trim, the runner is about one quarter of the original position.
| Route | Case | Date | Shares | Assumed price | Instruction |
|---|---|---|---|---|---|
| Primary mixed | TSP | 2021-06-08 | 5,598 | $39.48 | entry |
| Primary mixed | TSP | 2021-06-08 | 2,799 | $42.58 | half sold into strength at 2R |
| Primary mixed | TSP | 2021-06-08 | 2,799 | $39.48 | profit-protection stop |
| Primary mixed | TSLA | 2021-09-24 | 486 | $252.74 | entry |
| Primary mixed | TSLA | 2021-10-13 | 243 | $271.28 | half sold into strength at 2R |
| Primary mixed | TSLA | 2021-10-26 | 121 | $341.56 | rapid-run half-of-remainder trim (next open) |
| Primary mixed | TSLA | 2021-11-03 | 122 | $392.44 | sell runner after abnormal price/volume weakness (next open) |
| Primary mixed | ASYS | 2021-10-26 | 20,912 | $12.18 | entry |
| Primary mixed | ASYS | 2021-10-28 | 10,456 | $13.60 | half sold into strength at 2R |
| Primary mixed | ASYS | 2021-10-29 | 5,228 | $14.66 | rapid-run half-of-remainder trim (next open) |
| Primary mixed | ASYS | 2021-11-18 | 5,228 | $12.00 | gap through active stop |
| Primary mixed | NVDA | 2021-12-03 | 6,404 | $30.73 | entry |
| Primary mixed | NVDA | 2021-12-16 | 6,404 | $31.02 | gap through active stop |
| Long low→high | TSP | 2021-06-08 | 5,790 | $39.48 | entry |
| Long low→high | TSP | 2021-06-08 | 2,895 | $42.58 | half sold into strength at 2R |
| Long low→high | TSP | 2021-07-01 | 1,447 | $71.51 | rapid-run half-of-remainder trim (next open) |
| Long low→high | TSP | 2021-07-02 | 1,448 | $63.38 | sell runner after abnormal price/volume weakness (next open) |
Amtech is an earnings-risk example. Its remaining position had a large cushion before the report and was retained. It then gapped below the profit stop. Earlier sales kept the whole trade profitable even though the final shares lost money against entry.
NVIDIA is the harder exception. After an unrealized gain of 11.70%, its short position’s breakeven instruction is overtaken by the 2021-12-16 opening gap. The assumed cover at $31.02 against a $30.73 entry produces -0.94% on the trade, or −$1,851.94 before costs. Protecting a decent gain is a discipline we can encode; a guaranteed non-loss is not an execution assumption we can defend. A small initial open profit also does not mean a trade has already earned breakeven protection.
Check earnings before the report
| Ticker | Schedule known | Report / session | Decision open | Prior-close gain | Decision at cutoff | Shares through release |
|---|---|---|---|---|---|---|
| STAA | 2021-02-10 | 2021-02-24 · AMC | 2021-02-24 | +29.23% | retain at cutoff; stop still active | 293 |
| YETI | 2021-04-22 | 2021-05-13 · BMO | 2021-05-12 | +16.21% | retain at cutoff; stop still active | 0 |
| AAPL | 2021-06-30 | 2021-07-27 · AMC | 2021-07-27 | +13.82% | retain at cutoff; stop still active | 871 |
| SKY | 2021-07-13 | 2021-08-03 · AMC | 2021-08-03 | +2.35% | exit | 0 |
| MRNA | 2021-07-15 | 2021-08-05 · BMO | 2021-08-04 | +72.10% | retain at cutoff; stop still active | 183 |
| TSLA | 2021-10-08 | 2021-10-20 · AMC | 2021-10-20 | +13.99% | retain at cutoff; stop still active | 243 |
| OLN | 2021-09-22 | 2021-10-21 · AMC | 2021-10-21 | +2.66% | exit | 0 |
| ASYS | 2021-11-10 | 2021-11-17 · AMC | 2021-11-17 | +26.68% | retain at cutoff; stop still active | 5,228 |
The policy closes Skyline Champion and Olin with small gains before their reports. The dates come from advance announcements: Skyline announced on July 13 that results would arrive after the August 3 close; Olin announced on September 22 that results would arrive after the October 21 close. Their conference calls took place later. Waiting for the call would have left the event exposure in place.
“Retain at cutoff” records the decision made before the last safe session. It does not promise the position survives that day. YETI subsequently hits its active profit stop and carries zero shares through the release; the final column distinguishes the instruction from the exposure actually retained.
The calendar audit covers every funded holding interval. Most schedules are issuer announcements or issuer-authored wire copies. Apple’s advance date uses contemporaneous reporting with an IR-calendar capture; the original dated issuer page is unavailable. Apple already has more than a 10% cushion at the cutoff, so omitting that calendar action changes no order. Advance dates not established for already-closed PAG and NUE positions remain unknown. NVIDIA’s next quarterly report is outside 2021. Actual release dates alone are never backdated into advance knowledge.
The account compounds through its position sizes
| New order | Prior-close equity | Step at order | Target allocation | Actual position value | Actual account weight | Initial risk dollars |
|---|---|---|---|---|---|---|
| ANF · 2021-01-04 | $1,000,000.00 | 1 of 3 | 5% | $49,941.90 | 4.99% | $3,124.35 |
| STAA · 2021-01-12 | $1,006,793.48 | 2 of 3 | 10% | $100,624.03 | 9.99% | $4,871.36 |
| MP · 2021-02-09 | $1,040,626.78 | 3 of 3 | 20% | $138,442.86 | 13.30% | $13,005.36 |
| TSP · 2021-06-08 | $1,105,115.89 | 3 of 3 | 20% | $221,009.04 | 20.00% | $8,676.90 |
| TSLA · 2021-09-24 | $1,229,920.33 | 2 of 3 | 10% | $122,831.64 | 9.99% | $4,505.22 |
| OLN · 2021-10-11 | $1,234,338.06 | 2 of 3 | 10% | $118,234.22 | 9.58% | $7,713.76 |
| UPST · 2021-10-12 | $1,233,373.14 | 2 of 3 | 10% | $123,291.60 | 10.00% | $7,471.41 |
| ASYS · 2021-10-26 | $1,273,546.39 | 3 of 3 | 20% | $254,708.16 | 20.00% | $14,847.52 |
The increasing dollar orders come from current equity and earned allocation steps. We introduce no extra entry, pyramid, re-entry or averaging-down date absent from the 22 marked cases. Minervini’s published approach permits additions to successful positions; this collection does not document their actual timing or size.
In the primary sample, 12 of 18 funded orders use the 20% target step. Following the PAG loss on 2021-09-03, reduced 10% targets apply to TSLA, OLN, UPST. The full step is re-earned on 2021-10-13, with TSLA and UPST currently working. The older Apple runner’s earlier sale cannot restore it alone.
We repeat the same sell policy with allocation budgets tied to the original $1 million. That fixed-dollar comparison still respects current cash and risk constraints. It does not reinvest a growing balance into larger target orders. Whole-share rounding and cash constraints can also affect the difference.
Daily OHLC does not reveal the intraday route. Our primary mixed route places the favorable extreme before the adverse extreme on an intraday-trigger entry bar, allowing a reversal after entry. Once a position is owned from the open, it visits the adverse extreme first. Two sensitivities use uniform low→high or high→low ordering for longs; shorts mirror those routes. A low before a long entry can favor the buyer, while the same ordering can hurt a position already owned. No route is a proven worst-case bound. The primary mixed route returns +30.48%; across the three declared orderings, current-equity returns span +29.55% to +44.07%, a 14.52-percentage-point spread. These are sensitivity scenarios, not confidence limits.
| Model | Year-end equity | 2021 return | Maximum closing drawdown | Average gross exposure |
|---|---|---|---|---|
| Current-equity sizing · mixed route (primary) | $1,304,759.96 | +30.48% | 2.14% | 10.23% |
| Fixed-dollar sizing · mixed route | $1,271,979.03 | +27.20% | 1.71% | 9.19% |
| Current-equity sizing · long low→high / short high→low | $1,440,681.43 | +44.07% | 2.18% | 11.84% |
| Current-equity sizing · long high→low / short low→high | $1,295,483.32 | +29.55% | 1.66% | 9.73% |
| Current-equity sizing · mixed route, 10 bp each side | $1,298,309.59 | +29.83% | 2.16% | 10.23% |
| SPY · adjusted-close reference | $1,287,287.60 | +28.73% | 5.11% | 100% |
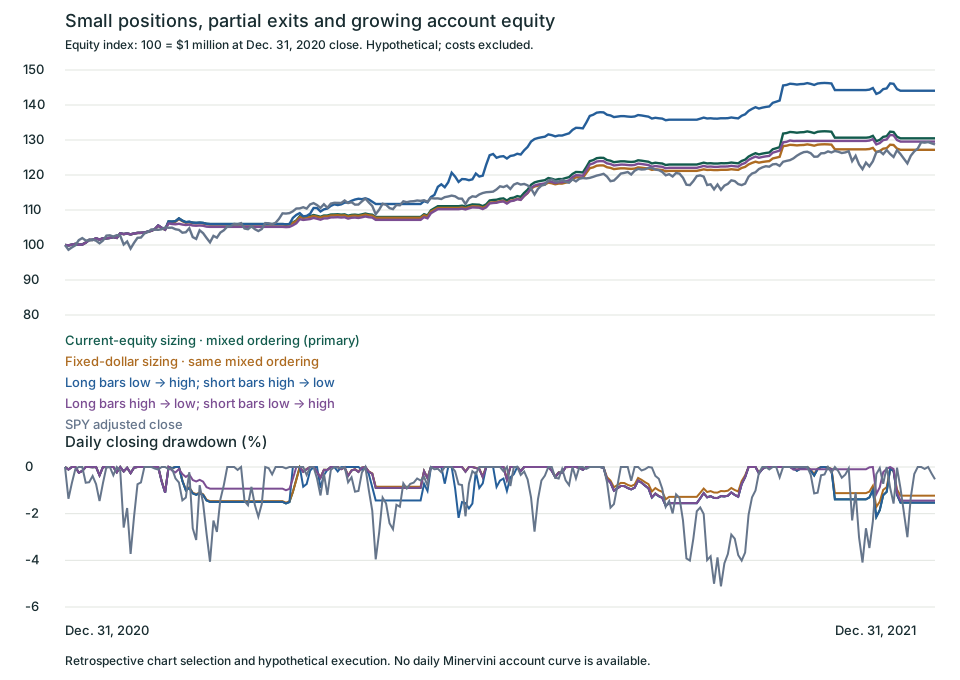
On the primary mixed route, current-equity sizing adds $304,759.96, versus $271,979.03 with fixed-dollar budgets: a difference of $32,780.94. All positions are closed by December 16 in all five runs; the year-end balances contain no open trade marks. This measures the sizing convention’s effect in this selected run. It does not explain a championship account’s full compounding or establish a likely future return.
The largest initial allocation is 20.00% of current equity; the largest closing single-name weight is 20.77%. Gross exposure peaks at 37.35% and averages 10.23%, compared with a fully invested SPY reference. The small closing drawdown reflects idle cash, selected successful charts and assumed profit exits together. It cannot be credited to progressive exposure alone. Appreciation can push a holding above its entry weight without another purchase.
Charging 10 basis points at every entry and exit on the primary mixed route reduces the return to +29.83%, with $6,326.46 in direct charges. Costs also slightly alter subsequent equity and whole-share quantities. The charge is an explicit stress assumption. Taxes, interest, borrow charges, liquidity and market impact are excluded. The NVIDIA short reserves initial-notional collateral, reuses no short-sale proceeds and assumes borrow availability. Short-side adaptations are study conventions.
MRNA alone contributes 7.64 percentage points of the primary account’s return. Repeating the mixed-route simulation while omitting each of the 18 funded examples in turn gives returns from +22.27% to +36.66%; later allocations and feedback are recomputed each time. In 10 of those omissions, the model finishes below SPY. Removing one example still leaves a retrospectively chosen sample. These scenarios are not an independent test of the whole method.
The monthly record remains separate evidence
| 2021 month | Reported reference | SPY | Current equity · mixed | Fixed dollars · mixed | Current equity · long low→high | Current equity · long high→low |
|---|---|---|---|---|---|---|
| 2021-01 | +19.97% | -1.02% | +3.04% | +3.03% | +3.04% | +3.04% |
| 2021-02 | +31.26% | +2.78% | +3.17% | +3.07% | +3.17% | +2.39% |
| 2021-03 | +34.19% | +4.54% | -0.31% | -0.31% | -0.31% | -0.31% |
| 2021-04 | +31.58% | +5.29% | +2.25% | +2.12% | +5.79% | +2.25% |
| 2021-05 | +1.62% | +0.66% | -0.33% | -0.32% | -0.36% | -0.33% |
| 2021-06 | +14.38% | +2.24% | +4.50% | +4.11% | +12.78% | +4.50% |
| 2021-07 | +0.99% | +2.44% | +5.54% | +4.99% | +4.44% | +5.54% |
| 2021-08 | +10.07% | +2.98% | +4.17% | +3.62% | +4.11% | +4.17% |
| 2021-09 | +5.80% | -4.66% | -0.66% | -0.55% | -0.66% | -0.66% |
| 2021-10 | +9.26% | +7.02% | +7.07% | +5.73% | +7.07% | +5.84% |
| 2021-11 | +3.23% | -0.80% | -1.00% | -0.80% | -1.00% | +0.20% |
| 2021-12 | +2.27% | +4.62% | -0.14% | -0.11% | -0.14% | -0.14% |
The owner-supplied monthly reference compounds to +338.422427%. Its separate cumulative row reports +338.42%, while the organizer reports +334.8%. The account basis and 3.62-percentage-point annual discrepancy remain unresolved. Monthly observations cannot establish daily or intraday account drawdown. None of these reported figures determines a model parameter, trade exit or size.
The revised account still does not reproduce the monthly reference. The reference’s large January–April gains require decisions beyond these small early commitments. The model has losing months where the reference reports gains. March, May and November have no new marked entries, although carried positions can change equity. Missing additions, exits, re-entries and other trades cannot be supplied by increasing a bet until the totals agree.
For the requested market comparison, we group daily returns by the previous close’s provisional AlpharvestPro Market Compass headline. These reconstructed labels are descriptive and never place or size an order.
| Prior-close provisional headline | Sessions | SPY compounded on these sessions | Current-equity sizing · mixed route |
|---|---|---|---|
| Confirmed Uptrend | 153 | +5.89% | +20.81% |
| Uptrend Under Pressure | 67 | +2.17% | +4.76% |
| Market in Correction | 32 | +18.99% | +3.09% |
The grouped uptrend sessions show the intended upside comparison. SPY’s large rebound on sessions labeled Market in Correction shows why the labels need caution. Returns compound across sometimes disconnected sessions; they are not the return or drawdown of a separate timing strategy. They cannot establish Minervini’s actual market exposure.
Inspect all 22 marked dates, estimated entries, sizes and outcomes
| Marked date / ticker | OHLC4 | Conditional price / initial stop | Planned stock loss | Shares / position value / weight | Final exit | Whole-trade return | Whole-trade P&L | Scenario status |
|---|---|---|---|---|---|---|---|---|
| 2021-01-04 · ANF | $20.62 | $20.94 / $19.63 | -6.26% | 2,385 / $49,941.90 / 4.99% | 2021-01-27 · $23.03 | +11.26% | $5,621.18 | taken |
| 2021-01-11 · GM | $42.16 | $42.16 / $40.11 | -4.86% | 1,187 / $50,043.92 / 5.00% | 2021-01-26 · $51.17 | +17.17% | $8,593.92 | taken |
| 2021-01-12 · STAA | $86.57 | $85.93 / $81.77 | -4.84% | 1,171 / $100,624.03 / 9.99% | 2021-03-04 · $92.88 | +17.51% | $17,615.82 | taken |
| 2021-01-20 · NNOX | $52.71 | $55.88 / $49.49 · unfilled trigger | -11.44% | — | — | — | — | not triggered |
| 2021-02-09 · MP | $34.04 | $34.49 / $31.25 | -9.39% | 4,014 / $138,442.86 / 13.30% | 2021-02-23 · $37.94 | +20.26% | $28,052.81 | taken |
| 2021-02-09 · UAVS | $12.98 | $12.90 / $10.70 | -17.05% | — | — | — | — | stop too wide |
| 2021-04-05 · GBOX | $14.96 | $14.26 / $12.74 | -10.66% | — | — | — | — | stop too wide |
| 2021-04-06 · YETI | $75.23 | $75.32 / $71.91 | -4.53% | 2,814 / $211,950.48 / 20.00% | 2021-05-12 · $82.85 | +9.53% | $20,193.26 | taken |
| 2021-04-08 · ZIM | $7.01 | $6.83 / $6.20 | -9.22% | 21,027 / $143,614.41 / 13.55% | 2021-04-08 · $6.83 | +0.00% | $0.00 | taken |
| 2021-06-02 · BNTX | $209.92 | $207.07 / $190.74 | -7.89% | 826 / $171,039.82 / 15.84% | 2021-06-08 · $227.78 | +12.89% | $22,040.57 | taken |
| 2021-06-04 · HSKA | — | — / — | — | — | — | — | — | missing prices |
| 2021-06-08 · TSP | $42.12 | $39.48 / $37.93 | -3.93% | 5,598 / $221,009.04 / 20.00% | 2021-06-08 · $39.48 | +3.93% | $8,676.90 | taken |
| 2021-06-17 · AAPL | $127.53 | $127.49 / $123.75 | -2.93% | 1,742 / $222,087.58 / 19.99% | 2021-09-13 · $146.92 | +10.55% | $23,438.77 | taken |
| 2021-06-25 · MRNA | $221.01 | $224.58 / $205.54 | -8.48% | 732 / $164,392.56 / 14.74% | 2021-08-11 · $443.57 | +46.45% | $76,367.74 | taken |
| 2021-07-30 · SKY | $56.21 | $56.08 / $53.14 | -5.24% | 4,237 / $237,610.97 / 20.00% | 2021-08-03 · $57.47 | +2.48% | $5,889.43 | taken |
| 2021-08-09 · NUE | $98.06 | $98.80 / $93.88 | -4.98% | 2,443 / $241,368.40 / 19.99% | 2021-08-19 · $108.13 | +9.70% | $23,415.91 | taken |
| 2021-09-01 · PAG | $79.72 | $80.04 / $76.82 | -4.02% | 3,100 / $248,127.97 / 20.00% | 2021-09-03 · $76.82 | -4.02% | −$9,985.97 | taken |
| 2021-09-24 · TSLA | $253.30 | $252.74 / $243.47 | -3.67% | 486 / $122,831.64 / 9.99% | 2021-11-03 · $392.44 | +26.29% | $32,296.65 | taken |
| 2021-10-11 · OLN | $44.82 | $45.37 / $42.41 | -6.52% | 2,606 / $118,234.22 / 9.58% | 2021-10-21 · $46.38 | +2.22% | $2,629.80 | taken |
| 2021-10-12 · UPST | $324.43 | $323.60 / $303.99 | -6.06% | 381 / $123,291.60 / 10.00% | 2021-10-20 · $355.96 | +12.08% | $14,893.21 | taken |
| 2021-10-26 · ASYS | $12.13 | $12.18 / $11.47 | -5.83% | 20,912 / $254,708.16 / 20.00% | 2021-11-18 · $12.00 | +10.55% | $26,871.92 | taken |
| 2021-12-03 · NVDA · short | $31.10 | $30.73 / $33.28 | -8.30% | 6,404 / $196,794.92 / 15.06% | 2021-12-16 · $31.02 | -0.94% | −$1,851.94 | taken |
A blank result remains unknown or ineligible, rather than a zero return. HSKA lacks numerical prices. NNOX never reaches its trigger and its 11.44% planned stop distance would also exceed the 10% ceiling; UAVS and GBOX exceed that ceiling. All 18 qualifying examples are funded in the revised primary scenario. Returns combine all partial exits. Displayed values are rounded; calculations use unrounded inputs. Whole-share half sales leave an odd share with the runner.
The same candidates can produce very different account gains
Finding the same stocks on the same dates would not, by itself, reproduce a championship return. The capital committed during each profitable move matters. For a single full-position trade, with other capital idle and identical entry and exit prices, a 20% stock gain contributes about 1% to an account carrying a 5% pilot, or 4% to an account carrying a 20% position, before costs. Both investors found the winner; they participated with different amounts of capital.
This is the offensive side of progressive exposure. Section 5 of Think & Trade Like a Champion describes building on successful commitments and using profits to finance further risk. In his 2018 interview, Minervini likewise explains that early profits can support more aggressive positions. An investor who remains at pilot size after gaining traction can capture fewer dollars from subsequent winning opportunities. A smaller retained profit then leaves a smaller equity base for the next order.
Two decisions reinforce each other: earning a larger allocation percentage, and applying that percentage to a growing account. The arithmetic below isolates the second decision. Every row uses a 20% allocation, a full-position exit at a hypothetical 20% gain without intermediate sales, and a 5% initial stop. The portfolio model’s partial-sale rules do not apply to this separate illustration. Other capital is idle, costs and gaps are excluded, and the balances are illustrations rather than observations of Minervini’s account.
| Account equity | 20% position value | Profit on a 20% stock gain | Planned loss at a 5% stock stop |
|---|---|---|---|
| $1,000,000 | $200,000 | $40,000 · 4% of equity | $10,000 · 1% of equity |
| $2,000,000 | $400,000 | $80,000 · 4% of equity | $20,000 · 1% of equity |
| $3,000,000 | $600,000 | $120,000 · 4% of equity | $30,000 · 1% of equity |
The dollar profit can grow without increasing the planned fraction of equity at risk. At a constant allocation, the percentage contribution to current equity stays the same; it compounds because that percentage acts on a larger balance. Larger profits become part of the next capital base; larger dollar orders then participate in later advances. Realized sales can also release cash for subsequent qualified opportunities. This combination of earned exposure, reinvestment and capital turnover offers a plausible mechanism for exceptional account growth. Here, greater aggression means committing earned capital when trades are working. Borrowed margin is a separate decision: we do not have the financing record needed to attribute his 2021 result to borrowing.
A slower investor can therefore lag substantially when the larger allocations coincide with profitable trades, even with the same candidates and decision dates. The reverse can happen during losses. Minervini’s interview also allows time for pilot positions to prove themselves; a few weeks spent earning exposure need not make a large difference. Remaining undercommitted after traction and testing the market patiently are different choices.
Our fixed-dollar versus current-equity comparison measures reinvestment under the same allocation-step schedule; it does not test faster against slower promotion. The primary model already reaches its full target step on January 12, yet averages only 10.23% gross exposure over the year. Sparse marked entries, partial sales, stop-constrained sizing and the absence of documented additions contribute to substantial idle cash. We cannot establish that its step-up schedule was slower than Minervini’s, or explain the championship gap simply by calling its sizing too cautious.
The useful conclusion is that a ticker list is only one part of a trading record. To explain the scale of his championship gain, we would also need the sizes, additions, exits, reinvestment and turnover of the complete account. More effective deployment of retained profits could be part of that explanation; this collection cannot quantify the contribution. Increasing our assumed bets until the annual return matches would not supply the missing decisions.
What the journey leaves us with
A strong company earns investigation. A constructive base defines an opportunity. The entry-to-failure distance limits the affordable position. An advancing stock earns protection, and successful commitments can earn more exposure. The next order grows in dollars as the account’s capital grows.
Recognizing the same leaders is only part of the task. The speed of earned exposure, the growing equity behind each order and the reuse of capital can make two investors’ results diverge substantially. Staying small through a profitable campaign can slow account growth; stepping up before traction can magnify losses.
Minervini’s discussion of selling into strength and weakness gives us ways to bank gains while retaining a runner. This exercise does not isolate their advantage over a moving-average-only exit. Gaps remain, early sales surrender upside, and an earnings cushion can disappear. A written rule makes those tradeoffs reviewable; it does not remove them.
These retrospectively selected examples favor successful stock advances. At only 9.73–11.84% average gross exposure, the three current-equity scenarios return +29.55% to +44.07%, with 1.66–2.18% maximum daily closing drawdown. SPY returns +28.73% with 5.11% closing drawdown. The primary mixed route’s +30.48% return exceeds SPY by 1.75 percentage points before costs. Idle cash and selected charts help explain the smaller drawdown; this does not verify Minervini’s daily drawdown or explain his annual total. Intraday drawdown may be larger.
For the next AlpharvestPro review, reopen one decision view before revealing later bars. Write the trigger, stop, current account equity, permitted shares, profit-taking condition and next earnings date from an issuer source. The reconstructed RS, Trend Template and VCP context can organize that research. These app readings were not produced live in 2021, and this series does not measure a preset’s success rate.
A closing remark
Minervini’s 2021 result gives this journey its destination. The repeatable work lies in the decisions: start small, increase commitment when earned, protect a meaningful advance and let retained profits enlarge the next appropriately sized order.
“That the Future May Learn from the Past” ends with a note worth writing beside the next chart: How much of today’s capital does this evidence justify, and what will I sell if that evidence changes?
Reading and calculation notes
Mark Minervini, Think & Trade Like a Champion, Sections 3 and 5 (profit protection, progressive exposure and earnings), 8 (position sizing) and 9 (strength, weakness and partial sales); Trade Like a Stock Market Wizard, Chapter 3 (SEPA). His official website was checked; it does not publish a complete executable rulebook. The book and first-person interviews support the exposure principles; two authenticated 2021 X posts support the risk discipline, and the dated 2025 posts provide a later exposure example. Social mirrors supplied discovery leads only; X’s official public embed and widget responses verified the cited authorship and content.
Prices are frozen case exports through December 31, 2021, with preceding history for averages. Except for separately sourced as-traded TSP and disclosed UAVS/GBOX unit conversions, prices use revised split/dividend-adjusted archive units, not literal 2021 broker quotes. Whole shares in these units form a notional price-path model; actual share counts, dividend cash flows and a brokerage statement are not reconstructed. SPY uses adjusted closes from the same archive.
Case dates and contraction windows were selected retrospectively. Conditional fills assume the specified price is obtainable on a continuous assumed intraday path, with adverse opening gaps at the worse open. Opening-gap order resizing is idealized; actual execution and slippage can differ. No broker confirmations, complete competition ledger or daily account equity curve is available. The private evidence bundle preserves the calendar, policy, every fill, daily cash and equity, sizing decisions and review findings.
AlpharvestPro wrote and published this independent research journal. AlpharvestPro is not affiliated with or endorsed by Mark Minervini.

