
Mark Minervini 2021: A Research Journal
Read the journey
December 3, 2021 · The final case is a short. NVIDIA still had an AlpharvestPro RS of 99 and sat on all three trend presets, so this story reads the trade as a call on a market-wide climax and reversal, and tests that reading against the evidence at the cutoff.
Most short setups start with a broken stock. This one did not. On December 2 NVIDIA still had the profile of a leader; what had changed was the market around it. We read this short as a call on the whole market: a climax reversal at the top of the late-2021 advance, taken through one of the leaders that had run hardest into it. The sources do not record Minervini’s reason for the trade, so the question for this story is whether the evidence at the cutoff supported a market-level short, and what NVIDIA’s own chart added to it.
We stop at December 2 and open AlpharvestPro’s replay of that close. Prices are the archive’s revised split-adjusted units.
What AlpharvestPro’s replay shows at the Dec. 2 close
AlpharvestPro’s history archive replays today’s presets, relative strength and Market Compass over 2020–2021 prices. It uses the current stock roster, so it carries survivorship bias. NVDA is here because it is one of Minervini’s 2021 setups, not because the app selected it. The replay shows how AlpharvestPro’s tools read the chart at the cutoff, not what any screen displayed in 2021 or what Minervini used.
| At the Dec. 2 close | AlpharvestPro replay |
|---|---|
| AlpharvestPro Market Compass (provisional) | Market in Correction since Nov. 30, when the NYSE Composite closed below its 200-day average. All five tracked indexes rose that day, and the Dow, NYSE Composite and Russell closed below their 50-day averages; the Russell closed below its 200-day average. |
| AlpharvestPro RS (reconstructed, current roster) | 99. Earlier readings: 93 on Nov. 3 (20 sessions before), 91 on Sept. 2 (63 sessions) and 82 on June 4 (126 sessions); its range over the last 63 sessions was 75–99. |
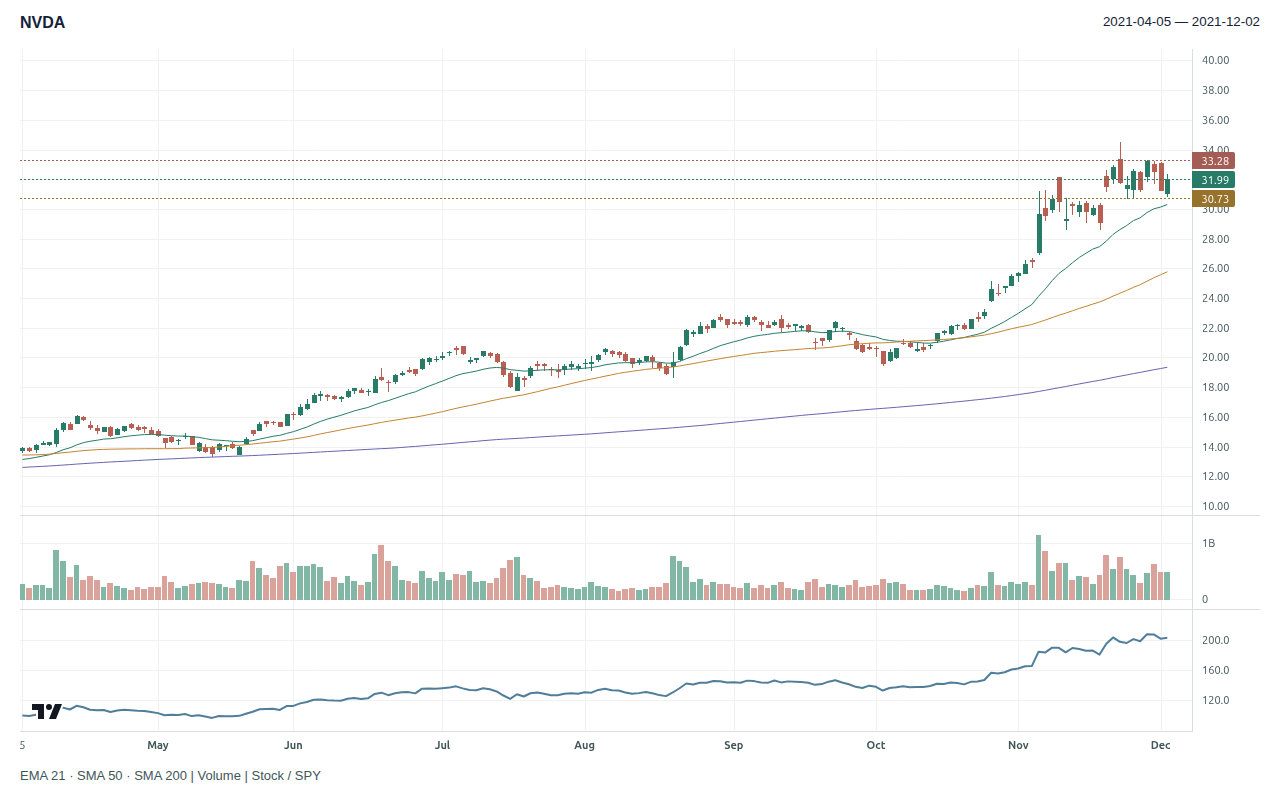
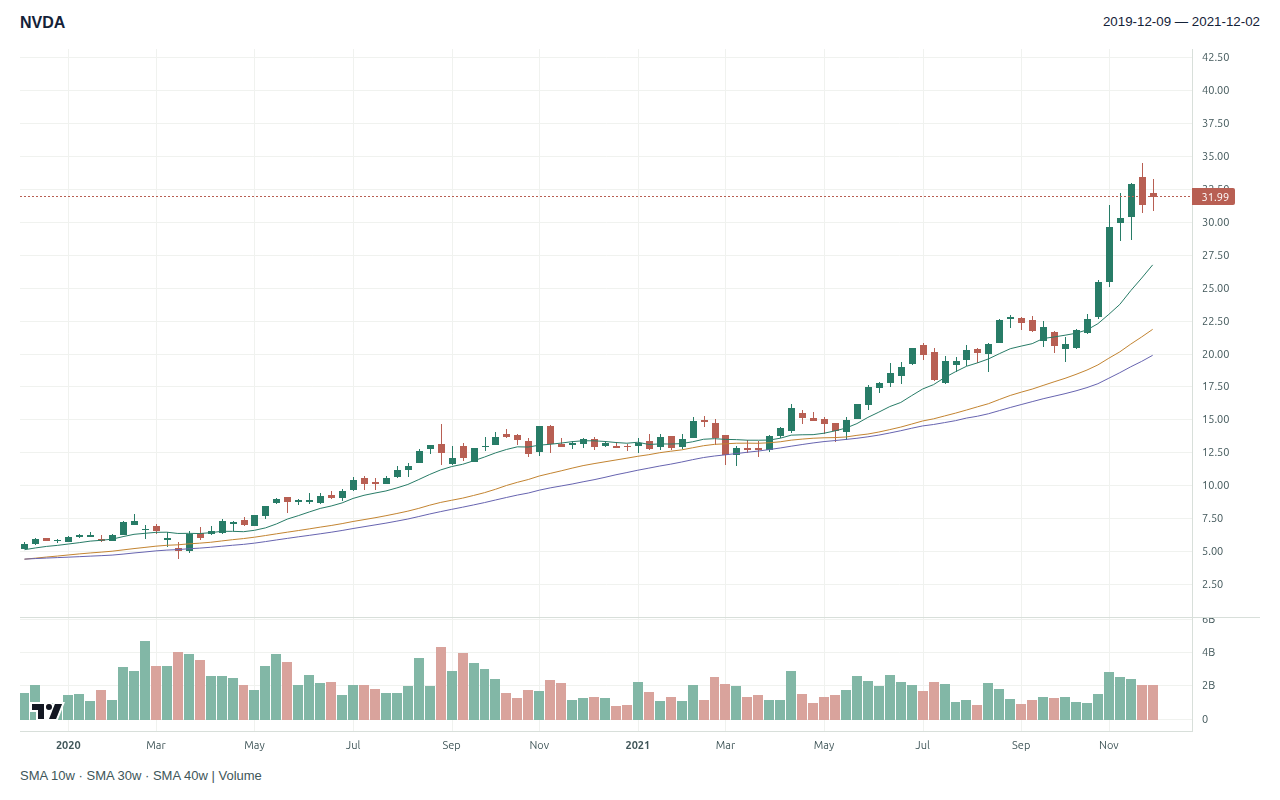
| Price and averages | $31.99, above the 50-day average of $25.77 and above the 200-day average of $19.34. It closed 7.3% below its 52-week high of $34.50 on Nov. 22. |
| AlpharvestPro presets in the week before Dec. 3 | Five sessions, Nov. 26 to Dec. 2: AlpharvestPro Near 52-Week High, every session; AlpharvestPro RS Leaders, every session; AlpharvestPro Trend Template, every session; AlpharvestPro Breakout Setup, on Nov. 29; AlpharvestPro 4% Breakout, on Nov. 29. These replays agree closely with the live app, except 4% Breakout, which agrees moderately. |
| AlpharvestPro presets the stock was on | AlpharvestPro RS Leaders, every session since June 2; AlpharvestPro Trend Template, every session since May 14; AlpharvestPro Near 52-Week High, every session since Oct. 13. All three replays agree closely with the live app. |
| AlpharvestPro early-Stage-2 check | Not passed, on three conditions: it stood far above its 150-day average, the stock had already advanced far above its base low and its 52-week high was too recent for the check. |
| Industry peers | Semiconductors: the two largest companies by today’s market value that traded then; the choice uses today’s knowledge, the readings do not. Taiwan Semiconductor Manufacturing Company Ltd. (TSM): RS 61; on no preset the replay relies on; 13.4% below its 52-week high, above its 50-day average; up 1% over three months. Broadcom Inc. (AVGO): RS 85; on AlpharvestPro RS Leaders, Trend Template and Near 52-Week High; 4.3% below its 52-week high, above its 50-day average; up 13% over three months. NVDA’s RS of 99 was above both. |
The week before December 3 shows how one-sided the replay still was: AlpharvestPro Breakout Setup and AlpharvestPro 4% Breakout both listed NVDA on November 29, when it rose 5.9%.
The replay’s leadership readings still called NVIDIA a leader: RS 99, all three trend presets, and a price 24% above its 50-day average. None of AlpharvestPro’s four short-setup presets listed NVIDIA in the five sessions before December 3. That is what a market-climax short would look like in the replay. Each short preset looks for a topping or breakdown pattern in the stock’s own chart, and NVIDIA had not broken down. The thesis sits in the market reading instead. AlpharvestPro Market Compass had moved into correction on November 30, two sessions before the cutoff, and three of the five tracked indexes sat below their 50-day averages.
The broader market had topped first. The NYSE Composite, the Dow and the Russell 2000 had set their highest closes of the year so far on November 8, the S&P 500 on November 18 and the Nasdaq Composite on November 19. On November 22 the Nasdaq Composite traded up to a record 16,212 and then closed at 15,855, below the previous session’s close. By December 2 it stood 4.2% below its November 19 record close, and the Russell 2000 was 9.7% below its November 8 close.
NVIDIA’s own chart showed the climax. From its October 4 low of $19.47 it rose 77% to the November 22 high in 35 sessions. That included a 12.0% gain on November 4 on 4.73 times its average volume, its largest one-day gain of the past year. On November 22, the day of the Nasdaq’s record high, NVDA opened above the previous close, reached a high of $34.50 and then closed at $31.82, 7.8% below that high, on 2.34 times its average volume. It closed 3.1% below the previous session. The days that followed were choppy rather than quiet: the up days of November 24 and 29 came on above-average volume, and the down days of November 30 and December 1 on heavier volume still.
Agreement with the live app is the replay’s median daily overlap with the live AlpharvestPro app’s stored preset results from July 7 to November 6, 2026. A preset with low agreement is shown when it appears, but it is not relied on.
Prior-close market and screening context · 2021-12-02
| SPY adjusted close | +0.95% versus its 50-session average |
| VIX close | 27.95 |
| AlpharvestPro RS (reconstructed) | 99 · current stored roster, not a 2021 published ranking |
| AlpharvestPro Market Compass (provisional) | Market in Correction |
| AlpharvestPro presets (33 of 36; 3 left out for near-zero agreement) | 3 of 25 evaluated at close or moderate agreement listed the stock; 0 of 8 at low agreement, shown but not relied on; 0 could not be evaluated |
Retrospective context. Compass headlines and preset membership have unresolved validation limits; distribution-day counts and broad breadth classifications are withheld. No screen output proves a historical order or full SEPA qualification.
Start with Minervini’s short-side explanation
In Momentum Masters, question S2-10, Minervini describes generally operating long or in cash, while considering shorts in bear markets or when tops form and leaders break down. After a major break, he sometimes looks for a low-volume rally and enters as selling resumes with stronger downside volume.
The December 3 short is closest to the top-forming part of that description, although NVIDIA itself had not broken down; it does not match the post-break sequence. NVIDIA had made no major break: the price remained well above the 50-day line, and the rally after the November 22 reversal was not on low volume. Read as a market call, the short came early, on the market’s climax and the leader’s reversal, before any breakdown in the stock itself. That is why AlpharvestPro’s short presets had nothing to say. It is also why the stop matters more than usual: a leader still far above its 50-day line can rally hard against an early short.
The company’s November 17 release reported revenue of $7.10 billion, up 50% year over year and 9% sequentially. GAAP diluted EPS was $0.97, up 83% year over year. Those results did not demonstrate a deteriorating operating business. On our reading, the thesis was the market’s, not the company’s.
| Question | Evidence at December 2 | Assessment |
|---|---|---|
| Long trend | AlpharvestPro RS 99; on AlpharvestPro RS Leaders, Trend Template and Near 52-Week High; 24% above the 50-day line. | Strong; not evidence for a short |
| Fundamentals | Nov. 17: rising revenue and EPS. | Operating deterioration unsupported |
| Market | NYSE Composite, Dow and Russell 2000 highest closes on Nov. 8; Nasdaq Composite record high and reversal on Nov. 22; AlpharvestPro Market Compass in correction since Nov. 30. | Market-wide climax reversal: the thesis, on our reading |
| The leader’s climax | Up 77% from the Oct. 4 low in 35 sessions; largest one-day gain of the past year on Nov. 4; Nov. 22 reversal on 2.34 times average volume. | Climax run and reversal |
| AlpharvestPro short presets | None of the four listed NVDA in the week before Dec. 3. | No stock-level breakdown, as expected for a market call |
| Entry sequence | No major break of the 50-day line; post-reversal rally on above-average volume; actual trigger unknown. | Early short, before a breakdown |
| Cover and risk plan | No authenticated stop, borrow, position size, or cover. | Unknown |
The loss limit sits above the entry
The plan follows the structure of a short. After the November 22 reversal, NVIDIA traded between $30.74 and $33.27 from November 23 to December 2. As a teaching convention, the plan borrows Minervini’s resumed-selling entry (Momentum Masters, S2-10), so the trigger sits one cent below that range’s low, at $30.73, and the stop one cent above its high, at $33.28. The $2.55 distance, 8.30%, is inside his 10% ceiling and permits 156 shares under the $400 illustration. The $4,793.88 figure is initial short notional, not cash committed or a margin requirement.
| Teaching calculation | Archive-adjusted units |
|---|---|
| Final contraction | 2021-11-23 to 2021-12-02 |
| Illustrative account / risk budget | $40,000 / $400 (1%) |
| Conditional trigger / stop | $30.73 / $33.28 |
| Risk per share / distance | $2.55 / 8.30%, within Minervini’s 10% ceiling |
| Whole shares / planned stop loss | 156 / $397.80 |
| Initial short notional / account ratio | $4,793.88 / 11.98% |
A teaching calculation with fixed conventions of our own: trigger 1¢ beyond the final contraction’s high (low for a short) and stop 1¢ beyond its other side, read from bars up to the cutoff, sized so the loss at the stop stays within $400. The 10% ceiling is Minervini’s: “keep your losses to 10 percent or less” (Think & Trade Like a Champion).
Before any actual order, borrow availability, borrowing cost, margin terms, and the possibility of a forced close would need to be established. The SEC’s short-sale bulletin explains the asymmetric risk: the stock can keep rising, and a stop does not guarantee a capped loss through a gap.
A plausible tactical plan would require renewed weakness through the selected trigger, cover on invalidation, and reassess if the stock quickly recovered. A trader applying a slower topping framework could simply pass until the breakdown was more developed.
Your decision: is a market-wide climax reversal enough reason to short the market’s strongest leader before its own chart breaks down, and at what price does the short stop being right?
Reveal NVIDIA through December 31, 2021
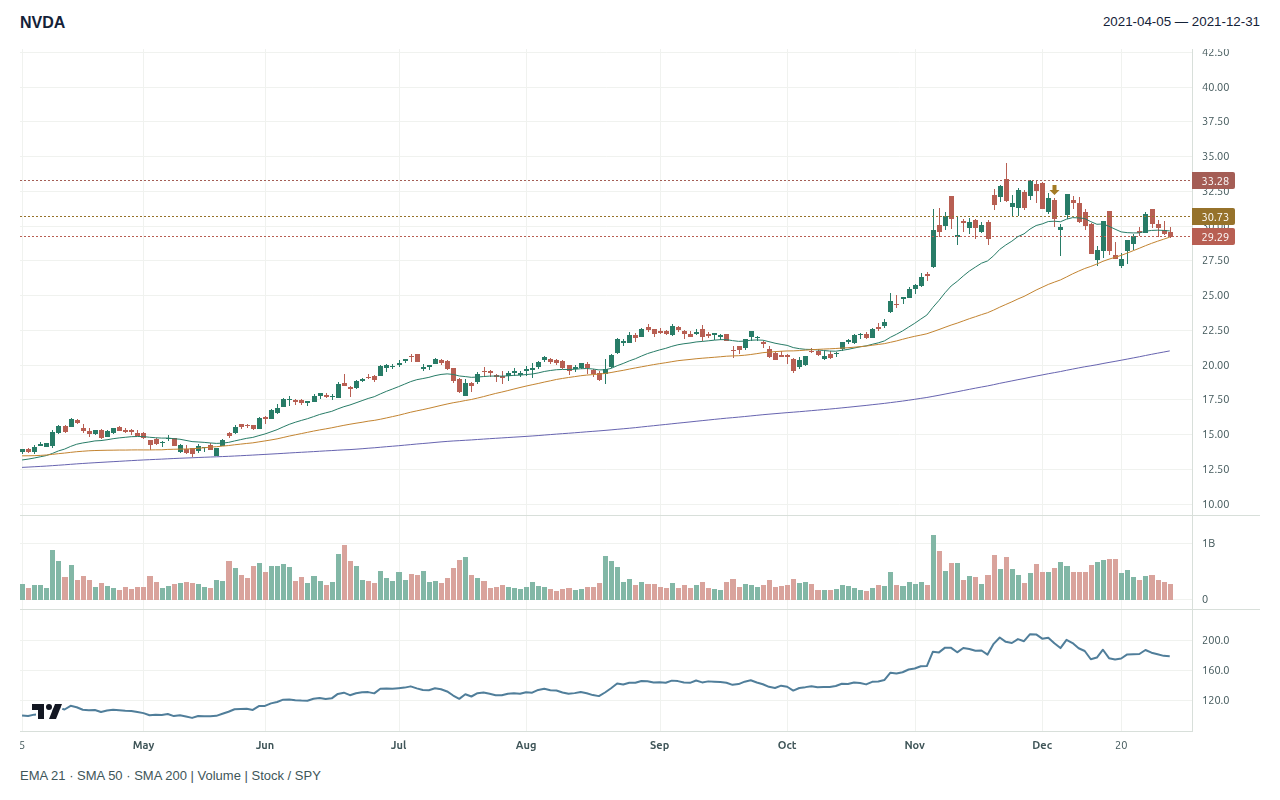
December 3 closed near $30.56 on the revised adjusted basis. A rebound reached about $32.31 on December 7; the later December 20 low was around $27.03. The year ended at $29.29.
The market reading held through year-end where the climax had been: the Nasdaq Composite, the NYSE Composite and the Russell 2000 did not close above their November closing highs again in 2021. The S&P 500 and the Dow did, setting new closing highs on December 29. In a post on January 27, 2022, Minervini wrote that his most recent sell signal had been issued to his members on November 22, 2021, the day of the Nasdaq’s reversal; a year later he wrote: “On Nov. 22, 2021, I warned my clients of a major top” (X, January 8, 2023). In May 2022 he called NVIDIA’s 2021 advance “a classic late stage blow off”. None of these posts describes his NVDA order, stop or cover, or says why he shorted NVIDIA.
AlpharvestPro at the December 3 close. The S&P 500 fell 0.84%; AlpharvestPro Market Compass read Market in Correction. NVDA’s AlpharvestPro RS stayed at 99. The replay added AlpharvestPro Holy Grail Pullback, whose replay agrees poorly with the live app. It dropped AlpharvestPro Near 52-Week High. NVDA fell 4.5% on 1.49 times its average daily volume over the previous 50 sessions.
The rebound matters to a short seller even though the stock later traded lower. These bars do not identify Minervini’s cover, any partial covers, or his net outcome after borrowing costs. We stop the plotted outcome at December 31, so a later 2022 decline cannot be quietly counted as a 2021 competition profit.
| Hypothetical exit scenario | Through December 31, 2021 |
|---|---|
| Entry | 2021-12-03 at $30.73 |
| Initial stop | $33.28 |
| Stop changes | none |
| Exit | 2021-12-31 at $29.29 (still open; marked at the 2021-12-31 close) |
| Result | +4.70% · +0.57 R · +$225.33 on 156 shares |
Fixed rules adapted from Minervini’s guidance in Think & Trade Like a Champion: the initial stop; the stop to breakeven once the price has moved three times the risk; and, once the 50-day average reaches the entry, an exit on a close beyond it (“breakeven or better”). Selling into strength is not modelled. Our conventions: a stop change takes effect from the next session; an exit on a close is valued at that close; an entry that opens past the trigger is resized to keep the $400 risk. Daily bars cannot show the order of moves within a day. R is the initial risk per share. A teaching scenario, not Minervini’s trade; no costs, borrow or slippage.
The journey ends with the same discipline it began with: identify the actual setup, state the evidence against it, and define failure before imagining the result. Read this way, the setup was the market’s climax, not a broken chart. AlpharvestPro’s long-side tools and its short presets both describe the stock, and AlpharvestPro Market Compass carries the thesis. A short like this needs that market evidence written down, and a stop above the entry that respects how hard a leader can rally.
Sources: Minervini, Think & Trade Like a Champion (exit-scenario rules); Minervini’s response in Momentum Masters, S2-10; Minervini’s posts on X dated January 27, 2022, May 11, 2022 and January 8, 2023; NVIDIA release dated November 17, 2021 (figures also in its Form 8-K exhibit); SEC short-sale education. Index highs and closes: AlpharvestPro history archive. Chart, RS, presets and Market Compass: AlpharvestPro history archive replay; prices incorporate later split/dividend revisions. The short direction comes from the setup under review, and the market-climax thesis from our reading of it with Minervini’s dated sell signal; his posts do not describe an NVDA order. Actual orders, borrow, stops, and realized returns remain unverified.
AlpharvestPro wrote and published this independent research journal. AlpharvestPro is not affiliated with or endorsed by Mark Minervini.

