
Mark Minervini 2021: A Research Journal
Read the journey
July 30, 2021 · The housing story and quieter volume were visible. The completed shape of the entry-day candle was not.
A historical review can point to any finished candle and call it an ideal entry. A trader buying during that session did not yet know where the candle would close. SKY makes that timing problem visible.
Our cutoff is July 29, and we open AlpharvestPro’s replay of that close.
What AlpharvestPro’s replay shows at the July 29 close
AlpharvestPro’s history archive replays today’s presets, relative strength and Market Compass over 2020–2021 prices. It uses the current stock roster, so it carries survivorship bias. SKY is here because it is one of Minervini’s 2021 setups, not because the app selected it. The replay shows how AlpharvestPro’s tools read the chart at the cutoff, not what any screen displayed in 2021 or what Minervini used.
| At the July 29 close | AlpharvestPro replay |
|---|---|
| AlpharvestPro Market Compass (provisional) | Confirmed Uptrend since the S&P 500’s July 23 follow-through day. All five tracked indexes rose that day, and the Russell closed below its 50-day average. |
| AlpharvestPro RS (reconstructed, current roster) | 90. Earlier readings: 85 on June 30 (20 sessions before), 78 on April 29 (63 sessions) and 52 on Jan. 28 (126 sessions); its range over the last 63 sessions was 51–91. |
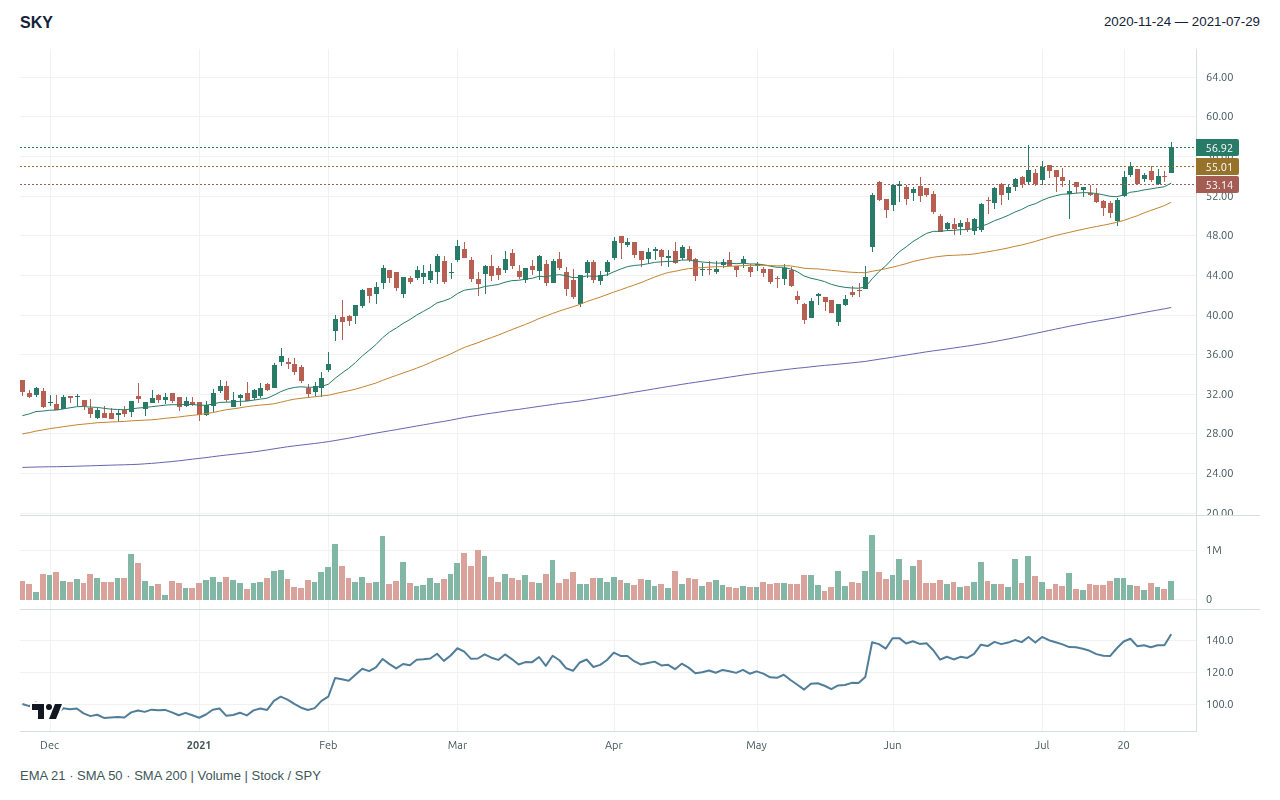
| Price and averages | $56.92, above the 50-day average of $51.33 and above the 200-day average of $40.72. It closed 0.8% below its 52-week high of $57.40 on July 29. |
| AlpharvestPro presets in the week before July 30 | Five sessions, July 23 to July 29: AlpharvestPro Near 52-Week High, every session; AlpharvestPro RS Leaders, every session; AlpharvestPro Trend Template, every session; AlpharvestPro AVWAP Pullback Watch, on July 26, July 27, July 28 and July 29; AlpharvestPro VDU Pullback Watch, on July 23 and July 26; AlpharvestPro 4% Breakout, on July 29. These replays agree closely with the live app, except VDU Pullback Watch and 4% Breakout, which agree moderately. Also shown, but not relied on because its replay agrees poorly with the live app: AlpharvestPro NR7 Squeeze, on July 23. |
| AlpharvestPro presets the stock was on | AlpharvestPro RS Leaders, every session since May 26; AlpharvestPro Trend Template, every session since Nov. 11, 2020; AlpharvestPro Near 52-Week High, every session since July 19; AlpharvestPro AVWAP Pullback Watch, every session since July 26; AlpharvestPro 4% Breakout, every session since July 29. The RS Leaders, Trend Template, Near 52-Week High and AVWAP Pullback Watch replays agree closely with the live app. The 4% Breakout replay agrees moderately. |
| AlpharvestPro early-Stage-2 check | Not passed, on three conditions: its 150-day average had been rising for longer than an early-stage advance, the stock had already advanced far above its base low and its 52-week high was too recent for the check. |
| Industry peers | Residential Construction: the two largest companies by today’s market value that traded then; the choice uses today’s knowledge, the readings do not. D.R. Horton, Inc. (DHI): RS 53; on AlpharvestPro Trend Template; 10.7% below its 52-week high, above its 50-day average; down 6% over three months. PulteGroup, Inc. (PHM): RS 41; on AlpharvestPro Trend Template and 4% Breakout; 13.6% below its 52-week high, above its 50-day average; down 8% over three months. SKY’s RS of 90 was above both. |
In the week before July 30, the replay tracked the recovery step by step: AlpharvestPro VDU Pullback Watch listed SKY on July 23 and 26, AlpharvestPro AVWAP Pullback Watch from July 26 through the cutoff, and AlpharvestPro 4% Breakout on July 29, the day it rose 5.5% to a new intraday high.
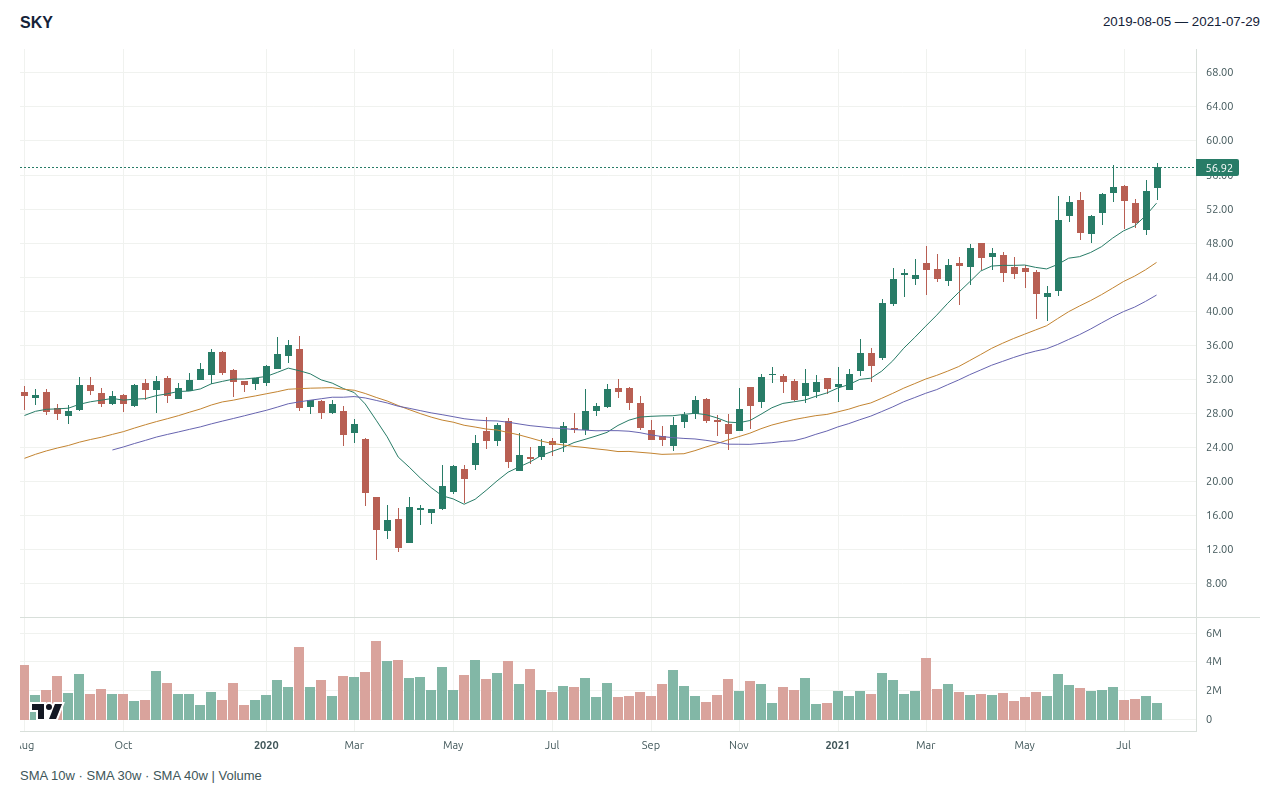
The market had only just come back. AlpharvestPro Market Compass marked a correction on July 19, when the S&P 500 undercut its rally low, and confirmed a new uptrend four sessions later. SKY used that shakeout: from its June 29 high of $57.07 it fell about 14% to $49.01 on July 19, recovered within days, and on July 29 rose 5.5% to an intraday 52-week high of $57.40 before closing at $56.92, just under the June high.
The rank was rising into the move: AlpharvestPro RS went from 52 in January to 90, and the stock had been an AlpharvestPro RS Leader since late May. Average volume over the final five sessions was about 64% of the trailing 50-session average, consistent with quieter recent activity. The final prior-session high-to-low range was still about 5.61%, however, so the cutoff chart was not uniformly quiet.
Agreement with the live app is the replay’s median daily overlap with the live AlpharvestPro app’s stored preset results from July 7 to November 6, 2026. A preset with low agreement is shown when it appears, but it is not relied on.
Prior-close market and screening context · 2021-07-29
| SPY adjusted close | +3.38% versus its 50-session average |
| VIX close | 17.70 |
| AlpharvestPro RS (reconstructed) | 90 · current stored roster, not a 2021 published ranking |
| AlpharvestPro Market Compass (provisional) | Confirmed Uptrend |
| AlpharvestPro presets (33 of 36; 3 left out for near-zero agreement) | 5 of 25 evaluated at close or moderate agreement listed the stock; 0 of 8 at low agreement, shown but not relied on; 0 could not be evaluated |
Retrospective context. Compass headlines and preset membership have unresolved validation limits; distribution-day counts and broad breadth classifications are withheld. No screen output proves a historical order or full SEPA qualification.
The operating backdrop
The May 25 results announcement reported fiscal fourth-quarter sales of $447.6 million, up 48.6%, and net income of $33.9 million. Diluted EPS was $0.59 versus $0.11. Backlog and U.S. home shipments also increased. The quarter included an extra week relative to the comparison period.
Those facts supported demand and earnings improvement while preserving the calendar qualification. An unfilled gap or a quiet pullback can be consistent with limited selling, but a daily chart does not identify the institutions behind each transaction. We should describe the behavior before assigning an actor or intention.
| SEPA element | Evidence at July 29 | Assessment |
|---|---|---|
| Trend | AlpharvestPro RS 90 and rising; on AlpharvestPro RS Leaders, Trend Template and Near 52-Week High; new uptrend confirmed July 23. | Supported |
| Fundamentals | May 25: sales, earnings, and backlog improved; extra-week comparison. | Supported with comparison limit |
| Catalyst | Housing-demand and production evidence already public; next quarterly results not yet released. | Supported context; exact trade motive unknown |
| Entry | Lower recent average volume, but a wide July 29 range; later July 30 candle unavailable at cutoff. | Conditional, not uniformly tight |
| Exit | No documented stop or sale. | Unknown |
Two entry ideas should remain distinct
The teaching plan uses Minervini’s structure with our own fixed conventions. SKY traded in a tight, low-volume area from July 22 to 28, between $53.15 and $55.00, before the July 29 move. The trigger sits one cent above that area, at $55.01, and the stop one cent below it, at $53.14. A 3.40% distance, inside Minervini’s 10% ceiling, permits 213 shares in the $400 risk illustration. The catch is timing: July 29 had already closed at $56.92, 3.5% above the trigger. Minervini’s guidance is to buy “as close to the pivot point as possible without chasing the stock up more than a few percentage points” (Trade Like a Stock Market Wizard).
| Teaching calculation | Archive-adjusted units |
|---|---|
| Final contraction | 2021-07-22 to 2021-07-28 |
| Illustrative account / risk budget | $40,000 / $400 (1%) |
| Conditional trigger / stop | $55.01 / $53.14 |
| Risk per share / distance | $1.87 / 3.40%, within Minervini’s 10% ceiling |
| Whole shares / planned stop loss | 213 / $398.31 |
| Position value / account exposure | $11,717.13 / 29.29% |
A teaching calculation with fixed conventions of our own: trigger 1¢ beyond the final contraction’s high (low for a short) and stop 1¢ beyond its other side, read from bars up to the cutoff, sized so the loss at the stop stays within $400. The 10% ceiling is Minervini’s: “keep your losses to 10 percent or less” (Think & Trade Like a Champion).
A conditional plan would wait for the chosen trigger, recalculate after a large gap, and keep the original loss limit. It would also check the next earnings date before taking exposure. Nothing about the July 30 candle was information available on July 29.
Your decision: would you buy on July 30 a few percent above the pivot, with a wider real risk, or wait for a new structure?
Reveal the SKY entry day and later path
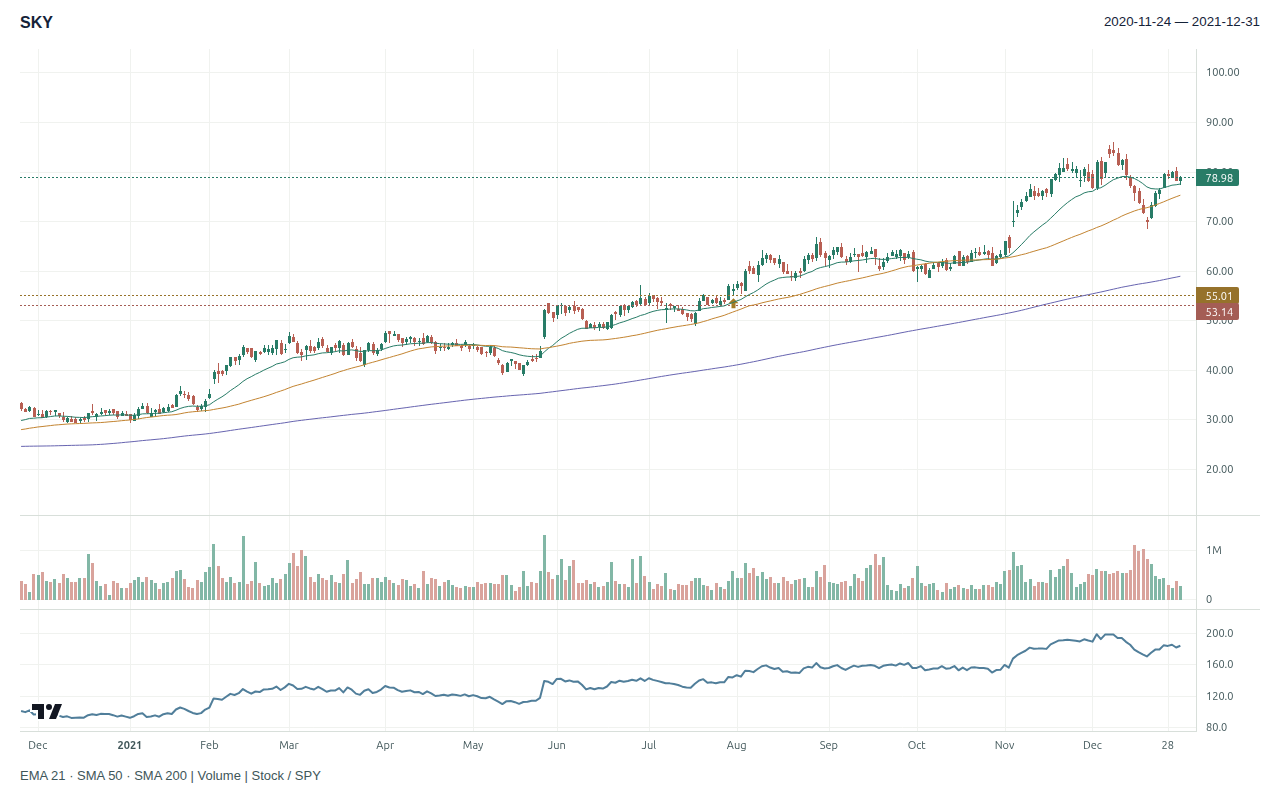
July 30 opened at $56.08, 1.9% above the $55.01 trigger, reached $57.29 and closed at $56.40. The exit scenario below therefore buys at the open, where the risk to the stop is 5.2% rather than the planned 3.40%, and recalculates the order from 213 to 136 shares so that a loss at the stop stays within the $400 budget, as the plan requires. Minervini’s actual order on the date is unverified.
AlpharvestPro at the July 30 close. The S&P 500 fell 0.54%; AlpharvestPro Market Compass read Confirmed Uptrend. SKY’s AlpharvestPro RS stayed at 90. It dropped AlpharvestPro AVWAP Pullback Watch and AlpharvestPro 4% Breakout. SKY fell 0.9% on 1.42 times its average daily volume over the previous 50 sessions.
A new earnings release arrived August 3, after the cutoff. SKY subsequently reached $85.92 on December 8 and ended the year at $78.98. The later operating release and price advance belong in the outcome review, not in the pre-entry evidence.
| Hypothetical exit scenario | Through December 31, 2021 |
|---|---|
| Entry | 2021-07-30 at $56.08 (the open, past the trigger; resized from 213 to 136 shares so the initial risk, $399.84, stays within $400) |
| Initial stop | $53.14 |
| Stop changes | 2021-08-27: stop raised to breakeven; 2021-08-27: 50-day average reached the entry |
| Exit | 2021-09-30 at $60.06 (close below the 50-day average) |
| Result | +7.10% · +1.35 R · +$541.28 on 136 shares |
Fixed rules adapted from Minervini’s guidance in Think & Trade Like a Champion: the initial stop; the stop to breakeven once the price has moved three times the risk; and, once the 50-day average reaches the entry, an exit on a close beyond it (“breakeven or better”). Selling into strength is not modelled. Our conventions: a stop change takes effect from the next session; an exit on a close is valued at that close; an entry that opens past the trigger is resized to keep the $400 risk. Daily bars cannot show the order of moves within a day. R is the initial risk per share. A teaching scenario, not Minervini’s trade; no costs, borrow or slippage.
SKY’s lesson is to separate a completed candle from a tradable intraday decision. When a stock lands on AlpharvestPro’s 4% Breakout preset the day before, note that the preset describes a finished session, not the next one. State the trigger and the information cutoff precisely; then let the chart reveal whether that particular plan could have acted.
Sources: Skyline Champion releases, May 25 and August 3, 2021 (May figures also in its Form 8-K exhibit); Minervini, Trade Like a Stock Market Wizard, Chapters 3 and 10. Chart, RS, presets and Market Compass: AlpharvestPro history archive replay; volume ratios and ranges are calculated only from prior archive bars. Actual fills and trade results remain unknown; a high RS rank does not verify an all-time-high RS line.
AlpharvestPro wrote and published this independent research journal. AlpharvestPro is not affiliated with or endorsed by Mark Minervini.

