
Mark Minervini 2021: A Research Journal
Read the journey
June 25, 2021 · Moderna’s business had changed dramatically. The entry exercise asks whether a compact pattern description matched the risk on the daily chart.
A smaller pattern inside a larger base can be an attractive idea: it promises a nearby pivot within a strong underlying trend. The label can also make a volatile stock sound calmer than its daily ranges really are.
Our cutoff is June 24, and we open AlpharvestPro’s replay of that close.
What AlpharvestPro’s replay shows at the June 24 close
AlpharvestPro’s history archive replays today’s presets, relative strength and Market Compass over 2020–2021 prices. It uses the current stock roster, so it carries survivorship bias. MRNA is here because it is one of Minervini’s 2021 setups, not because the app selected it. The replay shows how AlpharvestPro’s tools read the chart at the cutoff, not what any screen displayed in 2021 or what Minervini used.
| At the June 24 close | AlpharvestPro replay |
|---|---|
| AlpharvestPro Market Compass (provisional) | Confirmed Uptrend. The uptrend had held since the S&P 500’s new 52-week closing high on March 11, with 34 sessions at Uptrend Under Pressure along the way, the latest on June 18. All five tracked indexes rose that day, and the Dow closed below its 50-day average; the S&P 500 and Nasdaq Composite closed at new highs. |
| AlpharvestPro RS (reconstructed, current roster) | 95. Earlier readings: 92 on May 26 (20 sessions before), 90 on March 25 (63 sessions) and 98 on Dec. 22, 2020 (126 sessions); its range over the last 63 sessions was 81–96. |
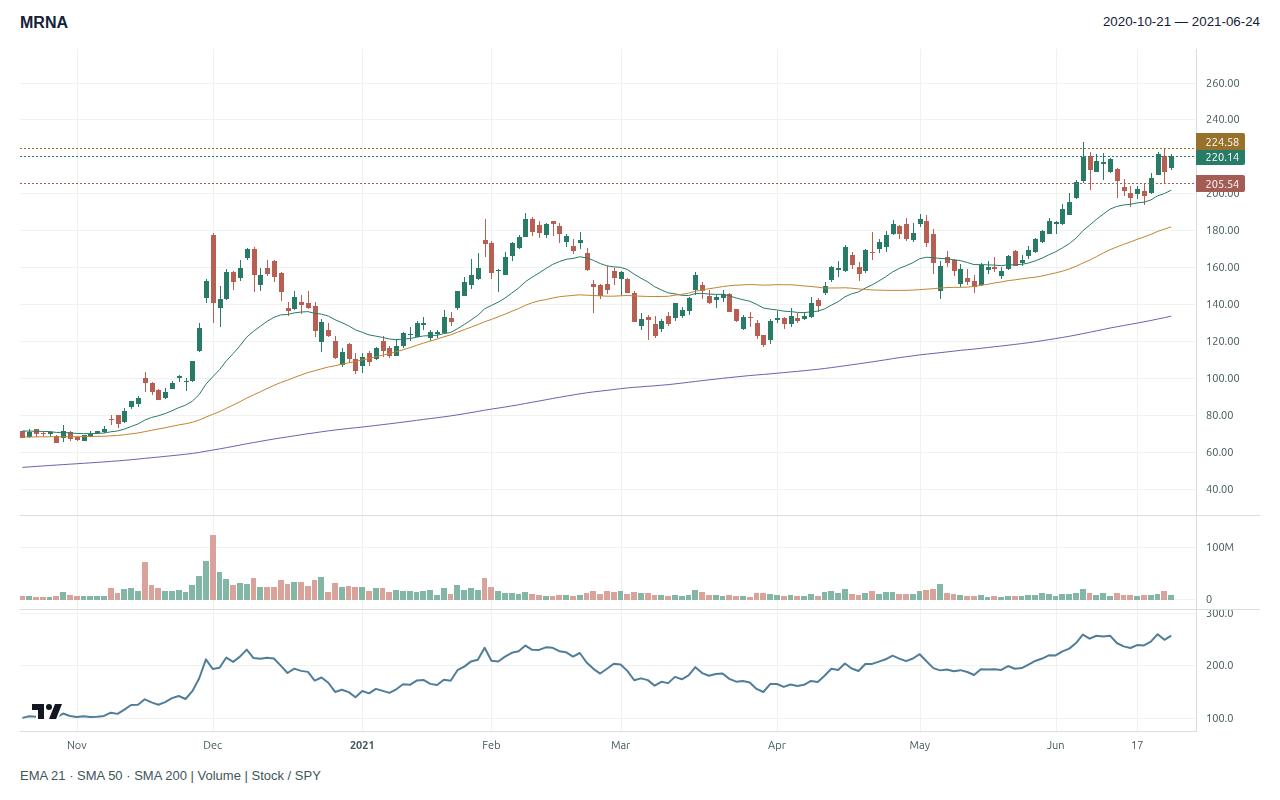
| Price and averages | $220.14, above the 50-day average of $181.90 and above the 200-day average of $133.62. It closed 3.3% below its 52-week high of $227.71 on June 7. |
| AlpharvestPro presets in the week before June 25 | Five sessions, June 18 to June 24: AlpharvestPro RS Leaders, every session; AlpharvestPro Trend Template, every session; AlpharvestPro Near 52-Week High, on June 21, June 22, June 23 and June 24; AlpharvestPro Breakout Setup, on June 22; AlpharvestPro VDU Pullback Watch, on June 21. These replays agree closely with the live app, except VDU Pullback Watch, which agrees moderately. |
| AlpharvestPro presets the stock was on | AlpharvestPro RS Leaders, every session since June 12, 2020; AlpharvestPro Trend Template, every session since June 12, 2020; AlpharvestPro Near 52-Week High, every session since June 21. All three replays agree closely with the live app. |
| AlpharvestPro early-Stage-2 check | Not passed, on two conditions: its 150-day average had been rising for longer than an early-stage advance and the stock had already advanced far above its base low. |
| Industry peers | COVID-19 vaccine developers, grouped by the vaccine rather than by industry. BioNTech SE (BNTX): RS 98; on AlpharvestPro RS Leaders, Trend Template, Near 52-Week High, COOL Leaders and VDU Pullback Watch; 9.9% below its 52-week high, above its 50-day average; up 139% over three months. Novavax, Inc. (NVAX): RS 80; on AlpharvestPro RS Leaders, Trend Template, Bear Flag Continuation, Head-and-Shoulders Top and Ichimoku Cloud Breakout; 42.0% below its 52-week high, above its 50-day average; up 8% over three months. MRNA’s RS of 95 was between them. |
In the week before June 25, AlpharvestPro Breakout Setup listed MRNA on June 22, the day it jumped 6.3%, and AlpharvestPro VDU Pullback Watch listed it on June 21, at moderate agreement. Neither was on the list at the June 24 close.
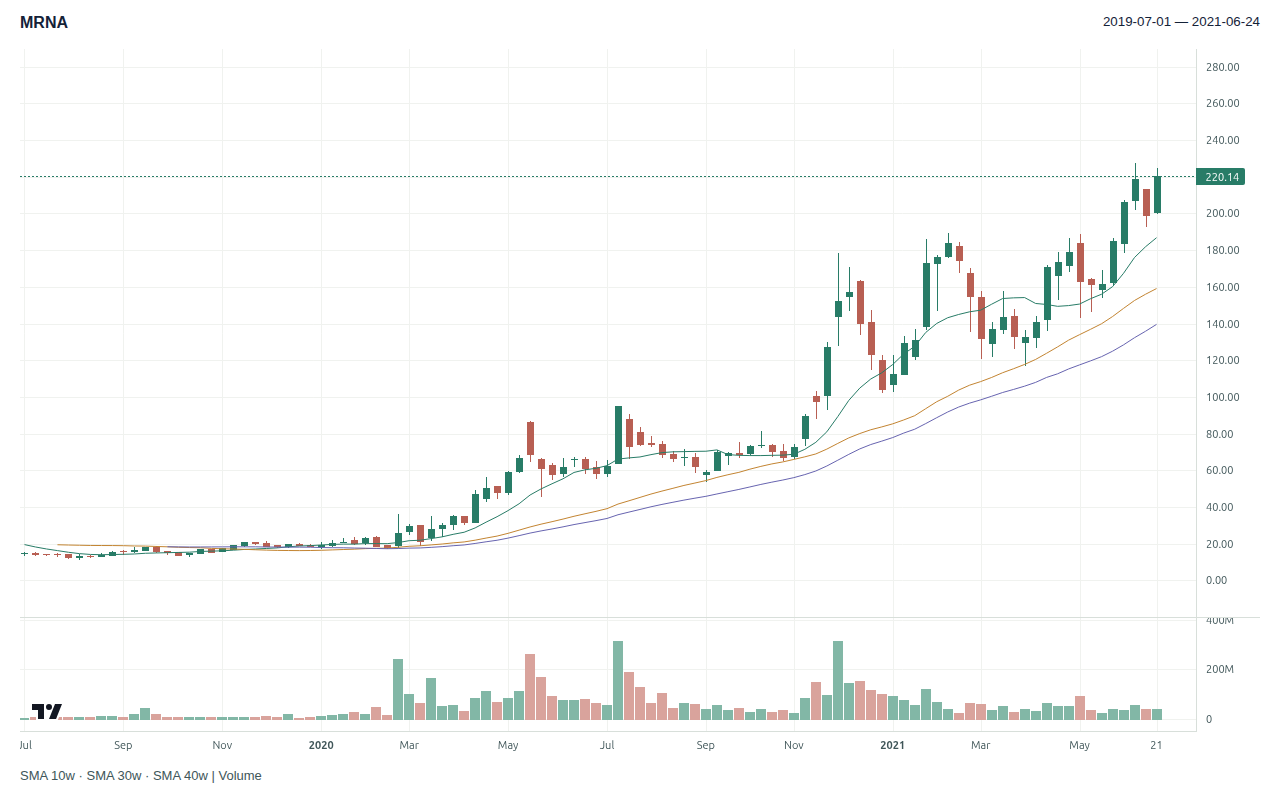
Moderna had been an AlpharvestPro RS Leader and on the AlpharvestPro Trend Template for a full year, and its RS stayed in the 80s and 90s throughout the spring. The chart’s short-term structure was rougher. From the June 7 high, MRNA fell about 15% to $193.20 on June 16, jumped 6.3% to $221.36 on June 22, swung between $205.55 and $224.57 on June 23, and closed at $220.14 on June 24. Daily ranges that wide push any stop under the structure far from the trigger.
Agreement with the live app is the replay’s median daily overlap with the live AlpharvestPro app’s stored preset results from July 7 to November 6, 2026. A preset with low agreement is shown when it appears, but it is not relied on.
Prior-close market and screening context · 2021-06-24
| SPY adjusted close | +1.94% versus its 50-session average |
| VIX close | 15.97 |
| AlpharvestPro RS (reconstructed) | 95 · current stored roster, not a 2021 published ranking |
| AlpharvestPro Market Compass (provisional) | Confirmed Uptrend |
| AlpharvestPro presets (33 of 36; 3 left out for near-zero agreement) | 3 of 25 evaluated at close or moderate agreement listed the stock; 0 of 8 at low agreement, shown but not relied on; 0 could not be evaluated |
Retrospective context. Compass headlines and preset membership have unresolved validation limits; distribution-day counts and broad breadth classifications are withheld. No screen output proves a historical order or full SEPA qualification.
The financial change was a turnaround
Moderna’s May 6 release reported approximately $1.9 billion in first-quarter revenue and the first GAAP-profitable quarter in its history. Diluted EPS was $2.84, compared with a $0.35 loss a year earlier. The company raised its 2021 supply forecast to 800 million to 1 billion doses and reported $19.2 billion of signed advance purchase agreements for 2021 delivery.
The negative prior-year EPS base makes “911% earnings growth” a poor substitute for the actual figures. The important observation is the transition from development-stage losses to substantial reported profits. Forecast deliveries still remained forecasts. In June the company also asked the FDA to authorize the vaccine for adolescents, a regulatory step with an outcome still pending at the cutoff.
The proposed chart reading is a VCP with a smaller cup-and-handle inside it. Minervini’s contraction framework asks for progressively less volatility and reduced supply near the pivot. To verify a particular three-contraction count, the swing boundaries would need to be specified. AlpharvestPro’s VCP Setup, now part of the replay, checked MRNA in each of the five sessions before June 25 and did not list it; it had last listed MRNA on June 1. The replay therefore does not support that interpretation, and the count remains a chart reading to verify.
| SEPA element | Evidence at June 24 | Assessment |
|---|---|---|
| Trend | AlpharvestPro RS 95; on AlpharvestPro RS Leaders and Trend Template for a year; extended from the 50-day line. | Strong trend with entry sensitivity |
| Fundamentals | May 6: first GAAP-profit quarter, EPS $2.84 versus a loss. | Supported transformation |
| Catalyst | Vaccine commercialization, increased supply forecast and adolescent filing already public. | Supported context; forecast and regulatory risk remain |
| Entry | Nested-pattern interpretation; five-session range still broad. | Conditional; exact contraction count unverified |
| Exit | No authenticated initial stop or sales. | Unknown |
The stop distance challenges the pattern description
The teaching plan uses Minervini’s structure with our own fixed conventions as far as this chart allows. The final three sessions, June 22 to 24, include the June 23 reversal: a high of $224.57, 1.4% below the June 7 high, and a low of $205.55. The trigger sits one cent above that area, at $224.58, and the stop one cent below it, at $205.54. That is $19.04 per share, or 8.48%, inside the 10% Minervini sets as his maximum loss. The example budget permits 21 shares and $4,716 of exposure.
| Teaching calculation | Archive-adjusted units |
|---|---|
| Final contraction | 2021-06-22 to 2021-06-24 |
| Illustrative account / risk budget | $40,000 / $400 (1%) |
| Conditional trigger / stop | $224.58 / $205.54 |
| Risk per share / distance | $19.04 / 8.48%, within Minervini’s 10% ceiling |
| Whole shares / planned stop loss | 21 / $399.84 |
| Position value / account exposure | $4,716.18 / 11.79% |
A teaching calculation with fixed conventions of our own: trigger 1¢ beyond the final contraction’s high (low for a short) and stop 1¢ beyond its other side, read from bars up to the cutoff, sized so the loss at the stop stays within $400. The 10% ceiling is Minervini’s: “keep your losses to 10 percent or less” (Think & Trade Like a Champion).
A trader reading a smaller handle inside that area might locate a tighter failure level. That possibility should be shown on the pre-entry chart, not assumed because “mini handle” sounds precise. Without one, the 8.48% stop is the honest width.
If entering, a controlled trigger, a binding initial loss limit, and a written response to a failed breakout would come first. If the trade works, the exit scenario in the reveal applies fixed rules adapted from Minervini’s guidance in Think & Trade Like a Champion: the stop moves to breakeven once the price has risen three times the risk, and once the 50-day average catches up with the entry, a close below it ends the trade. A vaccine headline could cause a gap that bypassed the planned stop.
Your decision: can you identify a genuine tighter invalidation level, or is the smaller position the honest consequence of this stock’s range?
Reveal the later Moderna chart
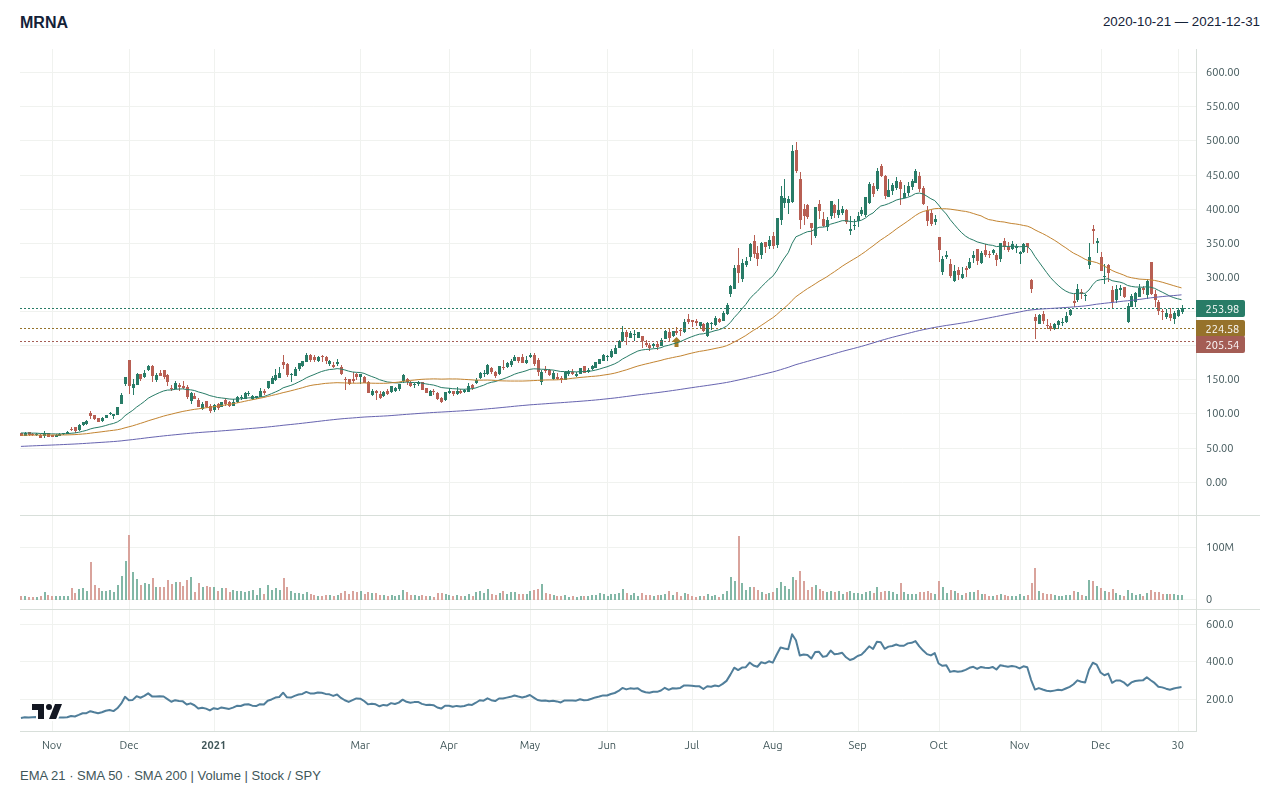
June 25 reached $226.51, through the $224.58 trigger, but closed at $219.94, below it. The later archive path reached $497.49 on August 10 and finished 2021 at $253.98.
AlpharvestPro at the June 25 close. The S&P 500 rose 0.33%; AlpharvestPro Market Compass read Confirmed Uptrend. MRNA’s AlpharvestPro RS rose to 96. Its preset list did not change. MRNA fell 0.1% on 1.35 times its average daily volume over the previous 50 sessions.
The large advance makes profit protection an obvious subject in retrospect. It cannot establish which pullbacks Minervini held, whether he took partial profits, or what he realized. The actual order and exit history remains an open question.
| Hypothetical exit scenario | Through December 31, 2021 |
|---|---|
| Entry | 2021-06-25 at $224.58 |
| Initial stop | $205.54 |
| Stop changes | 2021-07-16: stop raised to breakeven; 2021-07-27: 50-day average reached the entry |
| Exit | 2021-09-28 at $384.21 (close below the 50-day average) |
| Result | +71.08% · +8.38 R · +$3,352.23 on 21 shares |
Fixed rules adapted from Minervini’s guidance in Think & Trade Like a Champion: the initial stop; the stop to breakeven once the price has moved three times the risk; and, once the 50-day average reaches the entry, an exit on a close beyond it (“breakeven or better”). Selling into strength is not modelled. Our conventions: a stop change takes effect from the next session; an exit on a close is valued at that close; an entry that opens past the trigger is resized to keep the $400 risk. Daily bars cannot show the order of moves within a day. R is the initial risk per share. A teaching scenario, not Minervini’s trade; no costs, borrow or slippage.
MRNA’s lesson is to let the measured failure distance challenge the pattern’s name. A year on AlpharvestPro’s RS Leaders preset says the stock is a leader; it does not say today’s entry is tight. Write the pivot and invalidation first, and decide whether the pattern still looks attractive after the share count appears.
Sources: Moderna release, May 6, 2021; adolescent filing as reported June 10, 2021; Minervini, Trade Like a Stock Market Wizard, Chapters 3 and 10. Chart, RS, presets and Market Compass: AlpharvestPro history archive replay. No actual entry, stop, sale, or realized result is supplied.
AlpharvestPro wrote and published this independent research journal. AlpharvestPro is not affiliated with or endorsed by Mark Minervini.

