
Mark Minervini 2021: A Research Journal
Read the journey
June 8, 2021 · An exciting new listing was not automatically an entry. The proposed edge came from waiting for a structure to form.
The first day of a new listing supplies a price and a story. It does not necessarily supply a base. TuSimple’s June case asks whether patience after an IPO can create a more useful decision than participation in the opening excitement.
TuSimple’s May 10 shareholder letter identifies April 15 as the IPO date. June 8 arrived roughly eight weeks later. Our decision cutoff is June 7, and we open AlpharvestPro’s replay of that close. TuSimple is not in the archive’s current roster, so its prices come from another source’s history, as traded; the source is named after the reveal.
What AlpharvestPro’s replay shows at the June 7 close
AlpharvestPro’s history archive replays today’s presets, relative strength and Market Compass over 2020–2021 prices. It uses the current stock roster, so it carries survivorship bias. TSP is here because it is one of Minervini’s 2021 setups, not because the app selected it. The replay shows how AlpharvestPro’s tools read the chart at the cutoff, not what any screen displayed in 2021 or what Minervini used.
| At the June 7 close | AlpharvestPro replay |
|---|---|
| AlpharvestPro Market Compass (provisional) | Uptrend Under Pressure since May 10, inside an uptrend that had held since the S&P 500’s new 52-week closing high on March 11. The tracked indexes were mixed that day, but all five closed above their 50- and 200-day averages; the NYSE Composite closed at a new high. |
| AlpharvestPro RS (reconstructed, current roster) | No reading. TSP is not in the archive’s stock roster, and its 37 sessions were fewer than AlpharvestPro’s RS ranking needs anyway. |
| Price and averages | $38.83. There was not yet enough history for a 50-day or 200-day average. |
| AlpharvestPro presets the stock was on | No readings. Outside the archive’s roster, every preset is unknown, not failed. |
| Industry peers | Trucking: the two largest companies by today’s market value that traded then; the choice uses today’s knowledge, the readings do not. Old Dominion Freight Line, Inc. (ODFL): RS 56; on AlpharvestPro Trend Template; 7.8% below its 52-week high, below its 50-day average; up 16% over three months. XPO, Inc. (XPO): RS 72; on AlpharvestPro RS Leaders, Trend Template and Near 52-Week High; 5.6% below its 52-week high, above its 50-day average; up 25% over three months. TSP had no RS reading to compare. |
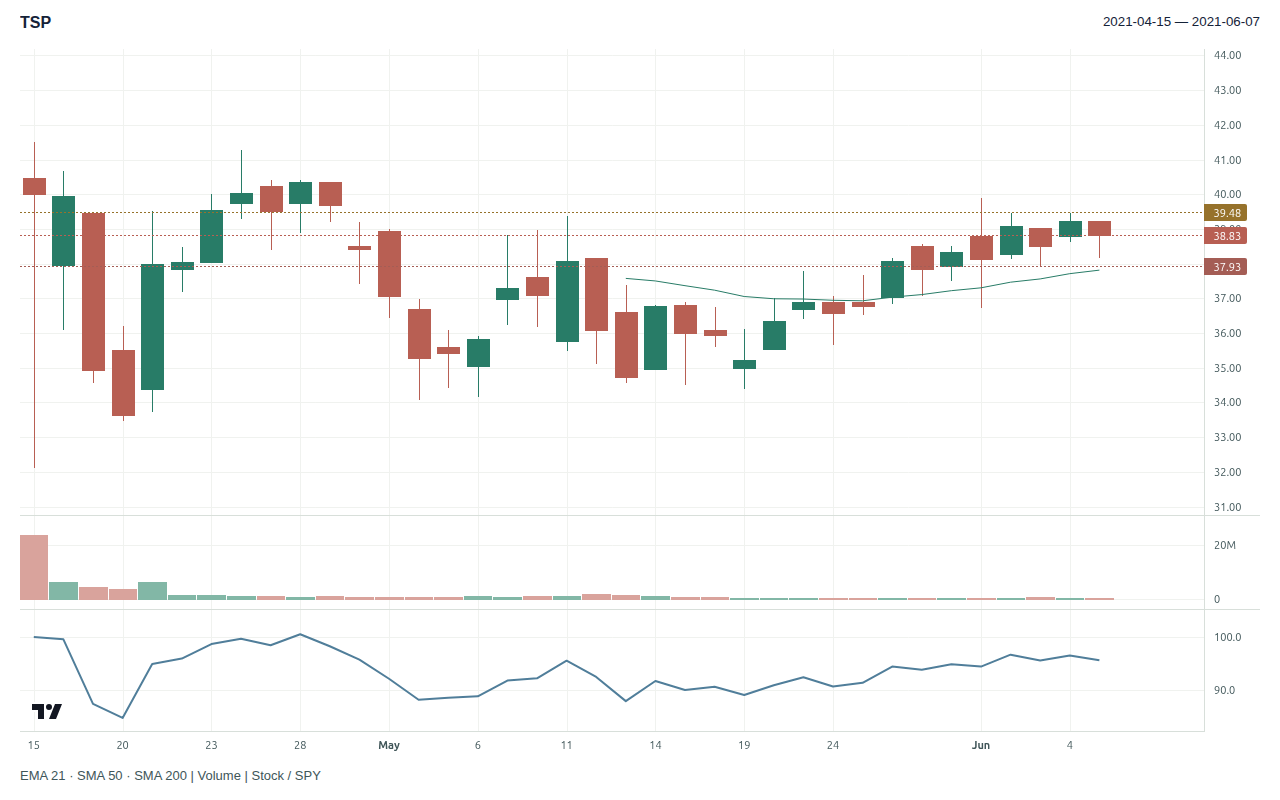
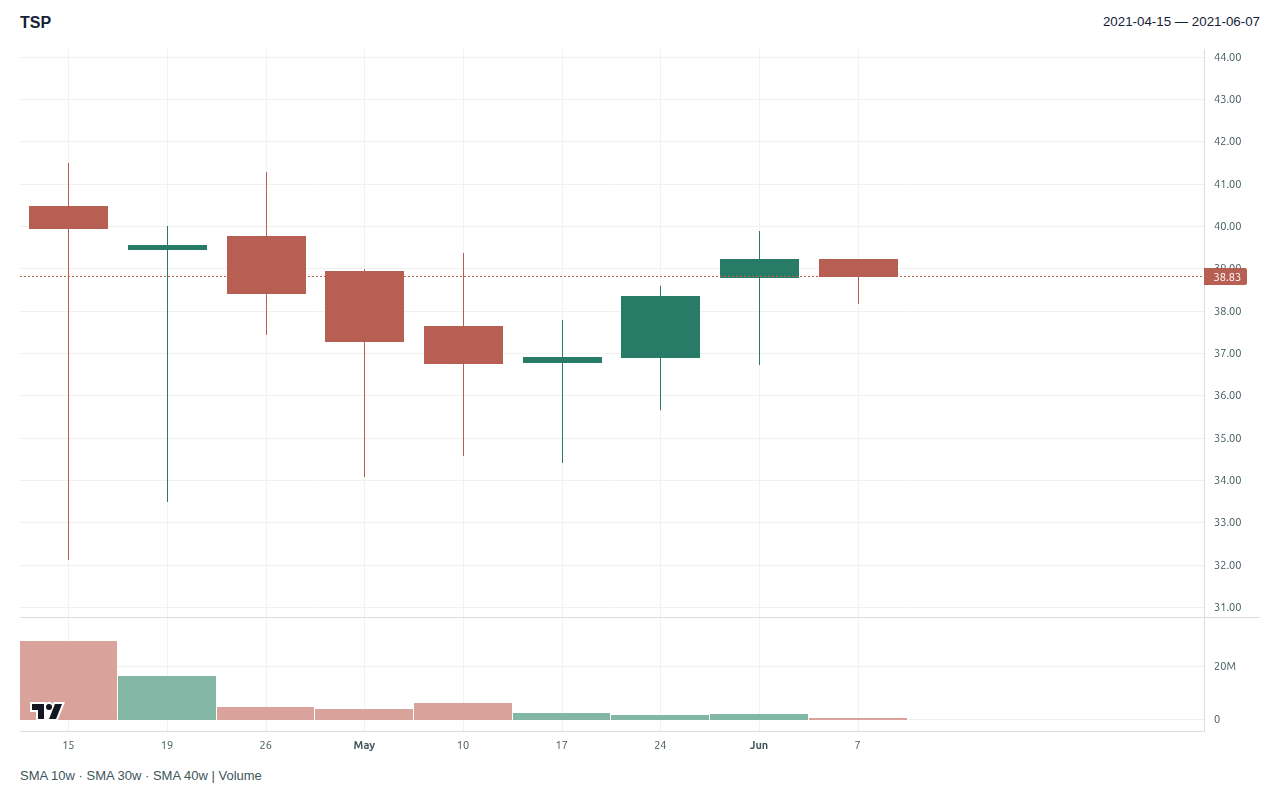
The replay can read the market, which was under pressure, but not the stock. The chart has to carry the trend evidence, and it shows an IPO base. TSP opened its first session at $40.48, traded between $32.13 and $41.50, and closed at $40.00. It then pulled back about 19% to $33.50 by April 20, about 17% from $41.27 on April 26 to $34.10 on May 4, and about 12% from $39.36 on May 11 to $34.59 on May 13. The final week, June 1 to June 7, stayed between $36.75 and $39.88.
Those tightening pullbacks are a reasonable IPO-base reading. The top of the base, the $41.50 first-day high, still sat above the cutoff close.
Prior-close market and screening context · 2021-06-07
| SPY adjusted close | +2.09% versus its 50-session average |
| VIX close | 16.42 |
| AlpharvestPro RS (reconstructed) | Unavailable · current stored roster, not a 2021 published ranking |
| AlpharvestPro Market Compass (provisional) | Uptrend Under Pressure |
| AlpharvestPro presets (33 of 36; 3 left out for near-zero agreement) | 0 of 0 evaluated at close or moderate agreement listed the stock; 0 of 0 at low agreement, shown but not relied on; 33 could not be evaluated |
Retrospective context. Compass headlines and preset membership have unresolved validation limits; distribution-day counts and broad breadth classifications are withheld. No screen output proves a historical order or full SEPA qualification.
A business investing ahead of revenue
The same letter reported first-quarter revenue of approximately $944,000, up 28% sequentially, alongside about $41 million of research and development spending. It described the development of an autonomous freight network and capital raised in the IPO.
Those facts support a company investing in a possible future business at a scale far beyond its current revenue. They do not establish the mature earnings acceleration associated with a conventional profit-led stock selection. Commercial milestones and technical development remained subjects for verification, not completed outcomes.
The proposed pattern is an IPO base, with an entry through the top of a newly formed range. It could be assessed as a specific recent-listing strategy. It should not be described as a fully tested long-term Trend Template on the strength of whatever happened next.
| SEPA element | Evidence at June 7 | Assessment |
|---|---|---|
| Trend | Recent April 15 listing; 37 sessions; too little history for the 50- and 200-day averages, AlpharvestPro RS or preset readings. | Long template untestable |
| Fundamentals | May 10: revenue grew sequentially but remained small relative to development spending. | Early-stage growth; mature-profit thesis unsupported |
| Catalyst | IPO financing and autonomous-freight development. | Public context; future execution uncertain |
| Entry | IPO-base reading with a first-day high of $41.50 above the market; exact pivot and fill not authenticated. | Conditional plan |
| Exit | No verified stop, share count, or sales. | Unknown |
The base must earn the order
The teaching plan uses Minervini’s structure with our own fixed conventions. After a June 1 shakeout to $36.75, TSP traded in a tight four-session area from June 2 to 7, between $37.94 and $39.47, on very low volume. The trigger sits one cent above that area, at $39.48, and the stop one cent below it, at $37.93. The 3.93% distance, inside Minervini’s 10% ceiling, permits 258 shares in the $400 risk illustration, about $10,186 of exposure.
| Teaching calculation | As-traded prices |
|---|---|
| Final contraction | 2021-06-02 to 2021-06-07 |
| Illustrative account / risk budget | $40,000 / $400 (1%) |
| Conditional trigger / stop | $39.48 / $37.93 |
| Risk per share / distance | $1.55 / 3.93%, within Minervini’s 10% ceiling |
| Whole shares / planned stop loss | 258 / $399.90 |
| Position value / account exposure | $10,185.84 / 25.46% |
A teaching calculation with fixed conventions of our own: trigger 1¢ beyond the final contraction’s high (low for a short) and stop 1¢ beyond its other side, read from bars up to the cutoff, sized so the loss at the stop stays within $400. The 10% ceiling is Minervini’s: “keep your losses to 10 percent or less” (Think & Trade Like a Champion).
That trigger sits below the June 1 high of $39.88 and well below the $41.50 first-day high, so it would buy inside the base rather than through its top, the early entry Minervini calls a cheat. A trader who wanted the breakout itself would need a trigger above $41.50; with the same stop, the distance would be about 8.6%, still inside the 10% Minervini sets as his maximum loss but more than twice as wide. Choosing between an early entry with a tight stop and a confirmed breakout with a wider one is the real decision here.
Your decision: what would distinguish a constructive IPO base from a new stock merely lifting out of its first trading range?
Reveal the later TSP path
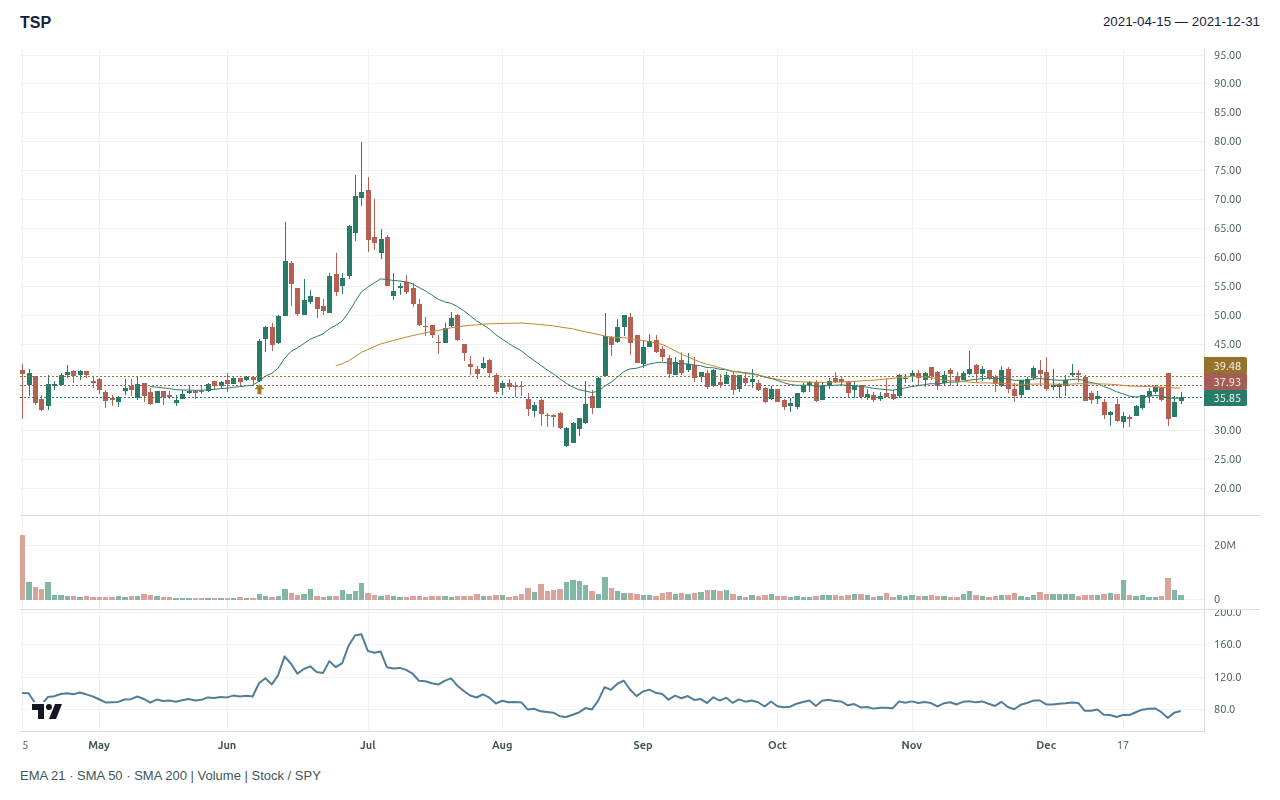
Price source. TuSimple left Nasdaq in 2024 and its shares now trade over the counter as TSPH. The prices in this story come from that later symbol’s history, as traded.
On June 8, TSP opened at $38.78, cleared both triggers and closed at $45.44, up 17.0%, above its first-day high. Its 1.68 million shares were 2.86 times the average of the previous 20 sessions and the heaviest trading since April 21. The stock reached $79.84 intraday and closed at a 2021 high of $71.24 on June 30, first traded through the $37.93 stop on July 30, and ended the year at $35.85. In the exit scenario below, the June 8 surge alone moved the stop to breakeven from the next session, and a close below the 50-day average on July 16 ended the trade before that slide.
AlpharvestPro at the June 8 close. The S&P 500 rose 0.02%; AlpharvestPro Market Compass read Uptrend Under Pressure. The replay had no RS reading for TSP. The replay still had no preset readings. TSP rose 17.0% on 0.94 times its average daily volume over its 37 previous sessions.
The 37-session comparison includes the IPO day’s 23.7 million shares, which is why the 20-session figure is the better guide. Neither tells us when or how Minervini bought, whether he held through the summer, or how much of the June advance he kept.
| Hypothetical exit scenario | Through December 31, 2021 |
|---|---|
| Entry | 2021-06-08 at $39.48 |
| Initial stop | $37.93 |
| Stop changes | 2021-06-08: stop raised to breakeven; 2021-06-24: 50-day average reached the entry |
| Exit | 2021-07-16 at $46.62 (close below the 50-day average) |
| Result | +18.09% · +4.61 R · +$1,842.12 on 258 shares |
Fixed rules adapted from Minervini’s guidance in Think & Trade Like a Champion: the initial stop; the stop to breakeven once the price has moved three times the risk; and, once the 50-day average reaches the entry, an exit on a close beyond it (“breakeven or better”). Selling into strength is not modelled. Our conventions: a stop change takes effect from the next session; an exit on a close is valued at that close; an entry that opens past the trigger is resized to keep the $400 risk. Daily bars cannot show the order of moves within a day. R is the initial risk per share. A teaching scenario, not Minervini’s trade; no costs, borrow or slippage.
TSP’s lesson is to name the method you are actually using. When AlpharvestPro’s replay cannot rank a new listing, an IPO-base trade can still be studied on its own terms, with its own limited history and risk plan, without pretending it passed tests that the listing was too young to support.
Sources: TuSimple shareholder letter dated May 10, 2021; Minervini, Trade Like a Stock Market Wizard, Chapter 3. Prices: Yahoo Finance history for TSPH, as traded, checked against the exchange calendar and dated 2021 news reports. Market Compass: AlpharvestPro history archive replay. Execution evidence remains incomplete.
AlpharvestPro wrote and published this independent research journal. AlpharvestPro is not affiliated with or endorsed by Mark Minervini.

