
Mark Minervini 2021: A Research Journal
Read the journey
June 4, 2021 · Heska’s reported expansion deserved attention. The chart and the composition of that growth still needed their own checks.
A headline growth rate can make a base look more convincing. HSKA offers a reminder to investigate what produced the number before letting it settle a trading decision.
Our cutoff is June 3, and we open AlpharvestPro’s replay of that close. We preserve the case even though the archive has no HSKA prices: the missing data are a limitation of the research record, not a reason to replace the company with an easier winner.
What AlpharvestPro’s replay shows at the June 3 close
AlpharvestPro’s history archive replays today’s presets, relative strength and Market Compass over 2020–2021 prices. It uses the current stock roster, so it carries survivorship bias. HSKA is here because it is one of Minervini’s 2021 setups, not because the app selected it. The replay shows how AlpharvestPro’s tools read the chart at the cutoff, not what any screen displayed in 2021 or what Minervini used.
| At the June 3 close | AlpharvestPro replay |
|---|---|
| AlpharvestPro Market Compass (provisional) | Uptrend Under Pressure since May 10, inside an uptrend that had held since the S&P 500’s new 52-week closing high on March 11. All five tracked indexes fell that day, and the Nasdaq Composite closed below its 50-day average. |
| AlpharvestPro RS (reconstructed, current roster) | No reading. The archive has no HSKA price series. |
| AlpharvestPro presets the stock was on | No readings. Without a price series, every preset is unknown, not failed. |
| Industry peers | Medical Devices: the two largest companies by today’s market value that traded then; the choice uses today’s knowledge, the readings do not. Abbott Laboratories (ABT): RS 17; on no preset the replay relies on; 14.7% below its 52-week high, below its 50-day average; down 6% over three months. Medtronic plc (MDT): RS 31; on AlpharvestPro Trend Template; 7.0% below its 52-week high, below its 50-day average; up 7% over three months. HSKA had no RS reading to compare. |
For HSKA the replay can read only the market, and the market reading was cautious: under pressure for more than three weeks, with every tracked index lower that day. The archive’s current roster does not include Heska, so the stock evidence has to come from the company’s releases and from the chart shown after the reveal.
Prior-close market and screening context · 2021-06-03
| SPY adjusted close | +1.60% versus its 50-session average |
| VIX close | 18.04 |
| AlpharvestPro RS (reconstructed) | Unavailable · current stored roster, not a 2021 published ranking |
| AlpharvestPro Market Compass (provisional) | Uptrend Under Pressure |
| AlpharvestPro presets (33 of 36; 3 left out for near-zero agreement) | 0 of 0 evaluated at close or moderate agreement listed the stock; 0 of 0 at low agreement, shown but not relied on; 33 could not be evaluated |
Retrospective context. Compass headlines and preset membership have unresolved validation limits; distribution-day counts and broad breadth classifications are withheld. No screen output proves a historical order or full SEPA qualification.
HSKA: AlpharvestPro’s archive has no daily prices under this ticker, so no chart is drawn here. No substitute prices have been plotted.
Read beyond the consolidated growth rate
Heska’s May 6 first-quarter release reported revenue of $60.5 million, up 97.4%, and GAAP diluted EPS of $0.19. North American revenue grew 34.8%, while North American point-of-care laboratory consumables sales increased 23.9%.
The separate operating figures are useful because consolidated expansion and like-for-like demand are different questions. The international segment included the scil business, so the acquisition and comparison periods matter. We should not treat the consolidated percentage as a standalone measure of organic growth.
There was also a sequential decline: the February 23 release reported fourth-quarter revenue of $64.3 million and GAAP diluted EPS of $0.25, both above the following quarter’s $60.5 million and $0.19. That confirms a sequential decline; it does not establish why Minervini chose the trade or how much seasonality he allowed for.
Read as a Minervini setup, the chart would need a Stage 2 advance followed by a base that tightens toward the right side. Without the daily series, we cannot independently reproduce the averages, quantify the contractions, or establish an RS-line high at the cutoff. Calling the trade primarily technical would also infer a motive the sources do not disclose.
| SEPA element | Evidence | Assessment |
|---|---|---|
| Trend | No daily prices in the archive, so no measurements, AlpharvestPro RS or preset readings. | Not testable here |
| Fundamentals | May 6: strong consolidated and North American growth, with acquisition/comparison considerations. | Supported improvement, composition matters |
| Catalyst | Diagnostic-product demand and expansion described; June 4 order motive unknown. | Supported business context |
| Entry | June 4 date under review; exact pivot and intraday behavior unverified. | Not testable without prices |
| Exit | No authenticated stop, quantity, or sales. | Unknown |
What would justify a position?
Minervini’s VCP discussion emphasizes contracting price ranges and quieter supply near an actionable pivot. For HSKA, a disciplined reconstruction would need the actual daily ranges and volumes before June 4, then a stop tied to the specific local structure. A wide or erratic final area could justify waiting even if the business evidence were attractive.
No numerical plan: the archive has no price series for this case. Actual Minervini orders remain unknown.
Once those prices are verified, the usual risk-budget division can determine size. It cannot be done reliably from a visual estimate or a future peak. The plan would also need a rule for failed follow-through and the possibility of a gap through support.
Your decision: would you act on a pattern you cannot measure, or require the missing daily record before choosing an entry and failure level?
Reveal what is known after June 3
HSKA: AlpharvestPro’s archive has no daily prices under this ticker, so no chart is drawn here. No substitute prices have been plotted.
Heska was acquired in 2023 and its shares no longer trade, which is why the archive’s current roster does not include it.
AlpharvestPro’s archive holds no HSKA price series, so the later path comes from a historical chart drawn by another charting service, shown below with its Chinese-language labels masked. It runs from November 2020 to October 2021, and the vertical line marks June 4.
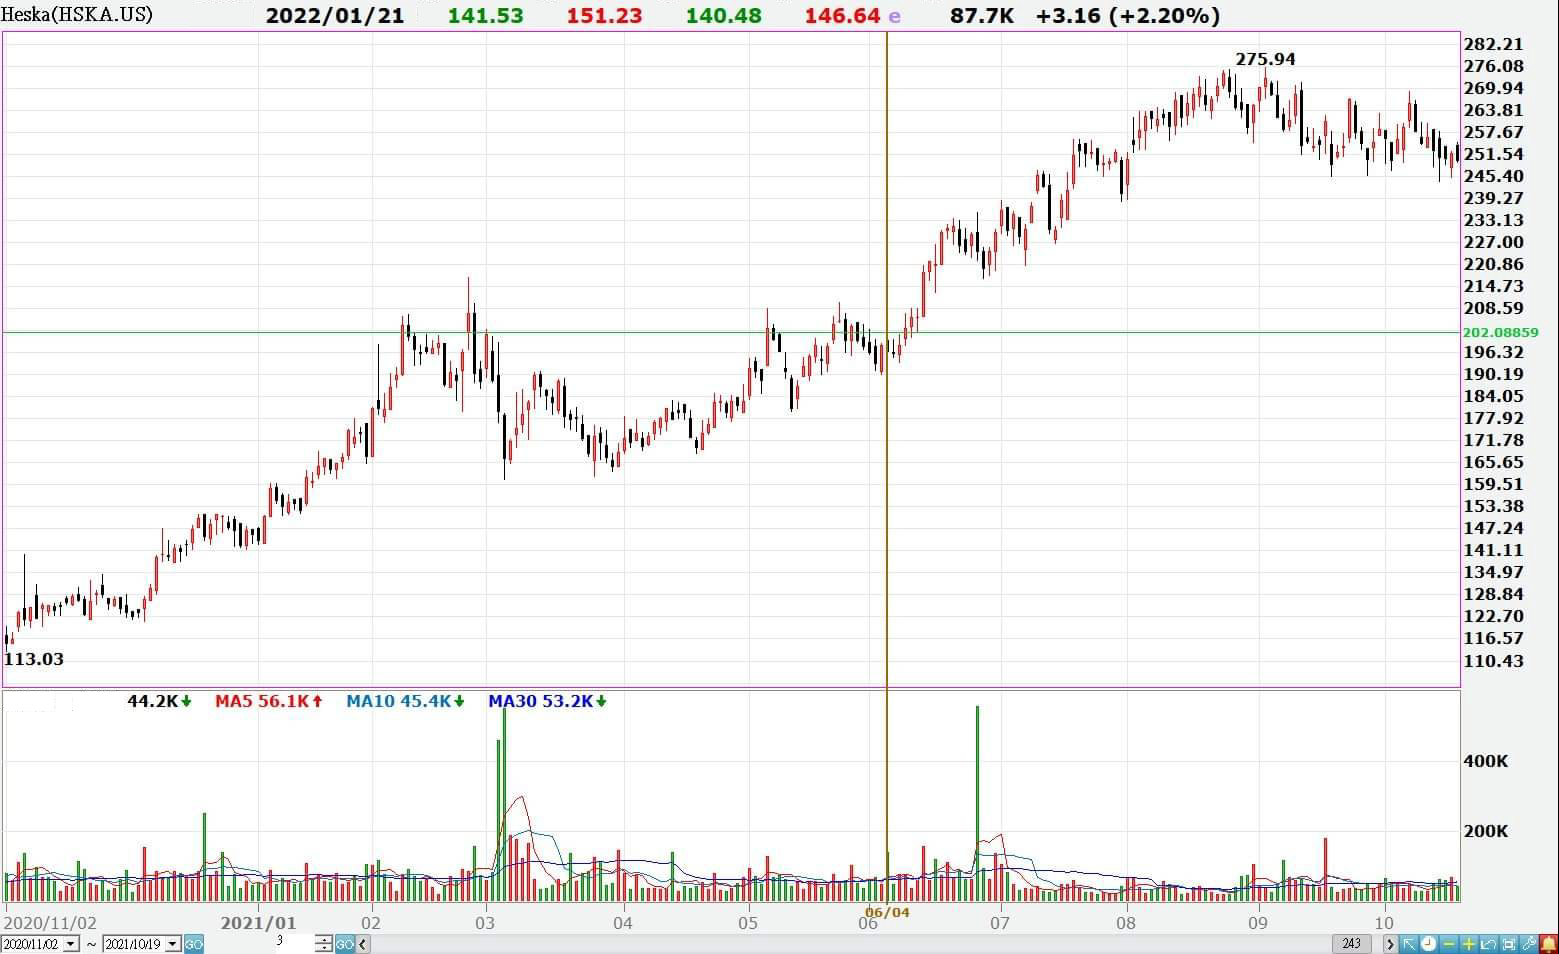
The chart shows HSKA near $200 at the date under review, an advance through the summer to a marked high of $275.94, and a drift lower into October. Those are readings from a picture, not measurements: they cannot support a calculated return, a stop test or volume ratios. The date under review remains an annotation, not an order, and the historical order sequence is unknown.
AlpharvestPro at the June 4 close. The S&P 500 rose 0.88%; AlpharvestPro Market Compass read Uptrend Under Pressure. The replay had no RS reading for HSKA. The replay still had no preset readings.
HSKA’s lesson is to demand two kinds of clarity: what the growth rate measures and what the price structure permits you to risk. When AlpharvestPro’s replay can read only the market, say so, and do not let a picture stand in for the measurements the tools would normally supply.
Sources: Heska earnings releases, February 23 and May 6, 2021; Minervini, Trade Like a Stock Market Wizard, Chapters 3 and 10; historical chart from a third-party charting service, Chinese-language labels masked. Market Compass: AlpharvestPro history archive replay. Missing daily data prevent a quantified blind chart exercise and a numerical risk plan.
AlpharvestPro wrote and published this independent research journal. AlpharvestPro is not affiliated with or endorsed by Mark Minervini.

