
Mark Minervini 2021: A Research Journal
Read the journey
June 2, 2021 · The business transformation was extraordinary. The trading question was whether price had digested its advance enough to offer controlled risk.
BioNTech is the kind of historical chart that can make a breakout appear obvious. A major commercial change was already visible in the financial statements, and the prior price advance was substantial. But a powerful reason to follow a stock is not the same as a reason to chase it.
We stop at June 1 and open AlpharvestPro’s replay of that close. Prices are the archive’s revised adjusted units.
What AlpharvestPro’s replay shows at the June 1 close
AlpharvestPro’s history archive replays today’s presets, relative strength and Market Compass over 2020–2021 prices. It uses the current stock roster, so it carries survivorship bias. BNTX is here because it is one of Minervini’s 2021 setups, not because the app selected it. The replay shows how AlpharvestPro’s tools read the chart at the cutoff, not what any screen displayed in 2021 or what Minervini used.
| At the June 1 close | AlpharvestPro replay |
|---|---|
| AlpharvestPro Market Compass (provisional) | Uptrend Under Pressure since May 10, inside an uptrend that had held since the S&P 500’s new 52-week closing high on March 11. The tracked indexes were mixed that day, but all five closed above their 50- and 200-day averages; the NYSE Composite closed at a new high. |
| AlpharvestPro RS (reconstructed, current roster) | 97. Earlier readings: 96 on May 3 (20 sessions before), 78 on March 2 (63 sessions) and 98 on Nov. 27, 2020 (126 sessions); its range over the last 63 sessions was 40–97. |
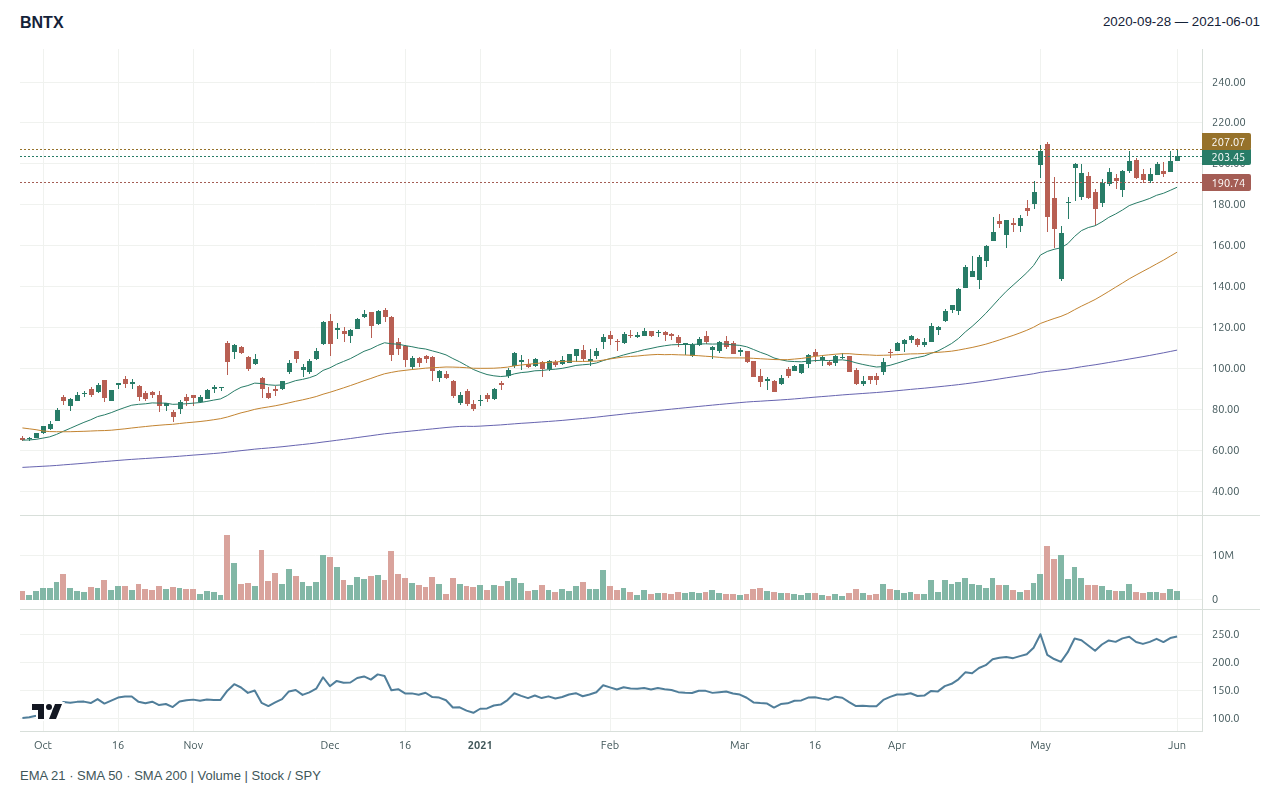
| Price and averages | $203.45, above the 50-day average of $156.66 and above the 200-day average of $108.84. It closed 3.3% below its 52-week high of $210.36 on May 4. |
| AlpharvestPro presets in the week before June 2 | Five sessions, May 25 to June 1: AlpharvestPro Near 52-Week High, every session; AlpharvestPro RS Leaders, every session; AlpharvestPro Trend Template, every session; AlpharvestPro Breakout Setup, on May 26, May 28 and June 1. Each of these replays agrees closely with the live app. Also shown, but not relied on because its replay agrees poorly with the live app: AlpharvestPro NR7 Squeeze, on May 25, May 26 and June 1. |
| AlpharvestPro presets the stock was on | AlpharvestPro RS Leaders, every session since April 7; AlpharvestPro Trend Template, every session since March 30; AlpharvestPro Near 52-Week High, every session since May 14; AlpharvestPro Breakout Setup, every session since May 28. All four replays agree closely with the live app. AlpharvestPro NR7 Squeeze also appears from June 1, but its replay agrees poorly with the live app. |
| AlpharvestPro early-Stage-2 check | Not passed, on three conditions: its 150-day average had been rising for longer than an early-stage advance, it stood far above its 150-day average and the stock had already advanced far above its base low. |
| Industry peers | COVID-19 vaccine developers, grouped by the vaccine rather than by industry. Moderna, Inc. (MRNA): RS 92; on AlpharvestPro RS Leaders, Trend Template, Near 52-Week High and VCP Setup; 2.4% below its 52-week high, above its 50-day average; up 26% over three months. Novavax, Inc. (NVAX): RS 66; on AlpharvestPro Bear Flag Continuation and Head-and-Shoulders Top; 56.2% below its 52-week high, below its 50-day average; down 29% over three months. BNTX’s RS of 97 was above both. |
In the week before June 2, AlpharvestPro Breakout Setup listed BNTX on May 26, May 28 and June 1, alongside the three trend presets; all four agree closely with the live app.
The stock side was as strong as AlpharvestPro measures it: four presets that agree closely with the live app, and an RS that had climbed back to 97 from a low of 40 in the past three months. The market side was not. Market Compass had read Uptrend Under Pressure for three weeks.
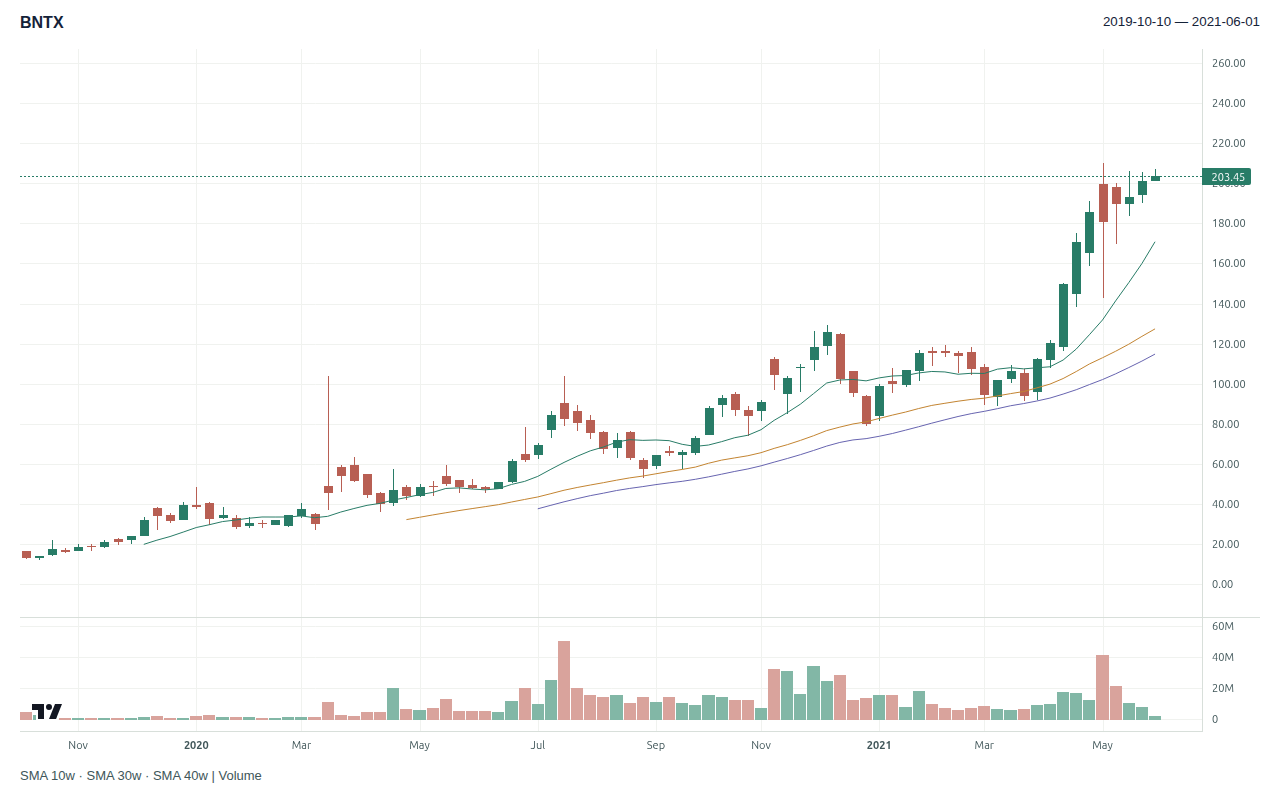
The chart explains both the strength and the risk. On May 4 BNTX set a 52-week high and then closed 15.3% lower on the day, 17.0% below that high, on 5.8 times its average volume. On May 6, as governments debated a vaccine patent waiver that the United States had backed the evening before, it traded as low as $143.10, about 32% below the May 4 high, before closing at $165.80. It then rebuilt quickly: a high of $206.29 on May 20, a pullback of about 7.5% to $190.75 on May 24, and a final range of about 6.5% between $193.62 and $207.06 from May 27 to June 1, on below-average volume.
Agreement with the live app is the replay’s median daily overlap with the live AlpharvestPro app’s stored preset results from July 7 to November 6, 2026. A preset with low agreement is shown when it appears, but it is not relied on.
Prior-close market and screening context · 2021-06-01
| SPY adjusted close | +2.10% versus its 50-session average |
| VIX close | 17.90 |
| AlpharvestPro RS (reconstructed) | 97 · current stored roster, not a 2021 published ranking |
| AlpharvestPro Market Compass (provisional) | Uptrend Under Pressure |
| AlpharvestPro presets (33 of 36; 3 left out for near-zero agreement) | 4 of 25 evaluated at close or moderate agreement listed the stock; 1 of 8 at low agreement, shown but not relied on; 0 could not be evaluated |
Retrospective context. Compass headlines and preset membership have unresolved validation limits; distribution-day counts and broad breadth classifications are withheld. No screen output proves a historical order or full SEPA qualification.
A transformation, not an ordinary EPS percentage
The May 10 first-quarter release estimated revenue of €2,048.4 million, compared with €27.7 million a year earlier. Diluted EPS moved to €4.39 from a €0.24 loss. The revenue included BioNTech’s share of gross profit from vaccine sales in partner territories as well as other commercial revenue.
This was a loss-to-profit transition. Describing EPS as a routine percentage increase would obscure the negative comparison base. The contemporaneous figures were striking enough without that shortcut.
Two labels fit this chart at first sight: a VCP and a Power Play. In his books, Minervini requires a strong preceding thrust and an orderly digestion of supply for a Power Play; a stock’s large advance alone is not the entire pattern. We therefore treat each label as a hypothesis to examine on the decision chart. AlpharvestPro’s VCP Setup, now part of the replay, checked BNTX in each of the five sessions before June 2 and did not list it (it had last listed BNTX on April 13), and AlpharvestPro High Tight Flag did not list it either. The replay therefore does not verify the label for us.
| SEPA element | Evidence before June 2 | Assessment |
|---|---|---|
| Trend | June 1: AlpharvestPro RS 97; on AlpharvestPro RS Leaders, Trend Template, Near 52-Week High and Breakout Setup; far above the 50-day line. | Strong trend, entry risk needs attention |
| Fundamentals | May 10: sharp revenue increase and move from loss to profit. | Supported transformation |
| Catalyst | Commercial vaccine revenue already reported; patent-waiver debate and future demand remained uncertain. | Supported context, no guaranteed continuation |
| Entry | Pause/contraction interpretation under review; exact pivot and fill unavailable. | Conditional VCP/Power Play reading |
| Exit | No documented stop, partial sales, or final sale. | Unknown |
Measure the risk at the pause
The teaching plan uses Minervini’s structure with our own fixed conventions. After the May 20 high, BNTX contracted from May 21 to June 1 on drying volume, a 7.9% range that ended 1.6% below the May 4 high. The trigger sits one cent above that contraction’s high, at $207.07, and the stop one cent below its low, at $190.74. The 7.89% distance, inside Minervini’s 10% ceiling, permits 24 shares under the $400 risk budget.
| Teaching calculation | Archive-adjusted units |
|---|---|
| Final contraction | 2021-05-21 to 2021-06-01 |
| Illustrative account / risk budget | $40,000 / $400 (1%) |
| Conditional trigger / stop | $207.07 / $190.74 |
| Risk per share / distance | $16.33 / 7.89%, within Minervini’s 10% ceiling |
| Whole shares / planned stop loss | 24 / $391.92 |
| Position value / account exposure | $4,969.68 / 12.42% |
A teaching calculation with fixed conventions of our own: trigger 1¢ beyond the final contraction’s high (low for a short) and stop 1¢ beyond its other side, read from bars up to the cutoff, sized so the loss at the stop stays within $400. The 10% ceiling is Minervini’s: “keep your losses to 10 percent or less” (Think & Trade Like a Champion).
A plausible plan would require a controlled breakout, avoid paying materially beyond the trigger, and retain the initial loss limit despite the strong earnings story. The market background also matters: AlpharvestPro Market Compass was under pressure at the cutoff, although that classification remains provisional. A strong individual stock does not establish healthy broad participation.
Your decision: would the local contraction justify entry despite the distance from the 50-day line, or would you wait for another structure?
Reveal the later BNTX path
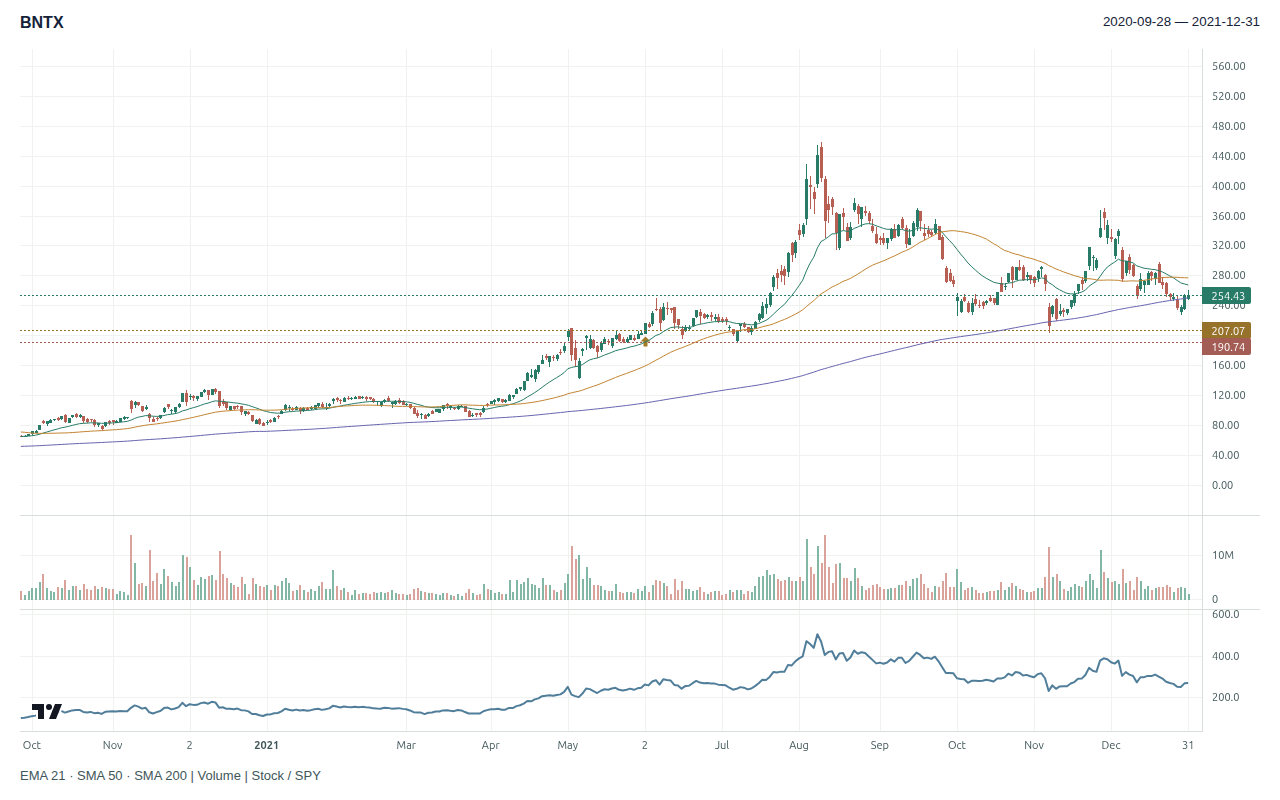
The June 2 adjusted close was about $216.53, above the May 4 high. The subsequent archive path included a July 8 low near $191.50, an August 10 high near $457.93, and a year-end close of $254.43. The July low came within 76 cents of the $190.74 stop without crossing it.
AlpharvestPro at the June 2 close. The S&P 500 rose 0.14%; AlpharvestPro Market Compass read Uptrend Under Pressure. BNTX’s AlpharvestPro RS rose to 98. The replay added AlpharvestPro 4% Breakout, at moderate agreement. It dropped AlpharvestPro NR7 Squeeze. BNTX rose 6.4% on 0.92 times its average daily volume over the previous 50 sessions.
The breakout came on below-average volume in a market under pressure, two conditions a breakout buyer would normally want to see the other way round. This is an exercise in entry quality and profit protection, not evidence that a trader held every fluctuation. The later high cannot be entered as Minervini’s sale price. His actual holding period, exposure, and realized BNTX result remain unknown.
| Hypothetical exit scenario | Through December 31, 2021 |
|---|---|
| Entry | 2021-06-02 at $207.07 |
| Initial stop | $190.74 |
| Stop changes | 2021-07-12: 50-day average reached the entry |
| Exit | 2021-07-13 at $205.12 (close below the 50-day average) |
| Result | −0.94% · −0.12 R · −$46.73 on 24 shares |
Fixed rules adapted from Minervini’s guidance in Think & Trade Like a Champion: the initial stop; the stop to breakeven once the price has moved three times the risk; and, once the 50-day average reaches the entry, an exit on a close beyond it (“breakeven or better”). Selling into strength is not modelled. Our conventions: a stop change takes effect from the next session; an exit on a close is valued at that close; an entry that opens past the trigger is resized to keep the $400 risk. Daily bars cannot show the order of moves within a day. R is the initial risk per share. A teaching scenario, not Minervini’s trade; no costs, borrow or slippage.
Before studying the peak, mark the final contraction and the price that would negate it. In AlpharvestPro, check the stock and the market separately: BNTX was on four presets the replay relies on while Market Compass was under pressure. Outstanding fundamentals can strengthen a watchlist thesis while leaving entry discipline just as demanding.
Sources: BioNTech release, May 10, 2021 (figures also in its Form 6-K exhibit); Minervini, Trade Like a Stock Market Wizard, Chapters 3 and 10, and Think & Trade Like a Champion, Section 7 on Power Plays. Chart, RS, presets and Market Compass: AlpharvestPro history archive replay; reconstructed RS is not an all-time-high RS-line test. Prices are revised adjusted units; all execution examples remain hypothetical.
AlpharvestPro wrote and published this independent research journal. AlpharvestPro is not affiliated with or endorsed by Mark Minervini.

