
Mark Minervini 2021: A Research Journal
Read the journey
April 8, 2021 · Shipping profits were already public. The short trading history still prevented a conventional long-term trend assessment.
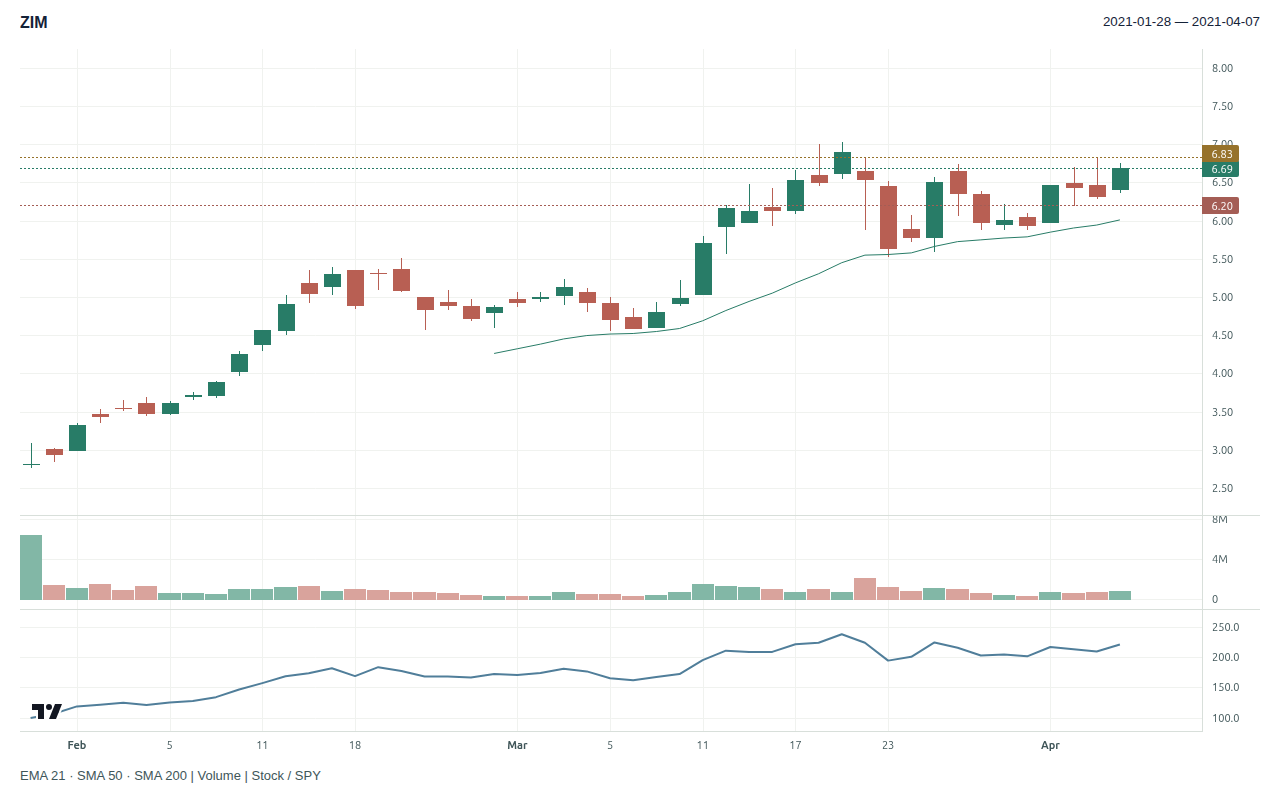
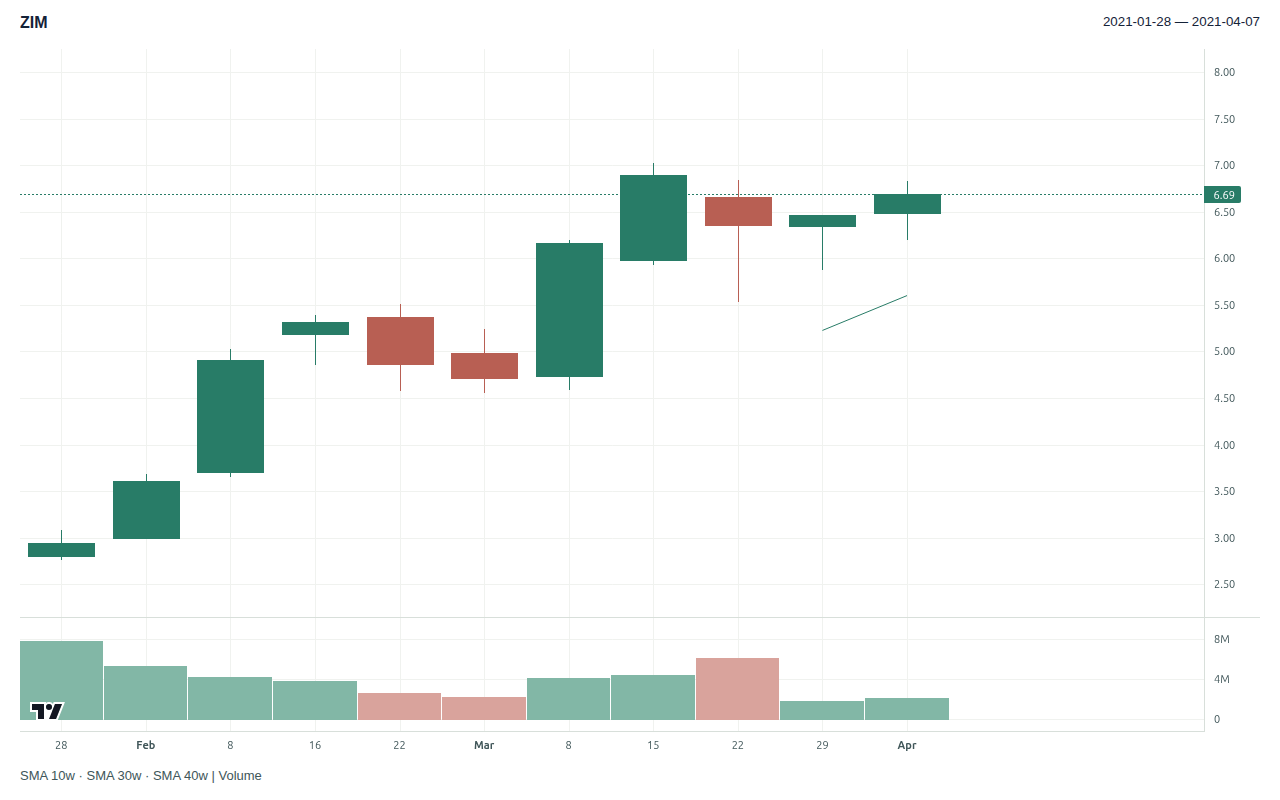
A recent listing is not necessarily a new business. ZIM had operating results to examine, but by April 7 its public price history in the archive contained only 48 valid sessions. Confusing those two histories would overstate what the chart could prove.
The setup date under review is April 8. We stop one session earlier and open AlpharvestPro’s replay of that close.
What AlpharvestPro’s replay shows at the April 7 close
AlpharvestPro’s history archive replays today’s presets, relative strength and Market Compass over 2020–2021 prices. It uses the current stock roster, so it carries survivorship bias. ZIM is here because it is one of Minervini’s 2021 setups, not because the app selected it. The replay shows how AlpharvestPro’s tools read the chart at the cutoff, not what any screen displayed in 2021 or what Minervini used.
| At the April 7 close | AlpharvestPro replay |
|---|---|
| AlpharvestPro Market Compass (provisional) | Confirmed Uptrend. The uptrend had held since the S&P 500’s new 52-week closing high on March 11, with 11 sessions at Uptrend Under Pressure along the way, the latest on March 31. The tracked indexes were mixed that day, and the Russell closed below its 50-day average; the S&P 500 closed at a new high. |
| AlpharvestPro RS (reconstructed, current roster) | No reading. ZIM’s 48 sessions were fewer than AlpharvestPro’s RS ranking needs. |
| Price and averages | $27.38 as traded, $6.69 in the archive’s dividend-adjusted units. There was not yet enough history for a 50-day or 200-day average. |
| AlpharvestPro presets in the week before April 8 | None. In the five sessions from March 31 to April 7 most presets were still unknown for a stock this young, and the replay showed it on none of the others. |
| AlpharvestPro presets the stock was on | None. A stock this young had too little history for 29 of the 33 presets, which are unknown, not failed; the replay did not show it on any of the other 4. |
| Industry peers | Marine Shipping: the two largest companies by today’s market value that traded then; the choice uses today’s knowledge, the readings do not. Kirby Corporation (KEX): RS 43; on AlpharvestPro Trend Template; 11.8% below its 52-week high, above its 50-day average; up 15% over three months. Matson, Inc. (MATX): RS 82; on AlpharvestPro RS Leaders, Trend Template and Near 52-Week High; 9.9% below its 52-week high, above its 50-day average; up 23% over three months. ZIM had no RS reading to compare. |
The replay cannot say whether AlpharvestPro would have shown ZIM. The listing history can. ZIM priced its January initial public offering at $15, below the range it had marketed, and closed its first session on January 28 at $11.50. By the cutoff it stood at $27.38, 83% above the offering price, after a closing high of $28.25 on March 19, a drop to $23.09 on March 23, and closes between $24.34 and $27.38 from March 29 to April 7.
That is the shape of an IPO that broke its offering price and then recovered. The ordinary long-term Trend Template simply cannot be tested yet.
Prior-close market and screening context · 2021-04-07
| SPY adjusted close | +4.70% versus its 50-session average |
| VIX close | 17.16 |
| AlpharvestPro RS (reconstructed) | Unavailable · current stored roster, not a 2021 published ranking |
| AlpharvestPro Market Compass (provisional) | Confirmed Uptrend |
| AlpharvestPro presets (33 of 36; 3 left out for near-zero agreement) | 0 of 2 evaluated at close or moderate agreement listed the stock; 0 of 2 at low agreement, shown but not relied on; 29 could not be evaluated |
Retrospective context. Compass headlines and preset membership have unresolved validation limits; distribution-day counts and broad breadth classifications are withheld. No screen output proves a historical order or full SEPA qualification.
What the shipping results actually said
ZIM’s March 22 release reported full-year 2020 revenue of $3.99 billion, up 21%, and net income of $524.2 million, versus a $13.0 million loss in 2019. Fourth-quarter revenue rose 64% to $1.36 billion. The company guided 2021 adjusted EBITDA of $1.40 billion to $1.60 billion.
The company disclosed a higher average freight rate as part of the operating context. That supported a contemporaneous earnings thesis. It did not establish that freight conditions would remain favorable indefinitely, and the eventual 2021 full-year result was not available in April.
Minervini’s SEPA structure separates this fundamental evidence from trend qualification. A trader could consider a recent-listing breakout while being unable to verify the ordinary long-term Trend Template. We should name the exception rather than quietly supplying the missing averages.
| SEPA element | Evidence before April 8 | Assessment |
|---|---|---|
| Trend | 48 prior valid sessions; no 50/200-day averages, AlpharvestPro RS or preset readings. | Long template untestable |
| Fundamentals | March 22: profitable 2020, higher sales and freight rates; 2021 EBITDA guidance. | Supported operating improvement |
| Catalyst | Shipping economics and a recent listing; no verified order-specific event. | Plausible context; motive unknown |
| Entry | Early public price structure; exact historical pivot/fill unavailable. | Conditional IPO-style study |
| Exit | No documented stops or sales. | Unknown |
Make the quote basis explicit
The revised adjusted close at the cutoff is approximately $6.69, while the source’s unadjusted close is $27.38. Subsequent distributions materially affect the adjusted series. They do not mean the stock traded at $6.69 on the original 2021 tape.
The teaching plan uses Minervini’s structure with our own fixed conventions on a young chart. ZIM’s pullbacks narrowed from 21% to 13% and then to 9%; the last of them, April 5 to 7, sat 2.9% below the March 19 high. In the archive’s adjusted units, the trigger sits one cent above that area, at $6.83, and the stop one cent below it, at $6.20: a 9.22% distance, inside Minervini’s 10% ceiling. The table demonstrates risk arithmetic on that common chart basis. Its share count is not a reconstruction of the shares a $40,000 account would have purchased at original 2021 quotes.
| Teaching calculation | Archive-adjusted units |
|---|---|
| Final contraction | 2021-04-05 to 2021-04-07 |
| Illustrative account / risk budget | $40,000 / $400 (1%) |
| Conditional trigger / stop | $6.83 / $6.20 |
| Risk per share / distance | $0.63 / 9.22%, within Minervini’s 10% ceiling |
| Whole shares / planned stop loss | 634 / $399.42 |
| Position value / account exposure | $4,330.22 / 10.83% |
A teaching calculation with fixed conventions of our own: trigger 1¢ beyond the final contraction’s high (low for a short) and stop 1¢ beyond its other side, read from bars up to the cutoff, sized so the loss at the stop stays within $400. The 10% ceiling is Minervini’s: “keep your losses to 10 percent or less” (Think & Trade Like a Champion).
For an actual historical-dollar simulation, the quote and distribution basis would need a separate reconciliation. Even within the teaching example, 9.22% sits close to the 10% Minervini sets as his maximum loss, leaving little room for a wider stop. A fast freight-related headline move could also gap beyond a stop.
Your decision: does an IPO-style opportunity justify proceeding without the long trend tests, and is the proposed distance to failure acceptable?
Reveal the later ZIM chart
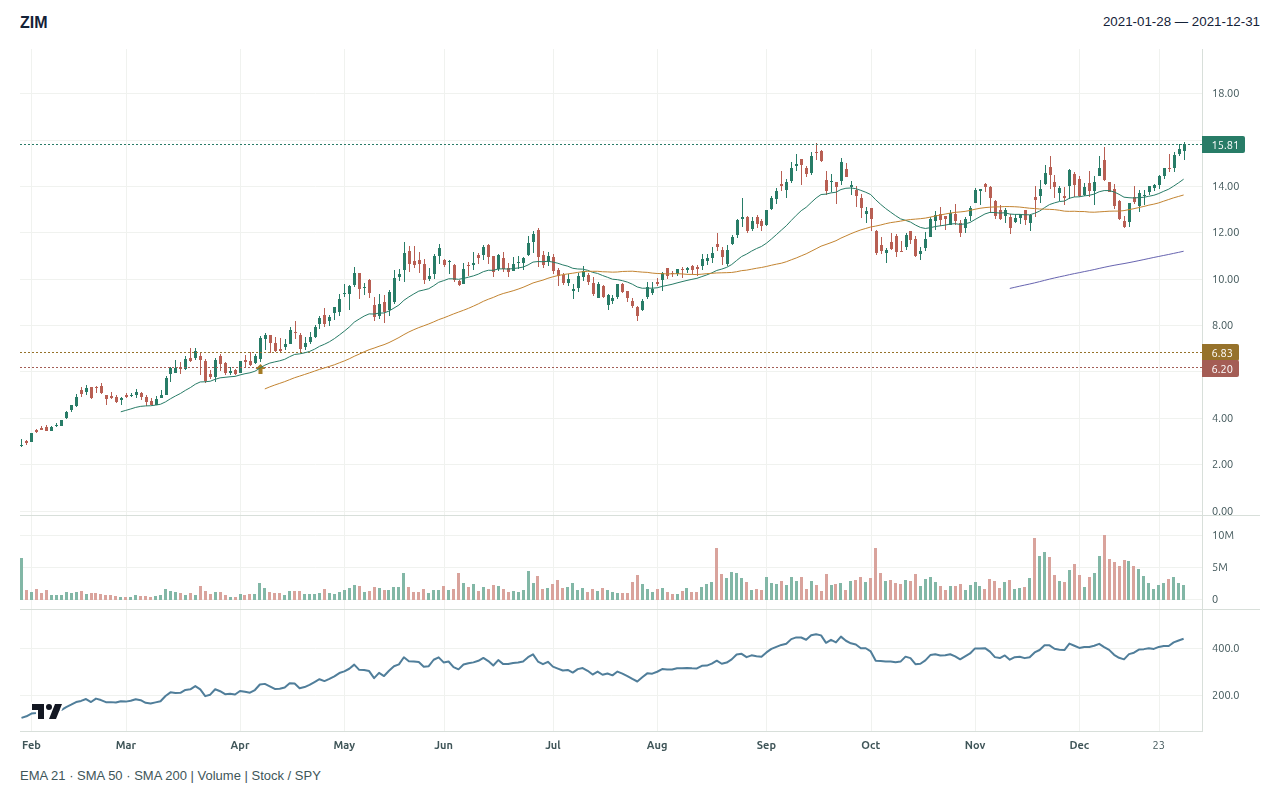
April 8’s source close was $30.50; its revised adjusted close is approximately $7.45. The adjusted series ended 2021 near $15.81. Those values illustrate why a chart comparison must preserve a consistent basis rather than mix an original quote with a later adjusted price.
AlpharvestPro at the April 8 close. The S&P 500 rose 0.42%; AlpharvestPro Market Compass read Confirmed Uptrend. The replay had no RS reading for ZIM. The replay still showed it on no preset, with most presets still unknown. ZIM rose 11.4% on 2.71 times its average daily volume over its 48 previous sessions.
The advance can inform a discussion of trend management. It does not disclose Minervini’s entry fill, distributions received, exit dates, or net return. No annual account result is allocated to this chart.
| Hypothetical exit scenario | Through December 31, 2021 |
|---|---|
| Entry | 2021-04-08 at $6.83 |
| Initial stop | $6.20 |
| Stop changes | 2021-04-27: stop raised to breakeven; 2021-05-07: 50-day average reached the entry |
| Exit | 2021-07-06 at $9.88 (close below the 50-day average) |
| Result | +44.60% · +4.84 R · +$1,931.44 on 634 shares |
Fixed rules adapted from Minervini’s guidance in Think & Trade Like a Champion: the initial stop; the stop to breakeven once the price has moved three times the risk; and, once the 50-day average reaches the entry, an exit on a close beyond it (“breakeven or better”). Selling into strength is not modelled. Our conventions: a stop change takes effect from the next session; an exit on a close is valued at that close; an entry that opens past the trigger is resized to keep the $400 risk. Daily bars cannot show the order of moves within a day. R is the initial risk per share. A teaching scenario, not Minervini’s trade; no costs, borrow or slippage.
ZIM’s lesson is to keep three records separate: the operating history, the public trading history, and the adjustment history. When AlpharvestPro’s replay is silent on a new listing, the offering price and the first weeks of trading are the trend evidence; none of them supplies a missing stop or execution.
Corporate sources: ZIM release, March 22, 2021; IPO prospectus, January 2021. Reading: Minervini, Trade Like a Stock Market Wizard, Chapter 3. Chart, presets and Market Compass: AlpharvestPro history archive replay; reconstructed prices include later adjustments. The case is selected retrospectively, and the short listing history is a substantive qualification limit.
AlpharvestPro wrote and published this independent research journal. AlpharvestPro is not affiliated with or endorsed by Mark Minervini.

