
Mark Minervini 2021: A Research Journal
Read the journey
January 4, 2021 · The first case begins with improving profitability, falling sales, and a chart recovering from a deep decline.
A stock recovering from a bad year can look cheap, strong, or already too far from its low. None of those descriptions identifies a controlled entry. ANF offers a more useful starting question: had the recovery created a place where a trader could be wrong at an acceptable cost?
The date under review is January 4. We stop at December 31, 2020, the preceding session, and open AlpharvestPro’s replay of that close. The January 4 date is not a documented fill, initial stop, or account weight.
What AlpharvestPro’s replay shows at the Dec. 31 close
AlpharvestPro’s history archive replays today’s presets, relative strength and Market Compass over 2020–2021 prices. It uses the current stock roster, so it carries survivorship bias. ANF is here because it is one of Minervini’s 2021 setups, not because the app selected it. The replay shows how AlpharvestPro’s tools read the chart at the cutoff, not what any screen displayed in 2021 or what Minervini used.
| At the Dec. 31 close | AlpharvestPro replay |
|---|---|
| AlpharvestPro Market Compass (provisional) | Confirmed Uptrend since the S&P 500’s Nov. 4, 2020 follow-through day. All five tracked indexes closed above their 50- and 200-day averages; the S&P 500, Dow and NYSE Composite closed at new highs. |
| AlpharvestPro RS (reconstructed, current roster) | 81. Earlier readings: 88 on Dec. 2 (20 sessions before), 77 on Oct. 1 (63 sessions) and 30 on July 2 (126 sessions); its range over the last 63 sessions was 77–94. |
| Price and averages | $20.36, above the 50-day average of about $19.01 and the 200-day average of $13.46. |
| AlpharvestPro presets in the week before Jan. 4, 2021 | Five sessions, Dec. 24 to Dec. 31: AlpharvestPro RS Leaders, every session; AlpharvestPro Trend Template, every session; AlpharvestPro AVWAP Pullback Watch, on Dec. 24 and Dec. 28; AlpharvestPro VCP Setup, on Dec. 24 and Dec. 28; AlpharvestPro CCI Healthy Pullback, on Dec. 28; AlpharvestPro VDU Pullback Watch, on Dec. 24, Dec. 28 and Dec. 29. These replays agree closely with the live app, except VDU Pullback Watch, which agrees moderately. Also shown, but not relied on because its replay agrees poorly with the live app: AlpharvestPro NR7 Squeeze, on Dec. 30. |
| AlpharvestPro presets the stock was on | AlpharvestPro RS Leaders, every session since Sept. 14; AlpharvestPro Trend Template, every session since Nov. 3. Both replays agree closely with the live app. |
| AlpharvestPro early-Stage-2 check | Not passed, on one condition only: the stock had already advanced far above its base low. |
| Industry peers | Apparel Retail: the two largest companies by today’s market value that traded then; the choice uses today’s knowledge, the readings do not. TJX Companies, Inc. (The) (TJX): RS 52; on AlpharvestPro Trend Template; 0.9% below its 52-week high, above its 50-day average; up 20% over three months. Ross Stores, Inc. (ROST): RS 56; on AlpharvestPro Trend Template; 0.8% below its 52-week high, above its 50-day average; up 30% over three months. ANF’s RS of 81 was above both. |
In the week before January 4, the replay showed more than the trend. AlpharvestPro VCP Setup listed ANF on December 24 and 28, and three pullback-watch presets listed it on the same quiet days: AlpharvestPro AVWAP Pullback Watch on December 24 and 28, AlpharvestPro VDU Pullback Watch on December 24, 28 and 29, and AlpharvestPro CCI Healthy Pullback on December 28. VCP Setup is the app’s own volatility-contraction screen, not Minervini’s count, but it points the same way as the volume figures below: a tighter, quieter pause after the November high.
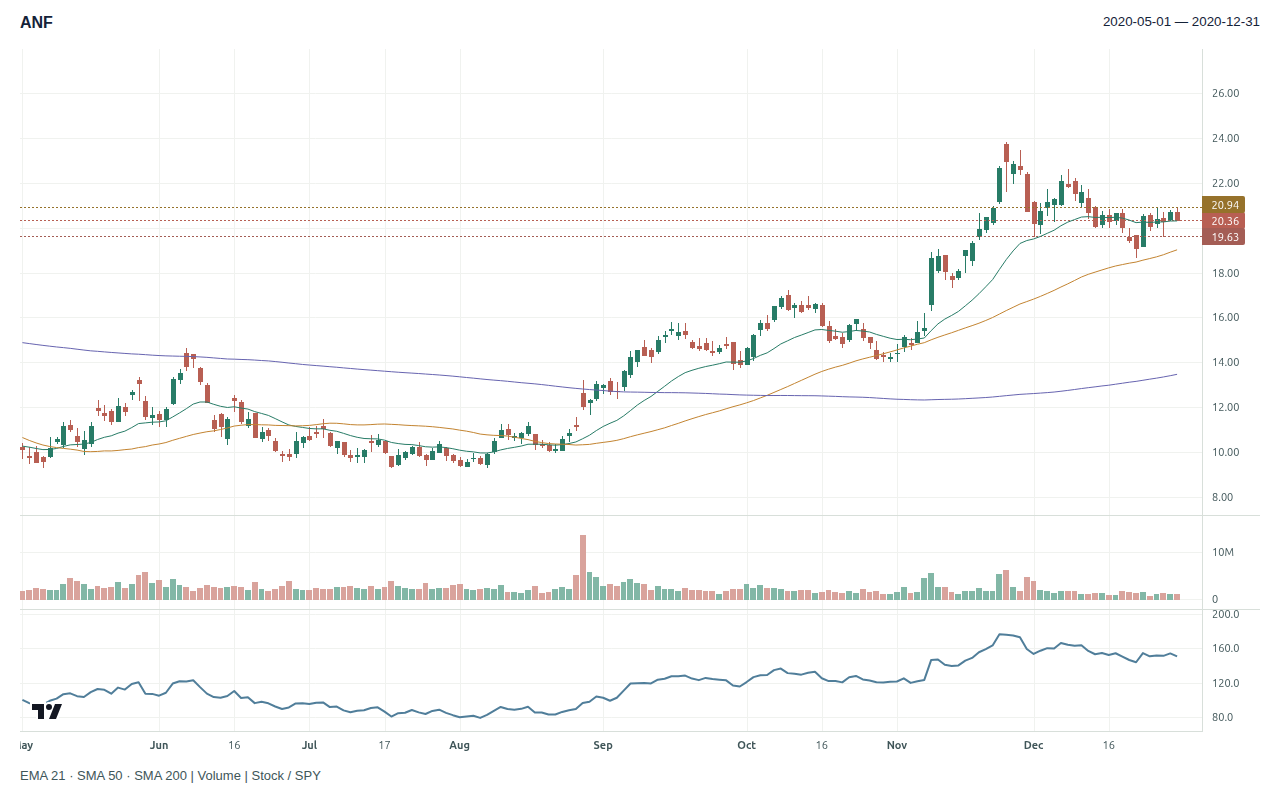
The backdrop and the trend agree: a confirmed market uptrend, every condition of the AlpharvestPro Trend Template met, and RS in the low 80s after slipping during the pullback. The AlpharvestPro Trend Template is the app’s own implementation of the template Minervini published, and it differs from the book in detail. The decision chart below shows the autumn advance to the Nov. 24 high of $23.82, a pullback, and a quieter final week of December, when daily volume ran between a quarter and six-tenths of its 50-session average.
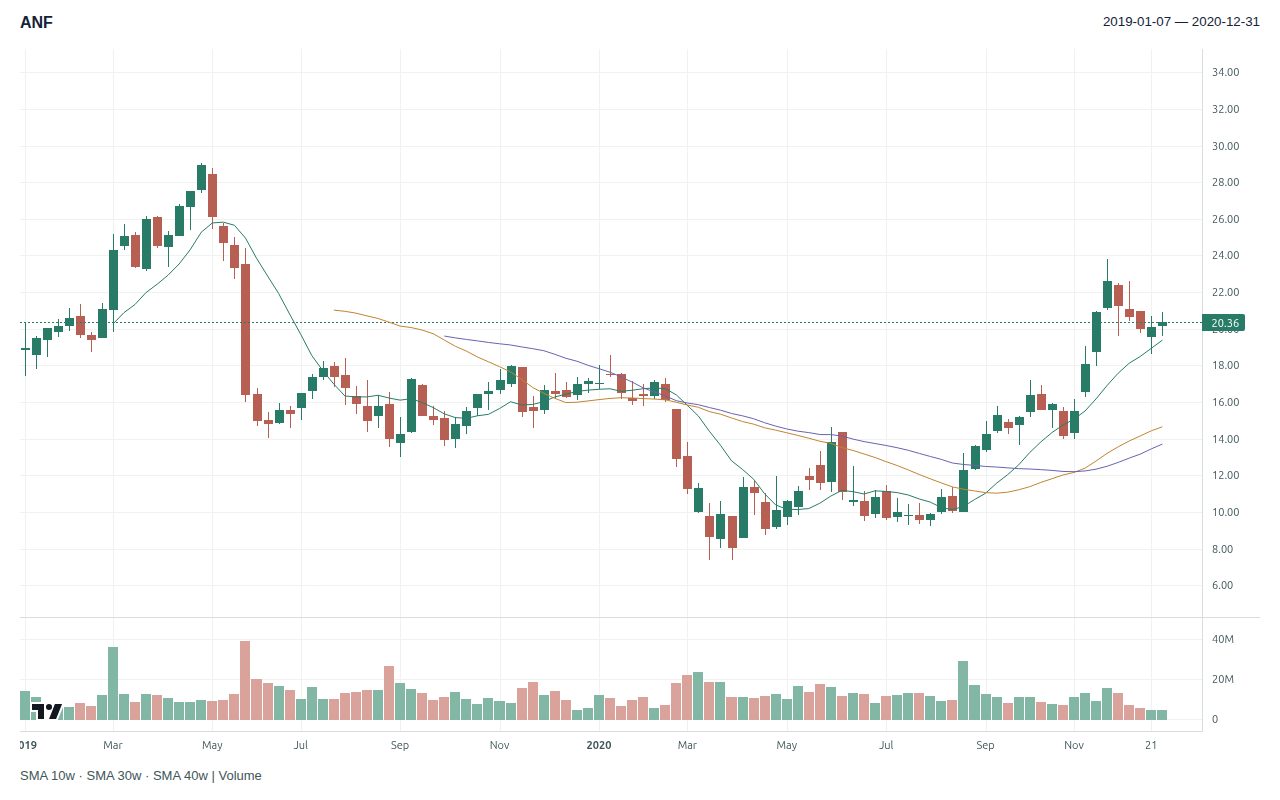
AlpharvestPro’s early-Stage-2 check is stricter than Minervini’s own template, which notes that “many of the best selections will be 100 percent, 300 percent, or greater above their 52-week low before they emerge from a solid consolidation period.” Here it is a reminder that the turnaround was no longer young, not a disqualification. A candidate had emerged, and the November high had not become irrelevant merely because the stock was recovering. None of these readings establishes that ANF satisfied every SEPA element.
Agreement with the live app is the replay’s median daily overlap with the live AlpharvestPro app’s stored preset results from July 7 to November 6, 2026. A preset with low agreement is shown when it appears, but it is not relied on.
Prior-close market and screening context · 2020-12-31
| SPY adjusted close | +4.81% versus its 50-session average |
| VIX close | 22.75 |
| AlpharvestPro RS (reconstructed) | 81 · current stored roster, not a 2021 published ranking |
| AlpharvestPro Market Compass (provisional) | Confirmed Uptrend |
| AlpharvestPro presets (33 of 36; 3 left out for near-zero agreement) | 2 of 25 evaluated at close or moderate agreement listed the stock; 0 of 8 at low agreement, shown but not relied on; 0 could not be evaluated |
Retrospective context. Compass headlines and preset membership have unresolved validation limits; distribution-day counts and broad breadth classifications are withheld. No screen output proves a historical order or full SEPA qualification.
What the screen could not show
AlpharvestPro’s presets read price, volume and relative strength. The business evidence has to come from the company. Abercrombie & Fitch’s November 24 third-quarter release described an uneven recovery. Net sales fell 5% to about $820 million, while digital sales grew 43% to $382 million. Gross margin reached 64.0%, up 390 basis points. GAAP diluted EPS rose to $0.66 from $0.10; adjusted EPS was $0.76 versus $0.23.
That is a margin-and-channel story rather than a claim that every operating measure was accelerating. The pandemic still complicated store operations and fulfillment. A plausible reading under Minervini’s published rules is that improving profits could justify attention, while falling total sales and operational uncertainty required further scrutiny. We cannot establish that this was his personal reasoning.
From a recovery story to a decision
| SEPA element | Dated evidence and interpretation | Disposition |
|---|---|---|
| Trend | Dec. 31: on AlpharvestPro RS Leaders and Trend Template; AlpharvestPro RS 81; early-Stage-2 check not passed. | Supported price trend; classification mixed |
| Fundamentals | Nov. 24 release: improved EPS and margin; total sales down 5%. | Supported improvement; mixed growth |
| Catalyst | Digital growth and margin improvement were already public; no verified new Jan. 4 catalyst. | Insufficient entry-day evidence |
| Entry point | Right-side recovery visible; exact historical order and intraday trigger unknown. | Conditional scenario only |
| Exit planning | No documented stop or exit instructions. | Insufficient actual-trade evidence |
In Chapter 3 of Trade Like a Stock Market Wizard, Minervini puts trend alongside fundamentals, catalyst, entry, and exit planning. AlpharvestPro’s presets speak to the first of those. For this case, that means resisting the temptation to let a good trend stand in for the whole decision.
The teaching plan uses Minervini’s structure with our own fixed conventions. After the December 22 base low, ANF paused for five sessions, December 24 to 31, in a 6.2% range on light volume, still 12.1% below the November 24 base high. Minervini calls a buy point inside the base like this the cheat: “the earliest point at which you should attempt to buy any stock” (Think & Trade Like a Champion). The trigger sits one cent above the pause high, at $20.94, and the stop one cent below its low, at $19.63: a 6.26% risk, inside his 10% ceiling. It is a reconstruction from the chart, not a recovered Minervini order.
| Teaching calculation | Archive-adjusted units |
|---|---|
| Final contraction | 2020-12-24 to 2020-12-31 |
| Illustrative account / risk budget | $40,000 / $400 (1%) |
| Conditional trigger / stop | $20.94 / $19.63 |
| Risk per share / distance | $1.31 / 6.26%, within Minervini’s 10% ceiling |
| Whole shares / planned stop loss | 305 / $399.55 |
| Position value / account exposure | $6,386.70 / 15.97% |
A teaching calculation with fixed conventions of our own: trigger 1¢ beyond the final contraction’s high (low for a short) and stop 1¢ beyond its other side, read from bars up to the cutoff, sized so the loss at the stop stays within $400. The 10% ceiling is Minervini’s: “keep your losses to 10 percent or less” (Think & Trade Like a Champion).
A trader could condition entry on price clearing the trigger without a large gap or an immediate loss of support. If price opened well above the trigger, the share count and risk would need to be recalculated before acting. The stop would not be widened after entry to accommodate a larger loss. If the trade works, the exit scenario in the reveal applies fixed rules adapted from Minervini’s guidance in Think & Trade Like a Champion: the stop moves to breakeven once the price has risen three times the risk, and once the 50-day average catches up with the entry, a close below it ends the trade.
Your decision: does this cheat entry offer enough confirmation, or would you wait for the classic pivot at the $23.82 base high? Record that choice before opening the later chart.
Reveal the later ANF price path
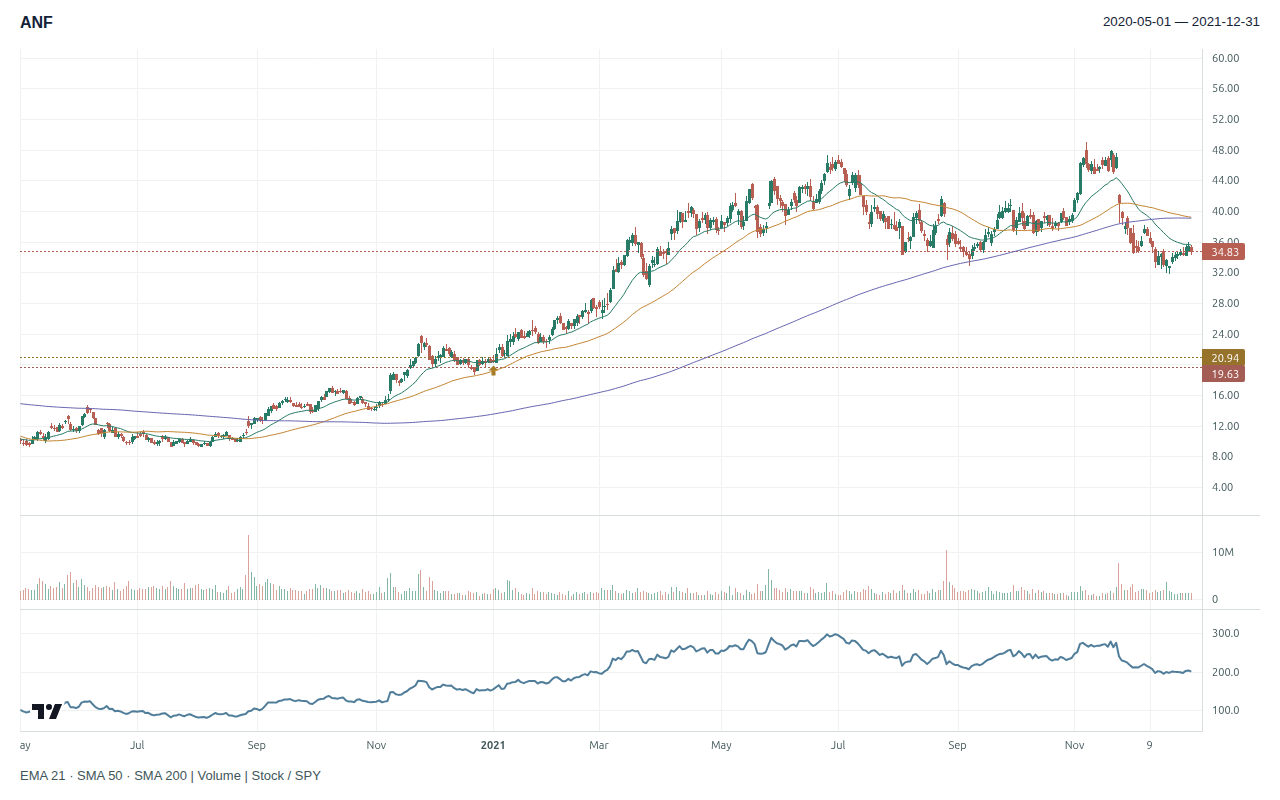
On January 4, ANF traded as high as $21.25 and closed at $20.49. The illustrative trigger was within the day’s range, but the close finished below it. A closing chart alone cannot identify when a real order filled or how a trader handled the reversal.
AlpharvestPro at the January 4 close. All five indexes fell that day, the S&P 500 by 1.48%, and AlpharvestPro Market Compass still read Confirmed Uptrend. ANF’s AlpharvestPro RS stayed at 81. The replay added AlpharvestPro VDU Pullback Pocket Pivot, on 1.10 times its average daily volume over the previous 50 sessions. Its replay agrees poorly with the live app, so this article does not treat the day as a confirmed pocket pivot.
The archive subsequently records a high of $48.97 on November 5 and a December 31 close of $34.83. Those are stock-price observations. They do not show that Minervini held from January to November, sold near the high, or earned the percentage that a line between two convenient prices would imply.
| Hypothetical exit scenario | Through December 31, 2021 |
|---|---|
| Entry | 2021-01-04 at $20.94 |
| Initial stop | $19.63 |
| Stop changes | 2021-01-21: 50-day average reached the entry; 2021-01-25: stop raised to breakeven |
| Exit | 2021-05-20 at $37.41 (close below the 50-day average) |
| Result | +78.65% · +12.57 R · +$5,023.35 on 305 shares |
Fixed rules adapted from Minervini’s guidance in Think & Trade Like a Champion: the initial stop; the stop to breakeven once the price has moved three times the risk; and, once the 50-day average reaches the entry, an exit on a close beyond it (“breakeven or better”). Selling into strength is not modelled. Our conventions: a stop change takes effect from the next session; an exit on a close is valued at that close; an entry that opens past the trigger is resized to keep the $400 risk. Daily bars cannot show the order of moves within a day. R is the initial risk per share. A teaching scenario, not Minervini’s trade; no costs, borrow or slippage.
The first lesson of the journey
In AlpharvestPro, a stock on RS Leaders and the Trend Template has earned a look, not an order. ANF’s improving economics made it worth investigating; the defined entry and failure level made the investigation actionable. When a preset brings you a recovering stock, write the business reason in one sentence, check how far the stock has already come from its base, then write the price at which the proposed trade no longer makes sense.
Reading and chart notes: Minervini, Trade Like a Stock Market Wizard, Chapter 3; company release dated November 24, 2020; AlpharvestPro history archive (reconstructed prices, RS, presets and Market Compass) through the stated cutoff. RS uses the current stored roster, not a 2021 published ranking. The case was selected retrospectively; all illustrative prices use revised archive units. No actual fills, costs, size, or realized return are established.
AlpharvestPro wrote and published this independent research journal. AlpharvestPro is not affiliated with or endorsed by Mark Minervini.

