The five holdings, their charts and their orders
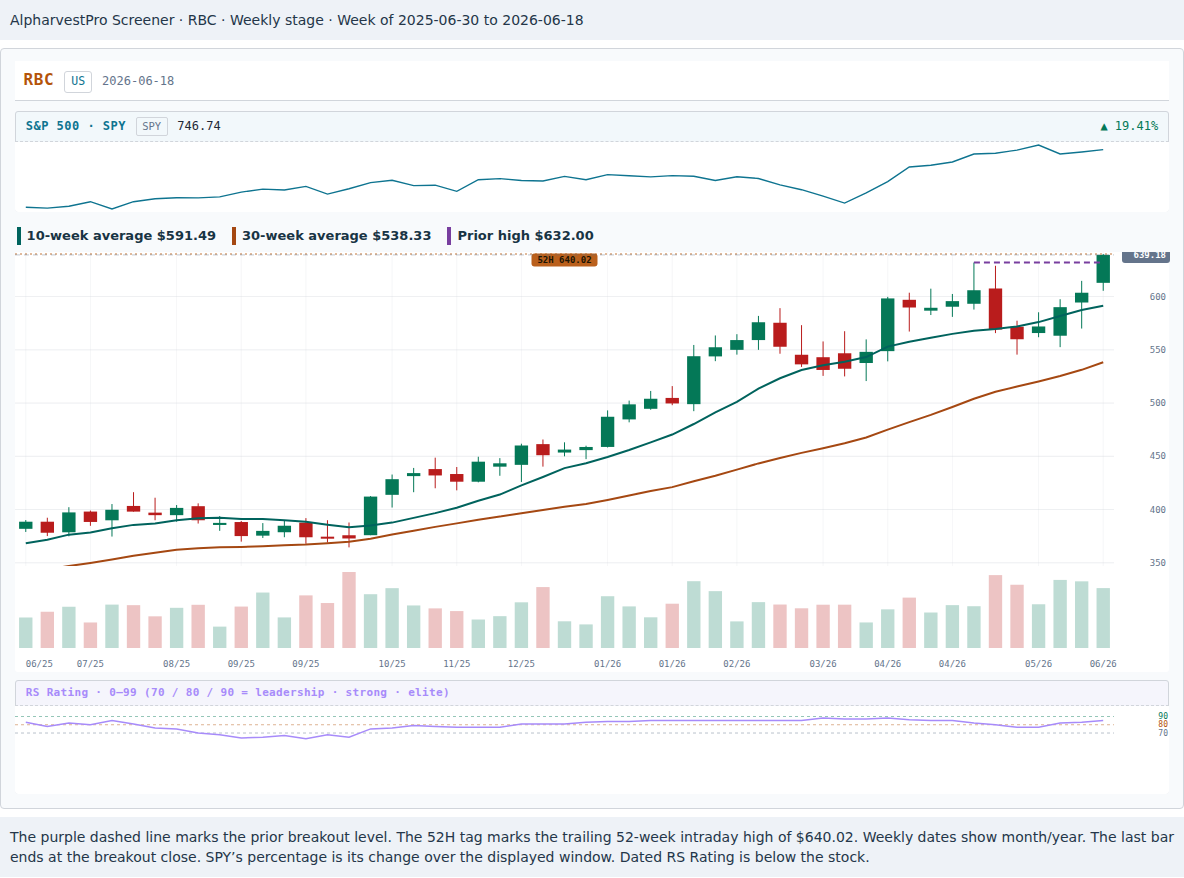
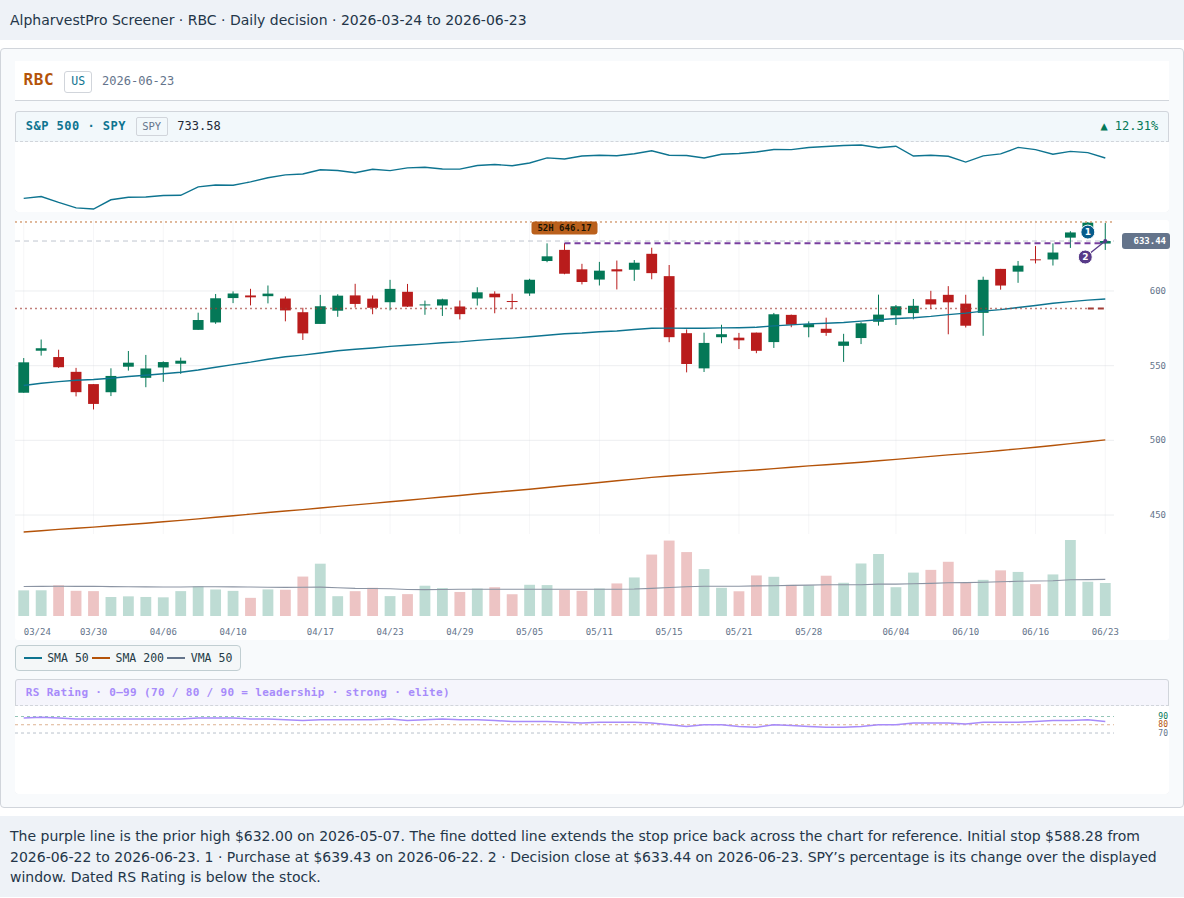
The June 23 decision uses the positions that were still open at that close. Each weekly chart stops at the original breakout, including the unfinished week. Each daily decision chart stops on June 23. In the US Screener charts, SPY is above the stock and the dated RS Rating is below it.
Purchase prices, position values and planned losses (CSV) · Dated market readings (CSV)
| Holding | Position cost | Initial risk | App industry group | Group rank | RS at breakout |
|---|---|---|---|---|---|
| SharkNinja | $4,987.32 | $398.97 | Hsehold-Appliances/Wares | 46 | 76 |
| Affiliated Managers Group | $4,990.65 | $399.30 | Finance-Investment Mgmt | 147 | 83 |
| Entegris | $4,853.40 | $388.20 | Elec-Semiconductor Equip | 4 | 91 |
| Ames National | $4,986.62 | $399.13 | Banks-Midwest | 28 | 84 |
| RBC Bearings | $4,476.01 | $358.05 | Metal Proc & Fabrication | 26 | 85 |
The stock return used to order the holdings is the June 23 close divided by the entry price, less one. The RS Rating and group rank in the table belong to the earlier breakout date. The app’s latest stored classification for each of these five names is dated February 4, 2024. We used the group rank published for each breakout session. Its archived copy predates the purchase open. The stock RS series identifies the session, but its original posting time is unavailable.
The liquidity check required an average of at least 50,000 shares per session over the 50 sessions before the breakout. Each position was capped at 5% of that average share volume. Dollar turnover (price × shares) settled ties after the six checks. For example, Ames averaged 63,352 shares per session before its breakout.
Purchase evidence and decision charts
SharkNinja (SN)
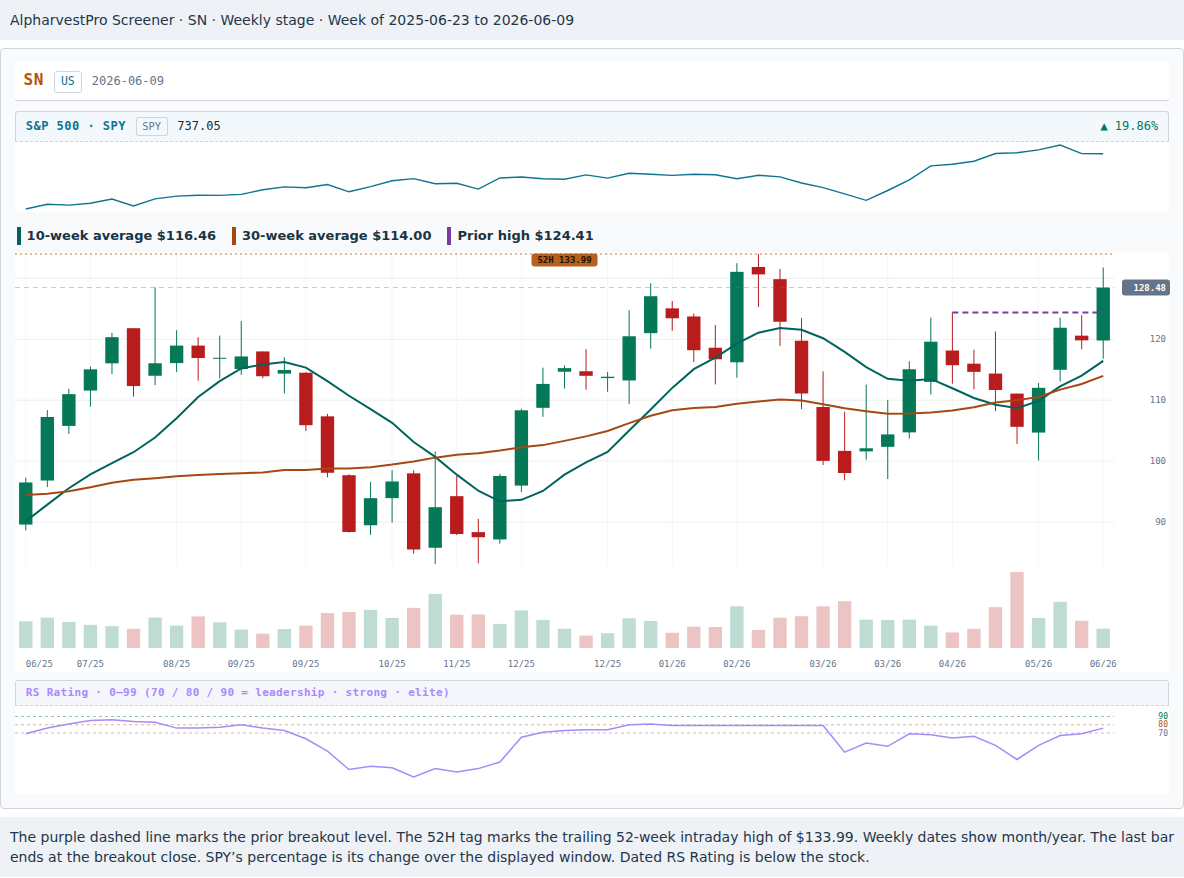
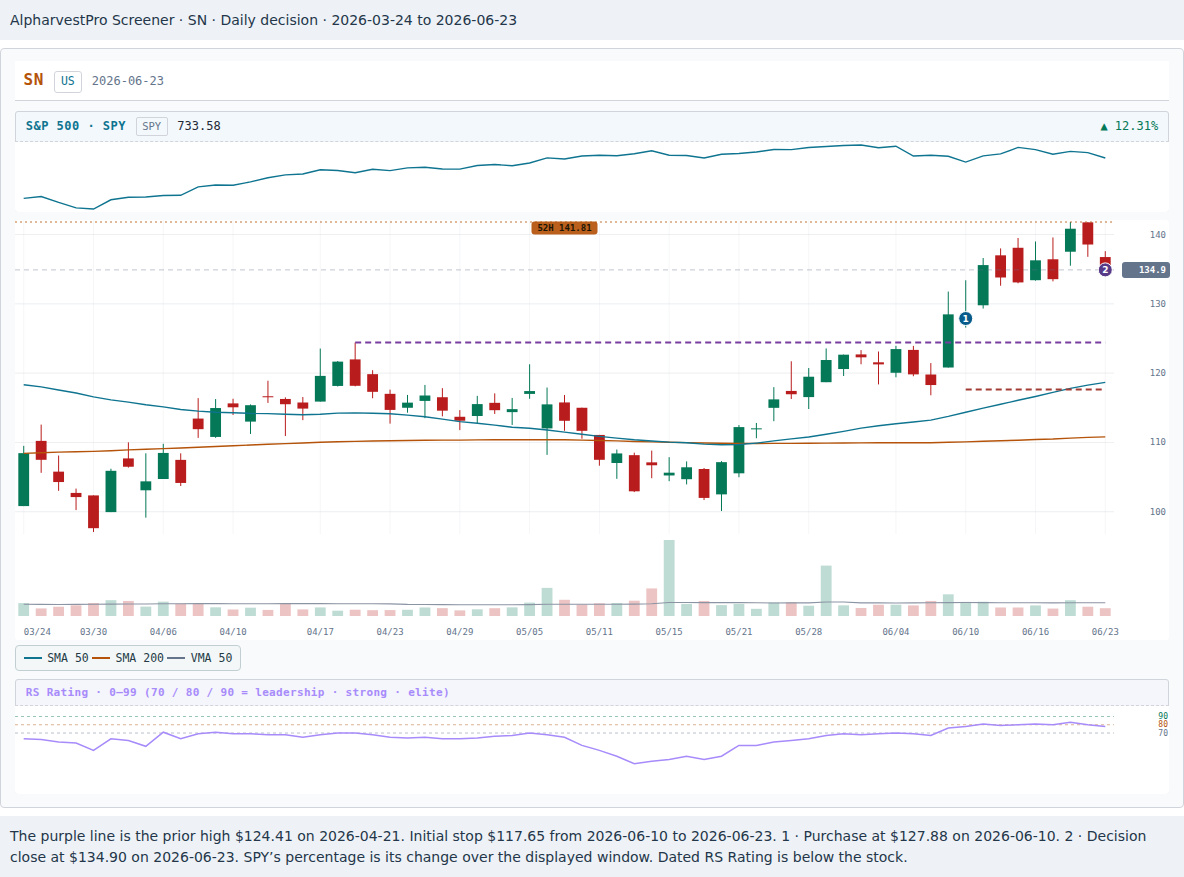
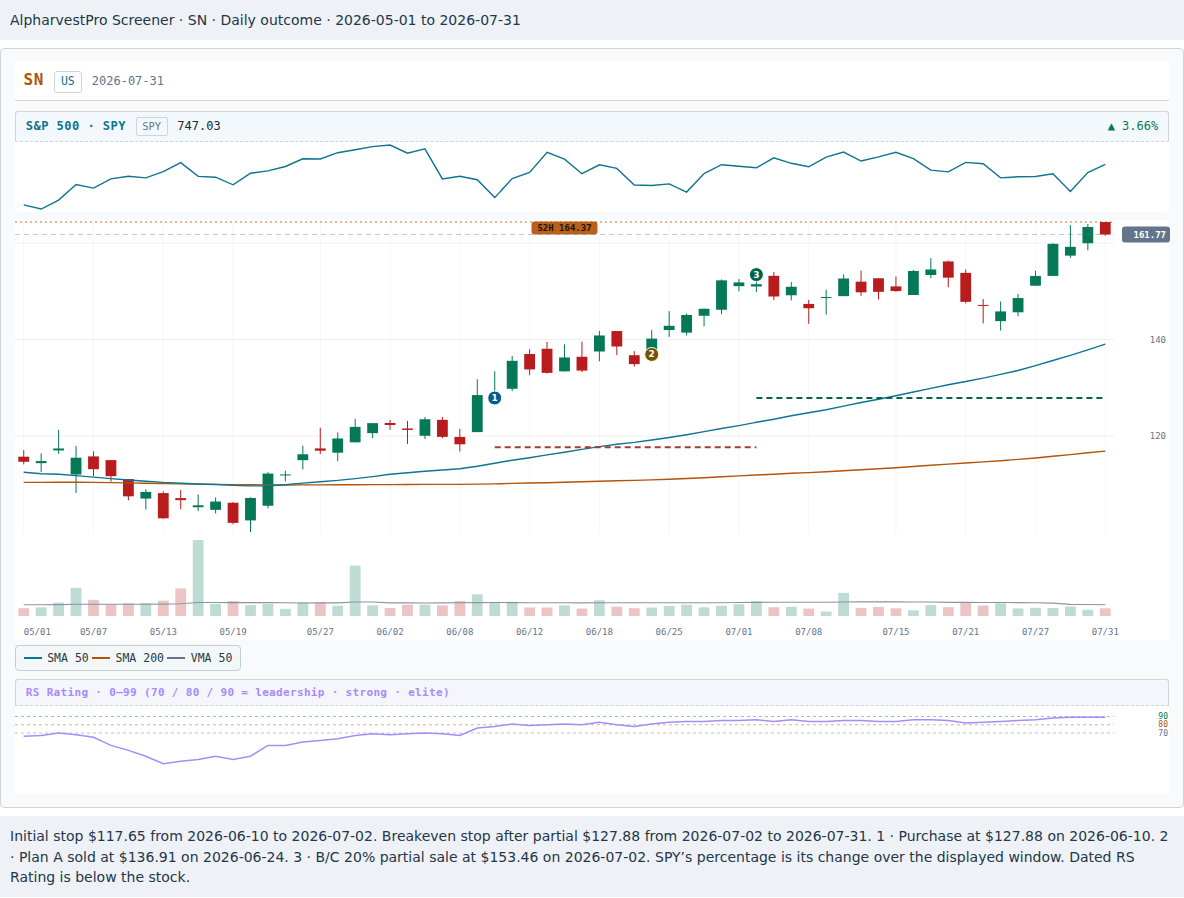
On June 9 the older record showed a pocket pivot. The breakout close was June 9, on 1.64 times prior average volume. The as-traded buy point was $124.41. Ninja launched its SLUSHi Twist dual-flavor frozen-drink maker on May 19. Reported quarterly revenue was $1,412.8 million against $1,222.6 million a year earlier. Diluted earnings were $0.85 against $0.83 per share. First-quarter results · Product announcement
Affiliated Managers Group (AMG)
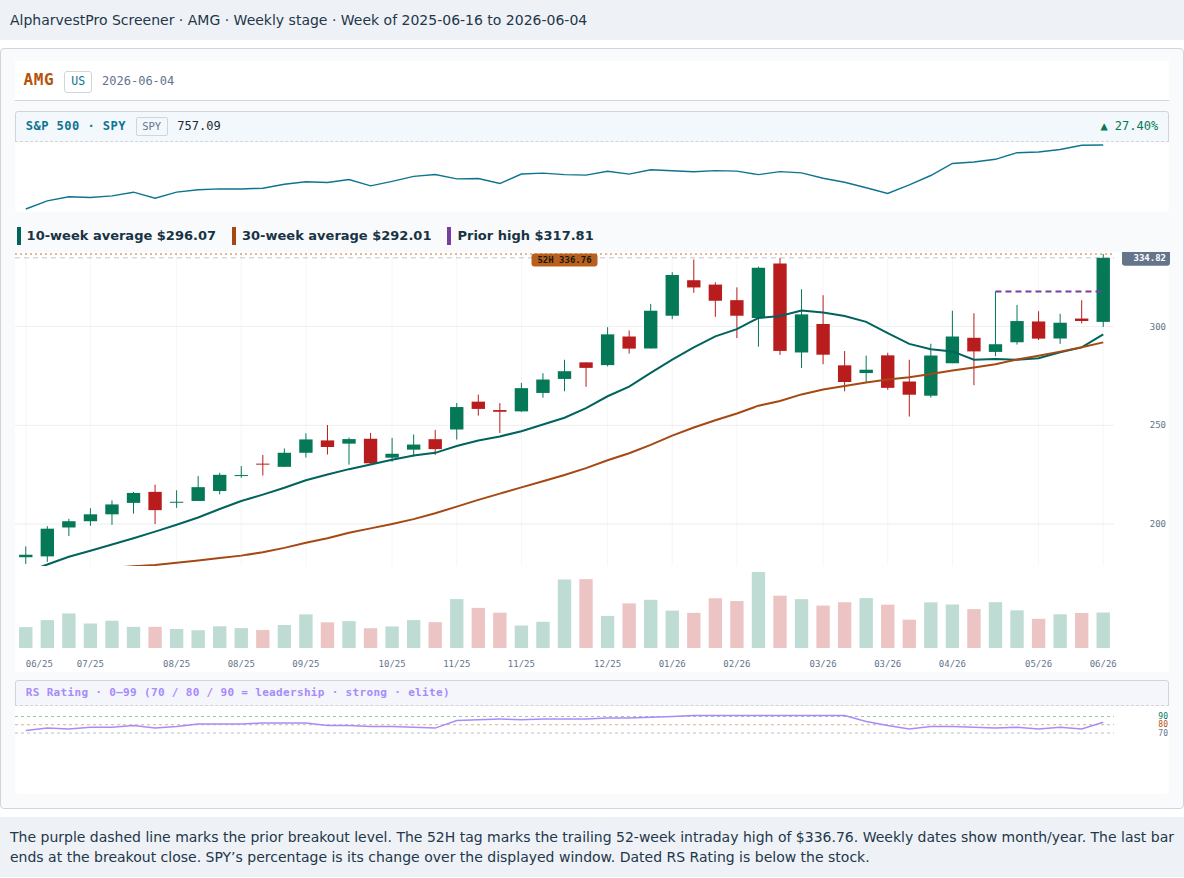
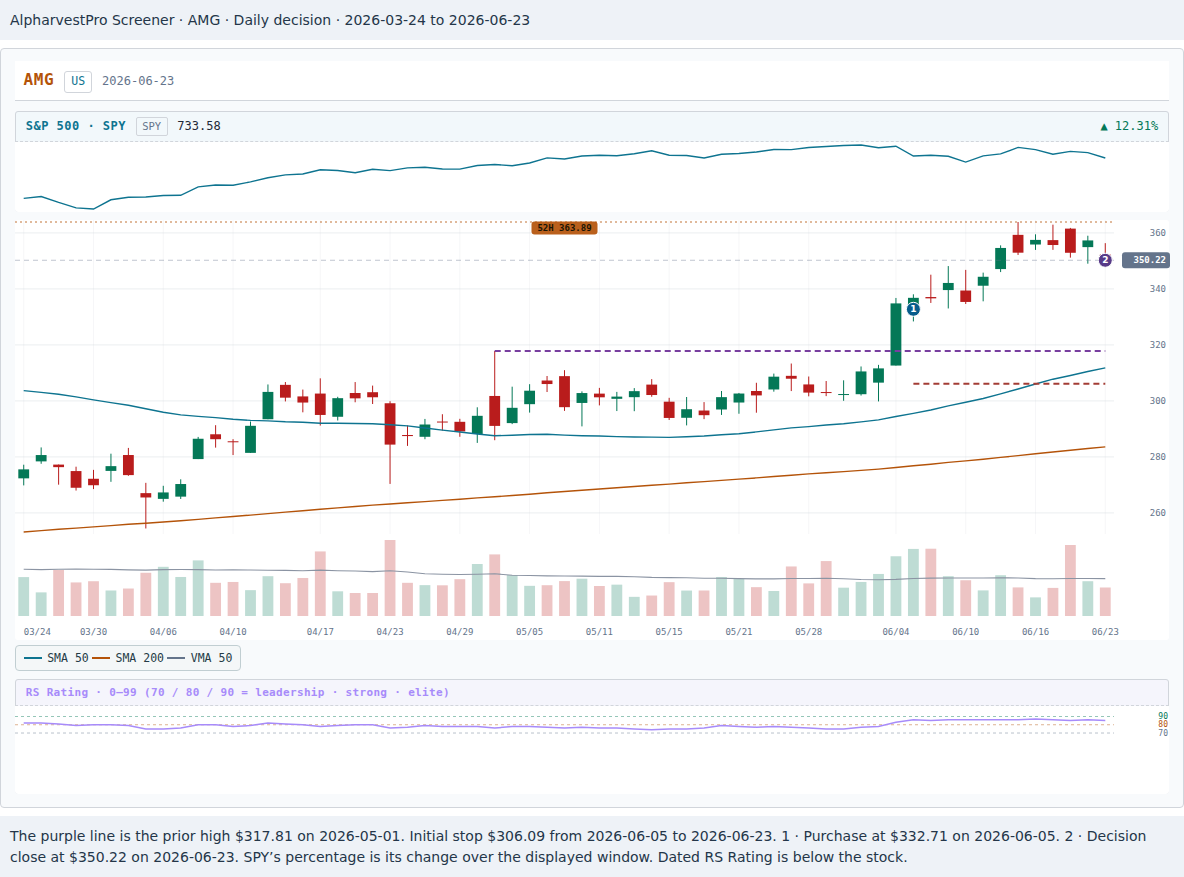
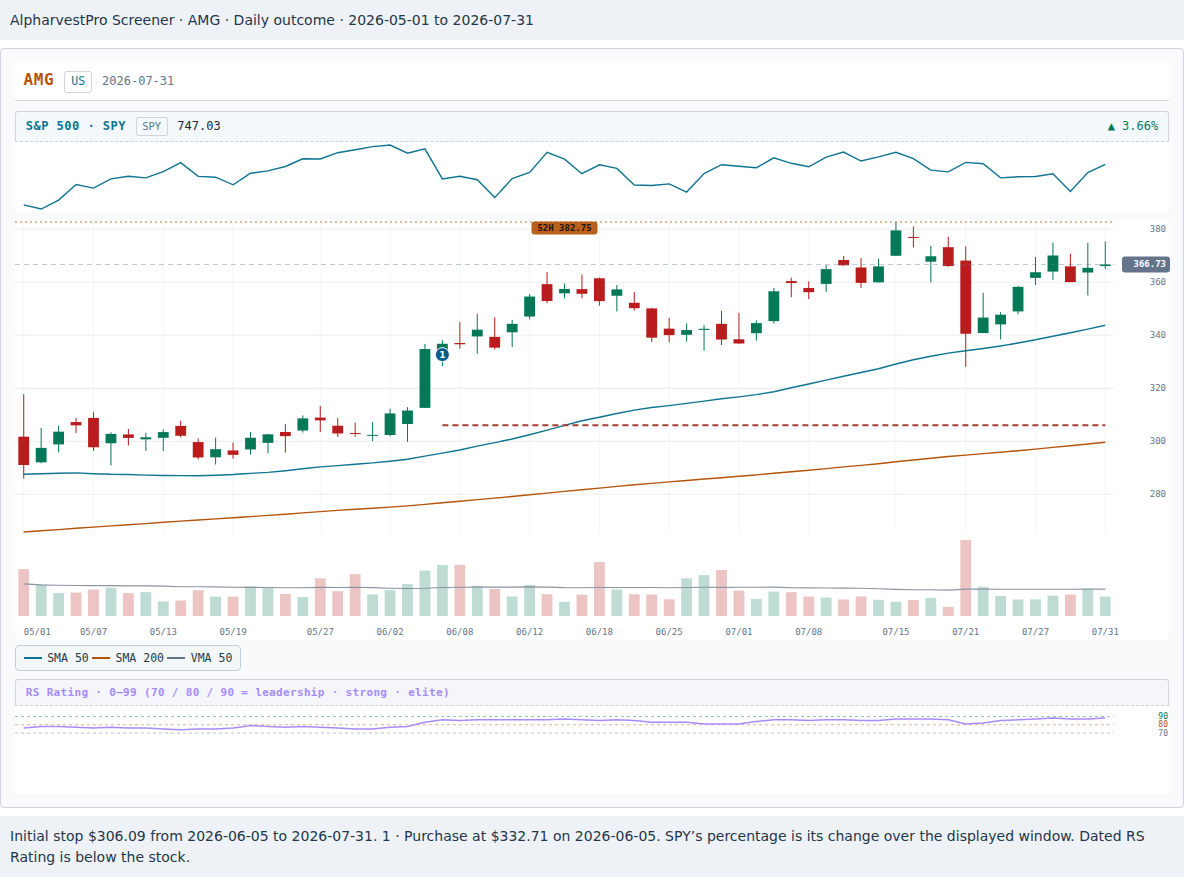
On June 4 the older record showed a pocket pivot. The breakout close was June 4, on 1.65 times prior average volume. The as-traded buy point was $317.81. Management described a newly registered AMG BBH fund in development on its May 1 call. It described a prospective launch. Reported quarterly revenue was $544.9 million against $496.6 million a year earlier. Diluted earnings were $3.84 against $2.20 per share. First-quarter filing · Earnings call transcript
Entegris (ENTG)
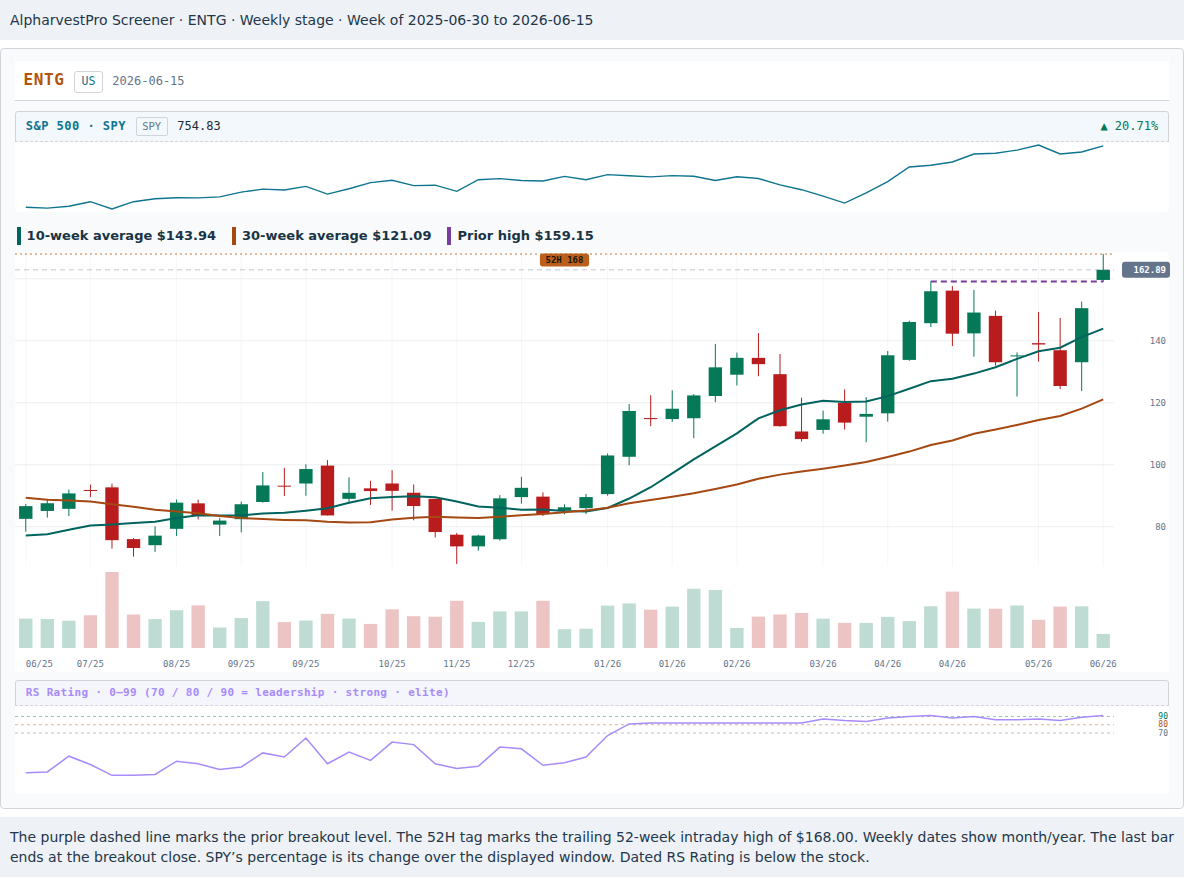
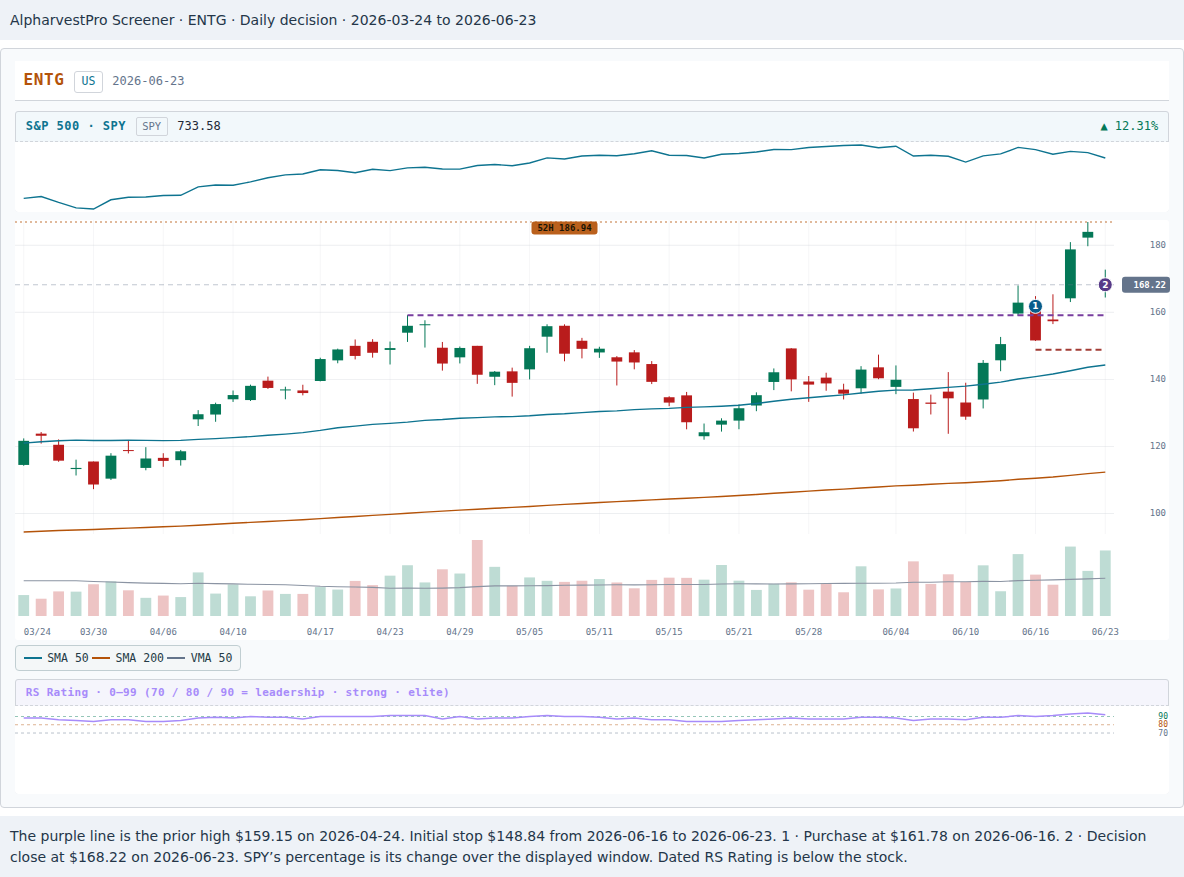
On June 15 the older record showed a buyable gap-up, pocket pivot. The breakout close was June 15, on 1.79 times prior average volume. The as-traded buy point was $159.15. Sukhi Nagesh appointed CFO effective May 18. Reported quarterly revenue was $811.9 million against $773.2 million a year earlier. Diluted earnings were $0.60 against $0.41 per share. First-quarter results · CFO appointment
Ames National (ATLO)
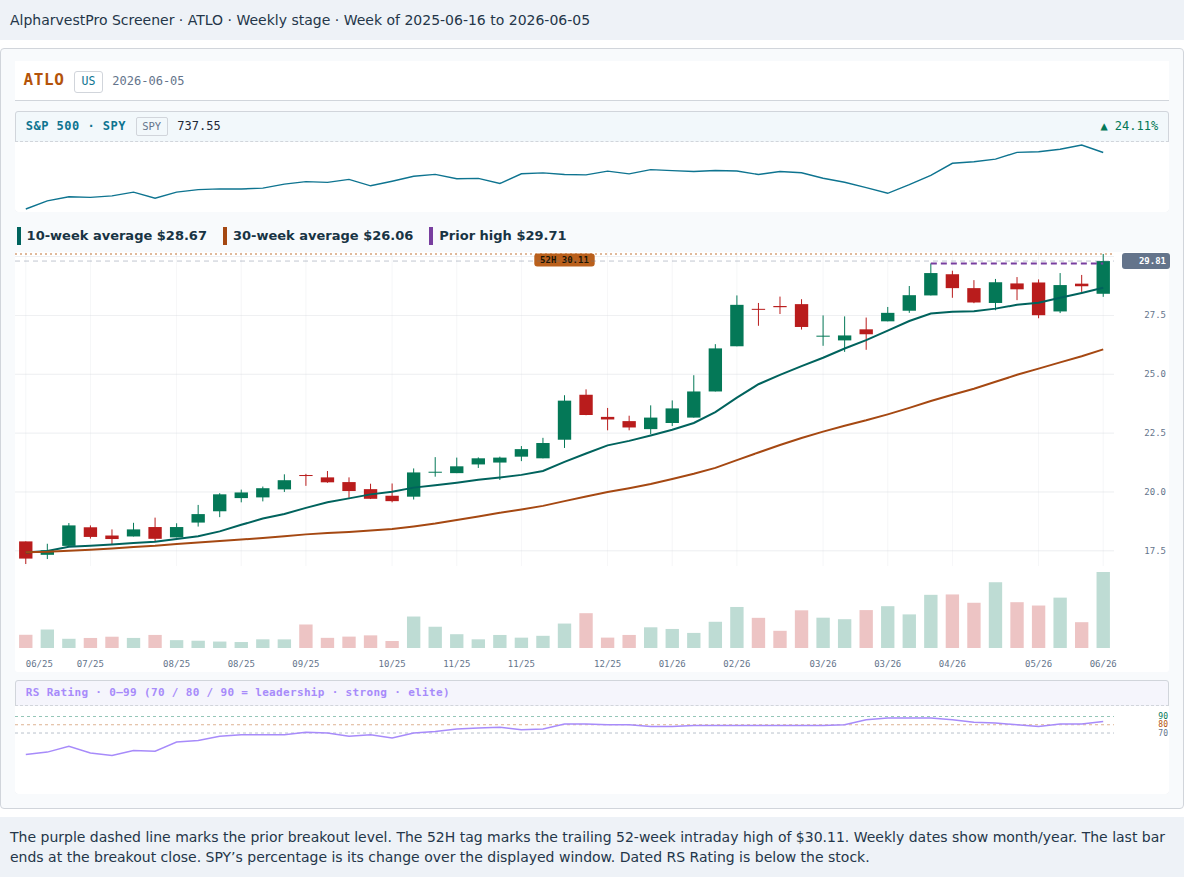
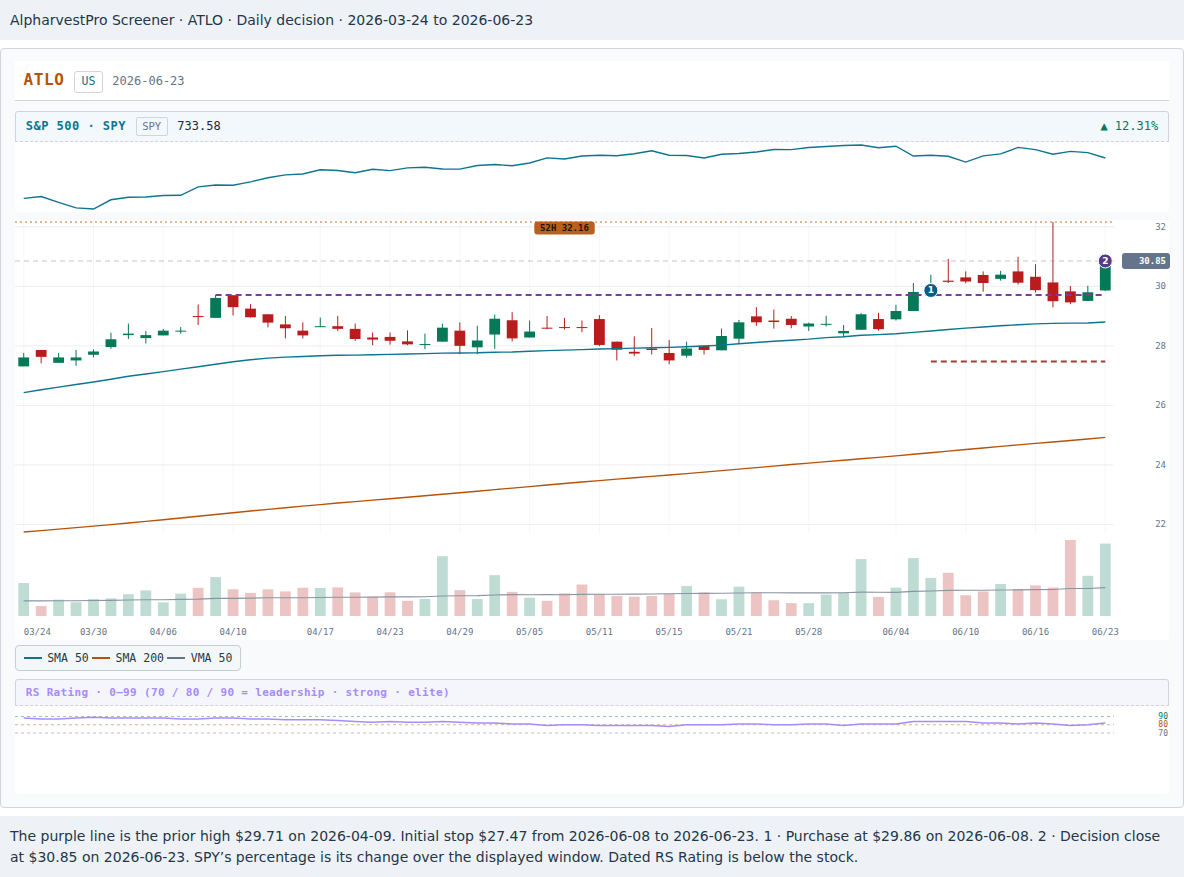
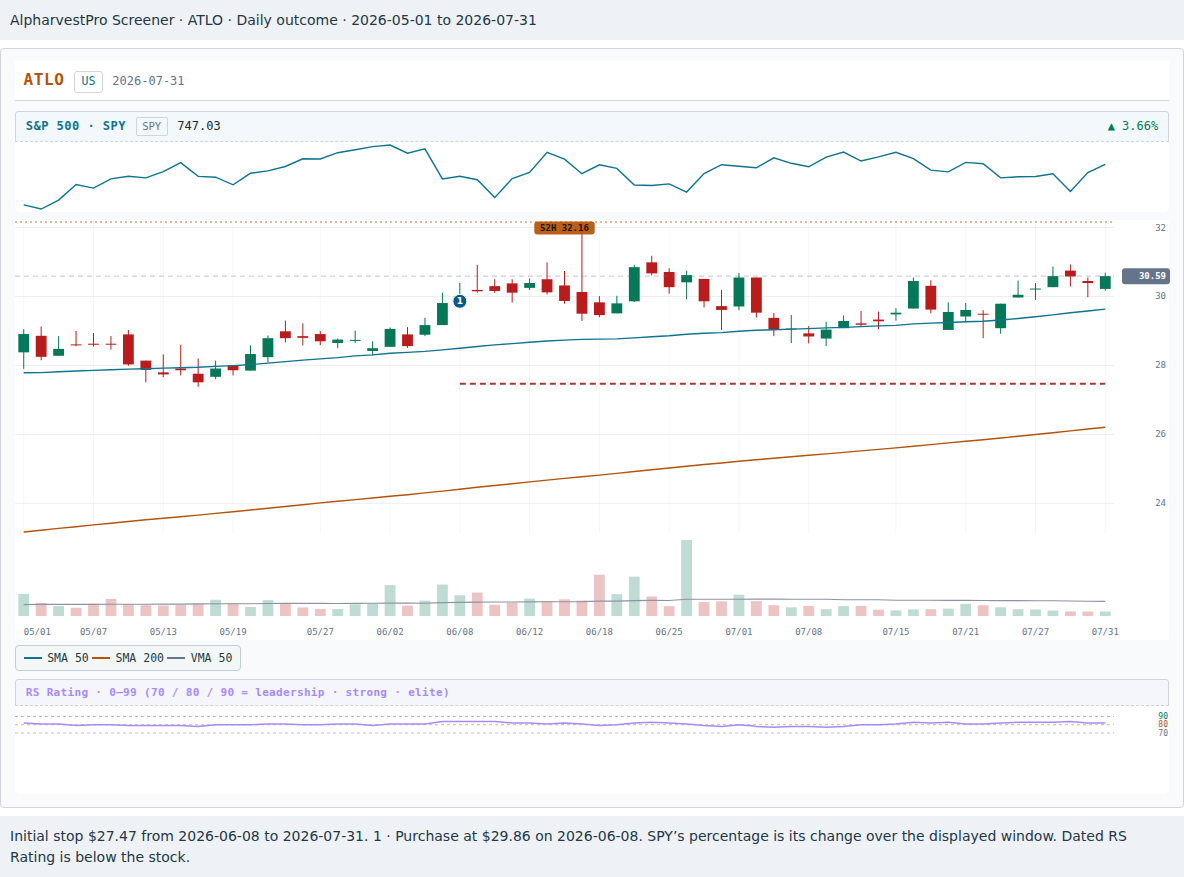
On June 5 the older record showed a pocket pivot. The breakout close was June 5, on 2.45 times prior average volume. The as-traded buy point was $29.71. Shareholders elected Amy F. Rieck as a new board member, per the May 1 filing and March proxy. This is a governance change. The quarter’s net interest income plus noninterest income was $18.216 million against $15.462 million. Basic and diluted earnings were $0.67 against $0.39. First-quarter results · Voting results · Proxy statement
RBC Bearings (RBC)
On June 18 the older record showed a pocket pivot. The breakout close was June 18, on 2.15 times prior average volume. The as-traded buy point was $632.00. The acquired VACCO operation contributed $30.0 million to the latest quarter. The acquisition closed in July 2025. Aerospace & Defense sales increased 41.2% including the acquired business. Reported quarterly revenue was $518.0 million against $437.7 million a year earlier. Diluted earnings were $2.89 against $2.30 per share. Fiscal fourth-quarter results
Open July charts, the complete order ledger and company updates
Every holding through July 31
All purchases and sales by plan (CSV) · Daily account values, realized and open P&L (CSV) · ETF prices through August 4 (CSV) · Full market record through August 4 (CSV)
SharkNinja
Affiliated Managers Group
Entegris
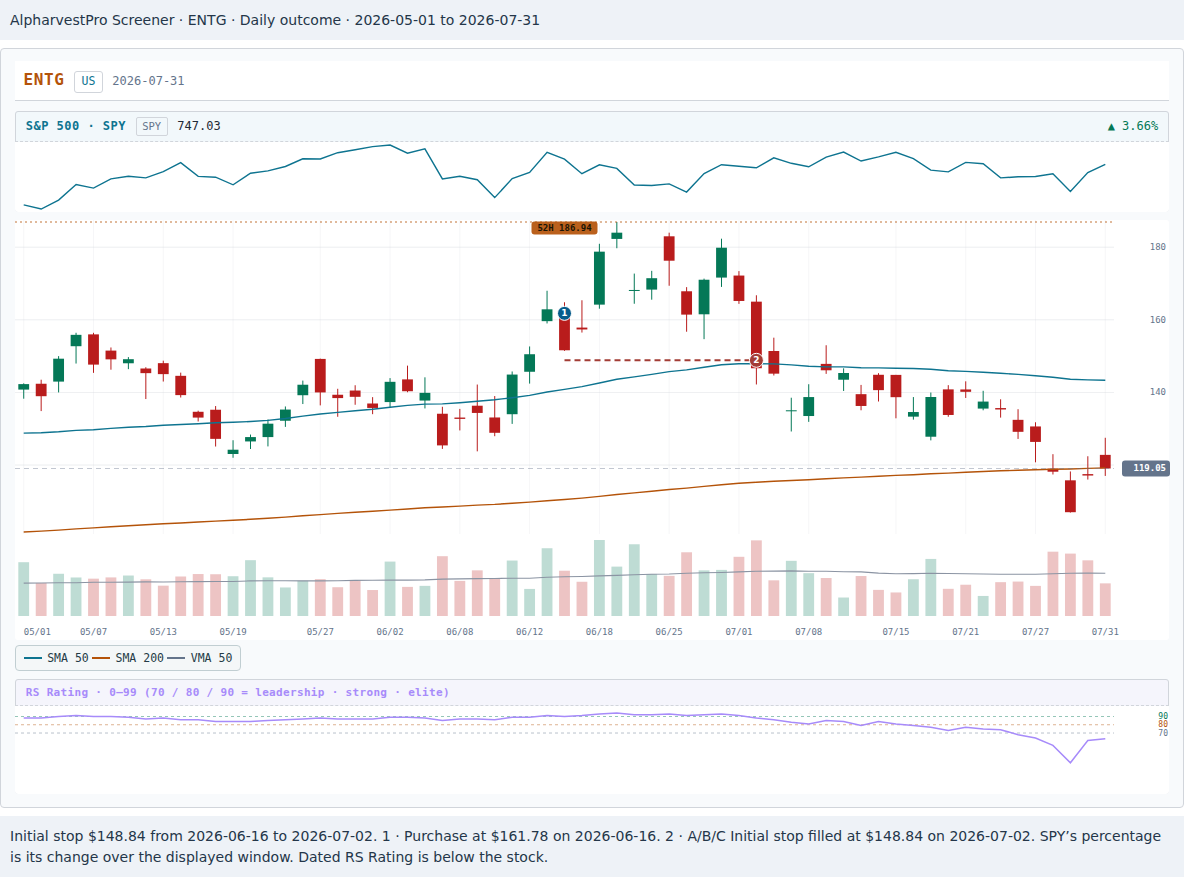
Ames National
RBC Bearings
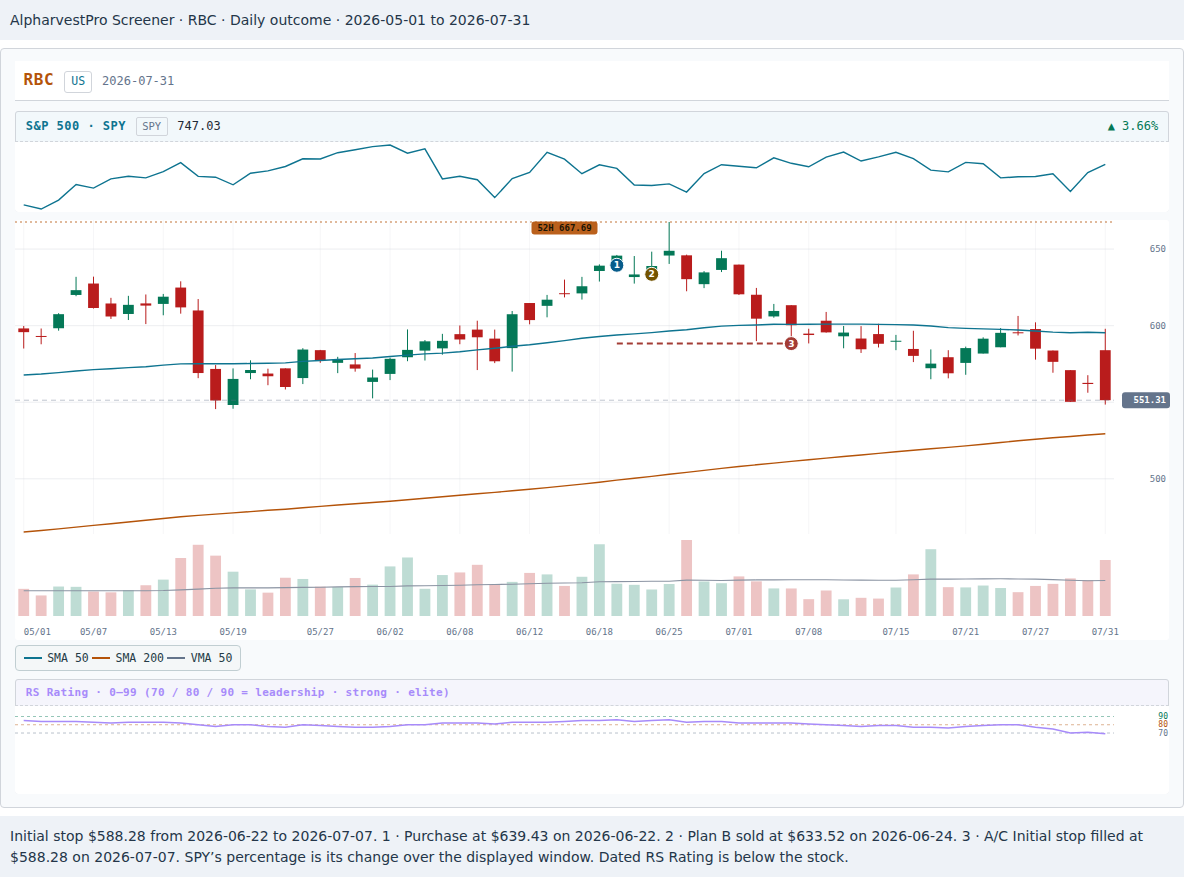
Ames reported quarterly results on July 17, Affiliated Managers Group on July 30 and RBC Bearings on July 31. SharkNinja disclosed a limited insider-policy waiver on July 13. Entegris announced a dividend on July 15 after the modeled exit. The price comparisons attribute no particular move to these filings. Ames results · AMG filing · RBC filing · SharkNinja filing · Entegris filing
Reading and price notes
David Ryan discusses selling order in Section Six of Momentum Masters. William O’Neil discusses which stock to sell first in Chapter 10 of How to Make Money in Stocks. The market pattern comes from Street Smarts, in the chapter “A Picture’s Worth a Thousand Words,” by Laurence A. Connors and Linda Bradford Raschke.
The stock prices come from the stored open, high, low and close without dividend adjustments. The app’s dividend-adjusted chart can show different historical levels. For example, Entegris’s prior high was $159.15 as traded and $158.80 in the adjusted chart we checked. We use integer cents for simulated fills, stops and P&L. Percentage changes for the ETF chart use the underlying unrounded bars. The market CSV distinguishes the as-traded Nasdaq close from the value printed in the original report. A blank market field means there was no archived report for the session. An archive timestamp establishes when that copy was saved. The exact public posting time is unknown.
The ETF figures use the May–July share units. SOXX began trading three-for-one on November 5. For all SOXX chart prices we multiplied the vendor’s full-precision split-adjusted OHLC by three before rounding. Its June 22 high was $655.95 at the time, equivalent to $218.65 on the later share basis. This changes the displayed dollars equally across the window and preserves percentage moves. iShares split filing
For the ETF rallies, the first measuring window starts May 1. Both funds made their first measured lows on May 1. The second rallies started from May 19 lows and the third from June 9 lows. The archived ETF highs and lows may have changed order within any one daily bar. ETF decision-window data (CSV)