
The stock is still inside its base. There is no new high to point to, and the buy point everyone is watching sits above the price. Then one session brings more buying volume than any selling day of the past two weeks. Do you buy now, a little earlier and a little lower, or wait for the breakout that everyone will see?
Chris Kacher and Gil Morales built a method around that question. In Trade Like an O’Neil Disciple they describe the flat markets of 2004 and 2005, when “many initial buys at standard, new-high buy points would quickly turn into -7 percent to -8 percent losers within a few days.” Kacher went looking for an earlier entry. In In the Trading Cockpit with the O’Neil Disciples, the two write that he formalized it “through painstaking statistical analysis and the study of thousands of chart examples.” They called it the pocket pivot.
Buying in the pocket
The premise is about who builds a base. Institutions, the authors argue, prefer to buy off the lows, so their buying should leave clues inside the base before the stock breaks out. “In simple terms,” they write, a pocket pivot “is an early base breakout indicator.”
The core test is volume: “On the pocket pivot you want to see up-volume equal to or greater than the largest down-volume day over the prior 10 days.” The comparison is with recent selling, not with an average.
The same chapter surrounds that test with conditions:
- The weekly chart. Candidates should show “constructive basing action,” including “tight price closes within the weekly chart.”
- Trend. “Except in very rare cases,” pocket pivots “should only be bought when they occur above the 50-day moving average.”
- Not extended. The low of the day “should be at a point right at the 10-day moving average or just below it.”
- A quiet lead-up. Volume “should be relatively consistent over the prior 10 days, preferably drying up.”
- The close. In the Cockpit question-and-answer chapter, they “ideally prefer to see the stock close the day at the top end of its trading range.”
The early entry has a specific purpose. In the authors’ words, it can get an investor into a stock “at a lower-risk price point and thereby make it more possible for the investor to sit through a pullback if the all-too-obvious new-high breakout buy point fails initially.” The authors do not treat the early entry and the breakout as rivals: a position taken on a pocket pivot “can be doubled up on” if the stock “stages a standard base breakout.”
Expect many of these trades to fail. In a quiz in the first chapter of Cockpit, the authors answer that “your so-called hit ratio is simply not a factor in investment success.” Morales’s turnaround in 1995 came “despite a hit ratio that was probably around 1 or 2 out of 10.” What pays for the misses is handling the few winners well.
Three checks, in order
A pocket pivot is a daily event, but it means little without the longer picture. This article reads each candidate in three steps:
- The weekly chart: what stage the long-term trend is in, and how far the stock has already come.
- The base: whether the stock is consolidating, and whether the pullbacks are shrinking and the lows rising, the way a volatility contraction pattern (VCP) does.
- The pocket pivot: whether a day of buying inside that base passes the authors’ tests.
AlpharvestPro’s Pocket Pivot (Morales & Kacher) list applies the volume idea within leadership conditions, and its dated record begins on July 16, 2026. The two stocks below each appeared on it once, in August. Both were also on the VCP Setup (Minervini) and Minervini Trend Template lists during their bases. They were chosen after the fact, from a screen that applied the three checks to every US list day, because they pass the daily test alike and differ in the other two.
Step 1: the weekly chart
Stan Weinstein, whose stage analysis reads the long-term trend from the 30-week average, is blunt: “Stocks trading beneath their 30-week MAs should never be considered for purchase.” In his Stage 2, the advancing phase, “each successive rally peak is higher than the last,” and “the lows on corrections are also progressively higher.”
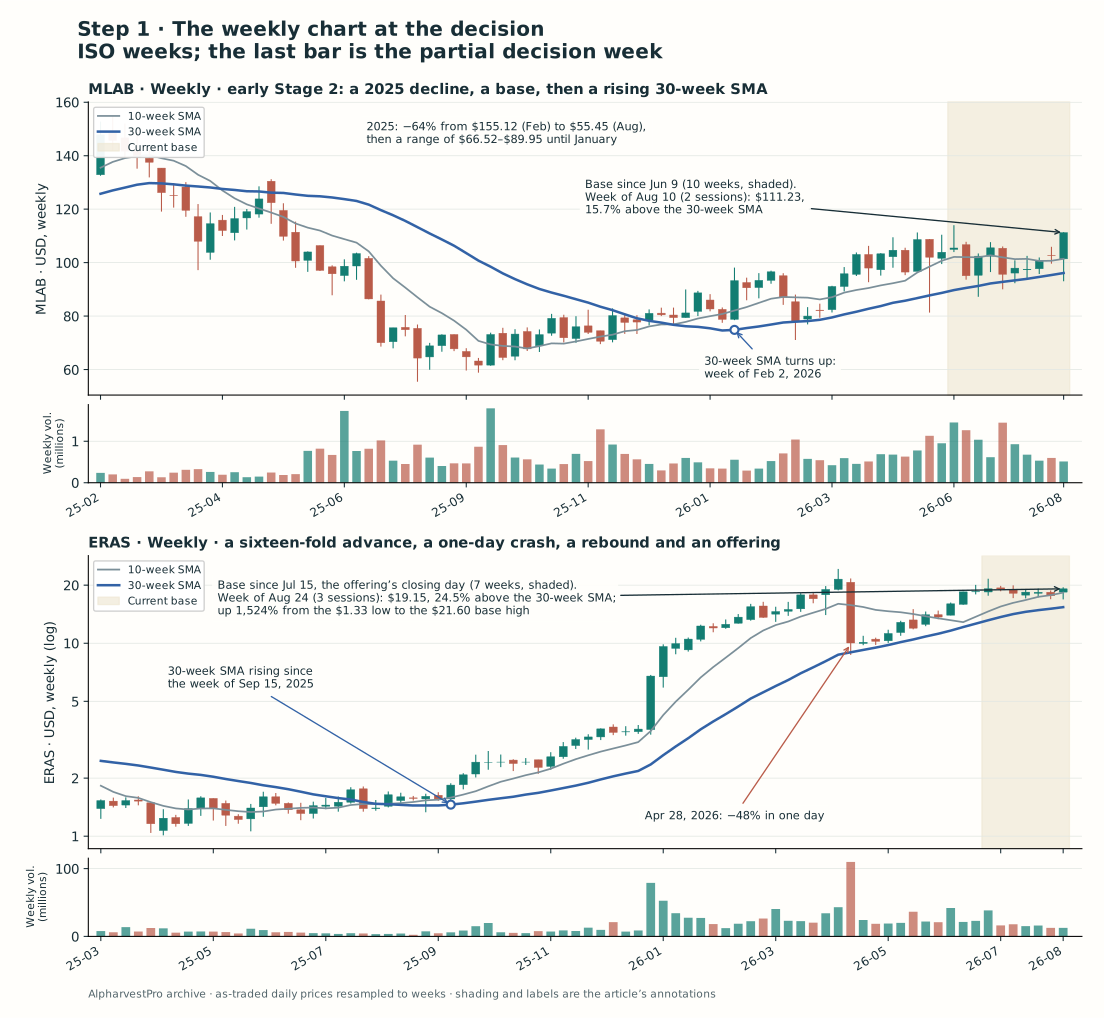
Weekly decision view. Weeks run Monday to Friday; the last bar is the partial decision week. The base shading is this article’s reading of the chart. Download the weekly observations.
| Weekly view at the list day | MLAB (Mesa Labs) | ERAS (Erasca) |
|---|---|---|
| 30-week average rising since | week of February 2, 2026 | week of September 15, 2025 |
| Distance above the 30-week average | 15.7% | 24.5% |
| What came before | A 64% fall in 2025, then a $66.52–$89.95 range | A rise from $1.33 in September 2025 |
| Rise from the 52-week low to the base high | 94% (from $58.83) | 1,524% (from $1.33) |
| Largest one-day drop since Stage 2 began | 16.5% (March 10, 2026) | 48.3% (April 28, 2026), followed by a stock offering in July |
| Weeks in the current base | 10 | 7 |
Both stocks were above a rising 30-week average, so both passed Weinstein’s test. The stages were not the same. MLAB had just finished a long decline and a long sideways range, and its 30-week average had been rising for only six months. Minervini’s advice for that position, in Think & Trade Like a Champion: “If a stock is in the earlier stages of an upward price trajectory, you will want to give that stock some time to make a full-scale advance.”
ERAS had risen sixteen-fold in a year. It had nearly been cut in half in a single day and rebuilt, and it had just sold a large block of new stock. Counting bases takes judgment, so this article does not number them, but the same book is clear about the difference: “Late-stage stocks need to be treated very differently than early-stage names.”
Step 2: the base
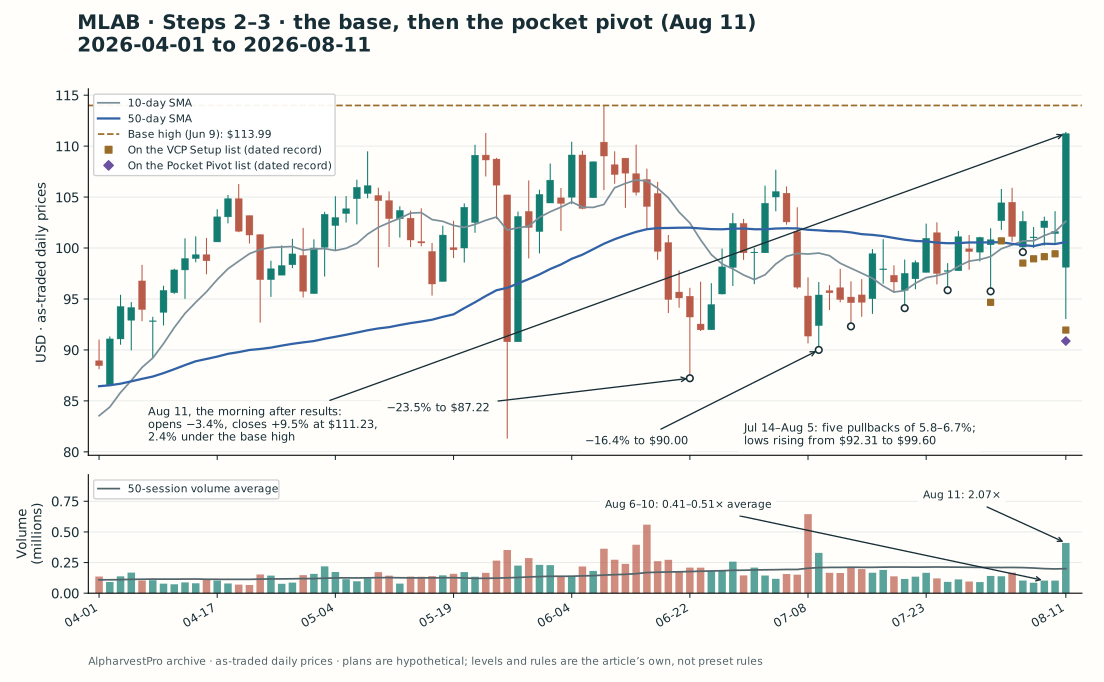
MLAB, daily decision snapshot. No bar after August 11 is shown. Pivot lows are sessions whose low is the lowest of the five sessions centred on them. Download the chart observations.
MLAB. Mesa Labs set its base high of $113.99 on June 9. Its first two pullbacks were deep: 23.5% to $87.22 on June 22, and 16.4% from $107.68 to $90.00 on July 9. After that the swings narrowed. From July 14 to August 5 there were five pullbacks of 5.8% to 6.7%, and each low except one was higher than the last, from $92.31 to $99.60. The stock was on the VCP Setup list on seven days from July 31. Volume fell to 0.41, 0.50 and 0.51 times its 50-session average on August 6, 7 and 10.
Mesa Labs is thinly traded, about 197,900 shares a day. The authors see that as a feature as well as a risk: “When operating with thinner, less-liquid and lower-priced stocks, the pocket pivot can provide a useful buy point that is less obvious to the crowd.” Thin stocks also move further on less news.
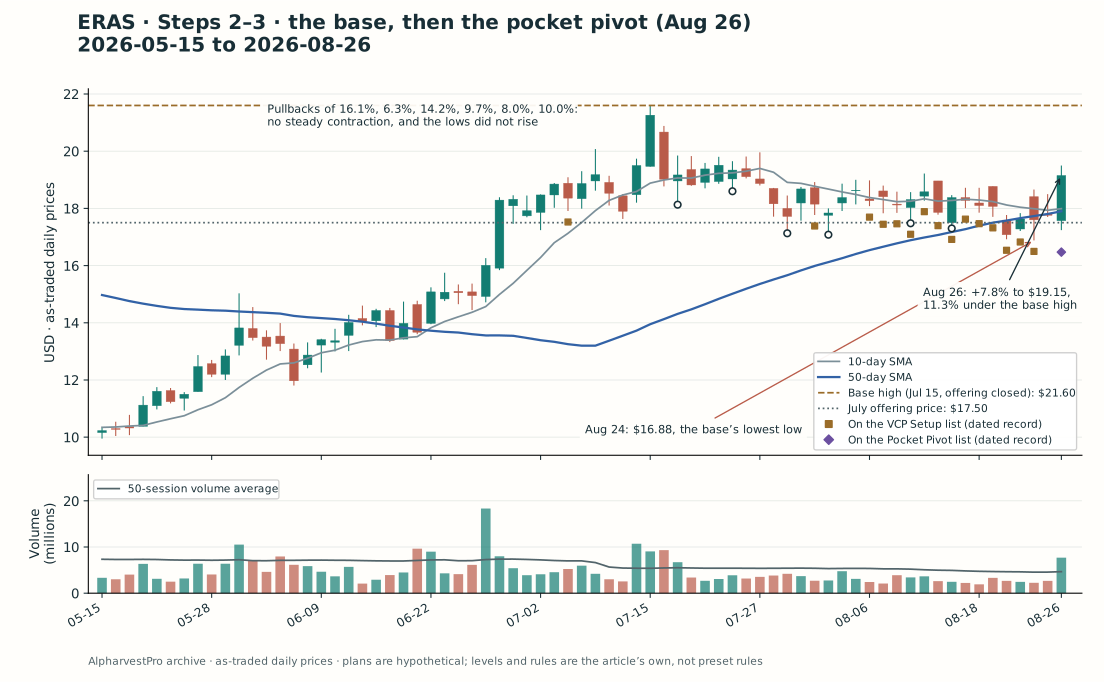
ERAS, daily decision snapshot. No bar after August 26 is shown. Download the chart observations.
ERAS. Erasca’s base began on the day new supply arrived. On July 15 the company closed a public offering of 36,142,857 shares at $17.50, for about $632.5 million, and the stock set its base high of $21.60 that day. The pullbacks that followed were 16.1%, 6.3%, 14.2%, 9.7%, 8.0% and 10.0%: no steady contraction. The lows did not rise either. The base’s lowest low, $16.88, came on August 24, two sessions before the pocket pivot. The stock was on the VCP Setup list on fourteen days from July 31, and volume was quiet, 0.53, 0.49 and 0.58 times average in the three sessions before August 26.
That is the second check’s lesson. A list can flag a stock as a VCP candidate; the reader still has to see whether the lows are rising. MLAB’s were. ERAS’s were not.
Step 3: the pocket pivot in the pocket
| Pocket Pivot list day | MLAB, August 11 | ERAS, August 26 |
|---|---|---|
| Close (change) | $111.23 (+9.5%) | $19.15 (+7.8%) |
| Open | $98.12 (gap of −3.4%) | $17.57 |
| Where it closed in the day’s range | 99% of the way up | 85% of the way up |
| Volume vs the largest down day of the prior ten sessions | 410,300 vs 167,400 (August 4) | 7,690,600 vs 3,311,700 (August 19) |
| Volume vs the previous 50-session average | 2.07 times | 1.68 times |
| Low vs the 10-day average | 9.3% under | 4.2% under |
| Close vs the 50-day average | 10.6% above | 7.0% above |
| Close vs the base high | 2.4% under | 11.3% under |
| Relative-strength rank | 82 | 99 |
Both days pass the book’s daily tests: the volume signature, a low under the 10-day average, a close above the 50-day and in the top quarter of the range. ERAS even had the higher relative-strength rank.
MLAB’s day had a known cause. Mesa Labs released first-quarter results after the close on August 10, with a call at 4:30 p.m. ET. On August 11 the stock opened 3.4% lower, traded down to $93.03, and closed at $111.23, almost at the high. That is a strong reaction to a report rather than quiet accumulation, and it is worth knowing which one you are looking at.
Write the plans, including the exits
Each plan uses a hypothetical $40,000 account and risks at most $400. The lists are published after the close, so the first executable price is the next session’s open.
The exits follow the rules from our earlier article on selling winners. O’Neil’s plan was to “take 20% profits when you have them (except with the most powerful of all stocks)” and to cut losses at a maximum of 8% below the purchase price. Minervini splits the difference: “My ‘sell half rule’ is a win-win solution.” He will “sell half and move my stop to the breakeven point. This allows me to essentially ‘free-roll’ the second half.” For the rest he watches for weakness: “If your stock experiences its largest daily and/or weekly price decline since the beginning of a Stage 2 advance, this is almost always an outright sell signal.”
The written rules:
- Plan A, start then add: buy half the shares the $400 would allow at the next open. If the stock trades one cent above the base high while those shares are held, buy the rest of plan B’s share count there.
- Plan B, breakout only: buy at one cent above the base high, with the full $400.
- Stops: each purchase has its own stop, 8% below its price.
- Sell half into strength when the price reaches 20% above the average cost of the shares held.
- Free roll: move the stop on the other half to that average cost.
- Sell the rest into weakness at the close of the stock’s largest one-day decline since its Stage 2 advance began, counted from the week its 30-week average turned up, or at the breakeven stop if that comes first.
| Hypothetical plan | MLAB | ERAS |
|---|---|---|
| Plan A starter | 22 shares at the August 12 open of $110.69, stop $101.83 | 129 shares at the August 27 open of $19.30, stop $17.76 |
| Breakout trigger | $114.00 | $21.61 |
| Plan B (plan A adds the difference) | 43 shares at $114.00, stop $104.88; plan A adds 21 | 231 shares at $21.61, stop $19.88; plan A adds 102 |
The opening prices are shown so the arithmetic is concrete. Each starter is half of a full position, so its planned loss is about $200 rather than $400: the first purchase pays for information.
Before opening the outcome, decide: which of these pocket pivots would you have started, and which would you have left alone?
Reveal what MLAB and ERAS did next
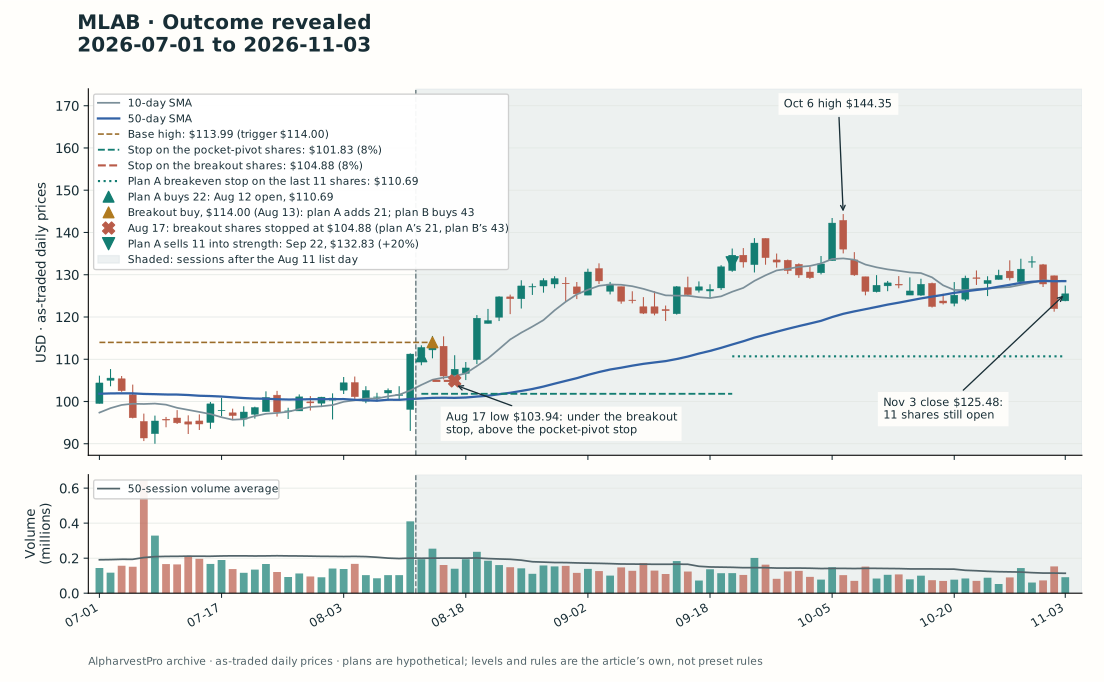
The shaded area was unknown at the decision. Download the outcome observations.
MLAB. The starter filled at the August 12 open: 22 shares, $2,435.18. On August 13 the stock traded to $115.52, through the $114.00 trigger, on 1.27 times its average volume. Plan B bought 43 shares there ($4,902.00, planned loss $392.16), and plan A added 21.
The breakout failed at first. MLAB fell 6.3% on August 14 and traded down to $103.94 on August 17, below the $104.88 stop on every share bought at $114.00. Plan B was out with a loss of $392.16. Plan A lost $191.52 on its 21 added shares, but its 22 pocket-pivot shares had a stop at $101.83, and they held. Two sessions later MLAB closed at $119.72, back above the old high.
From there the plan ran itself. On September 22 the stock reached $132.83, 20% above the starter’s $110.69, and plan A sold 11 shares and moved the stop on the other 11 to $110.69. MLAB peaked at $144.35 on October 6 and closed November 3 at $125.48. It never fell to the breakeven stop, and no day matched its 16.5% drop of March 10, so the last 11 shares were still held. Plan A showed a result of $214.71: a $191.52 loss on the added shares, a $243.54 gain on the shares sold, and a $162.69 open gain on the rest.
Download the outcome observations.
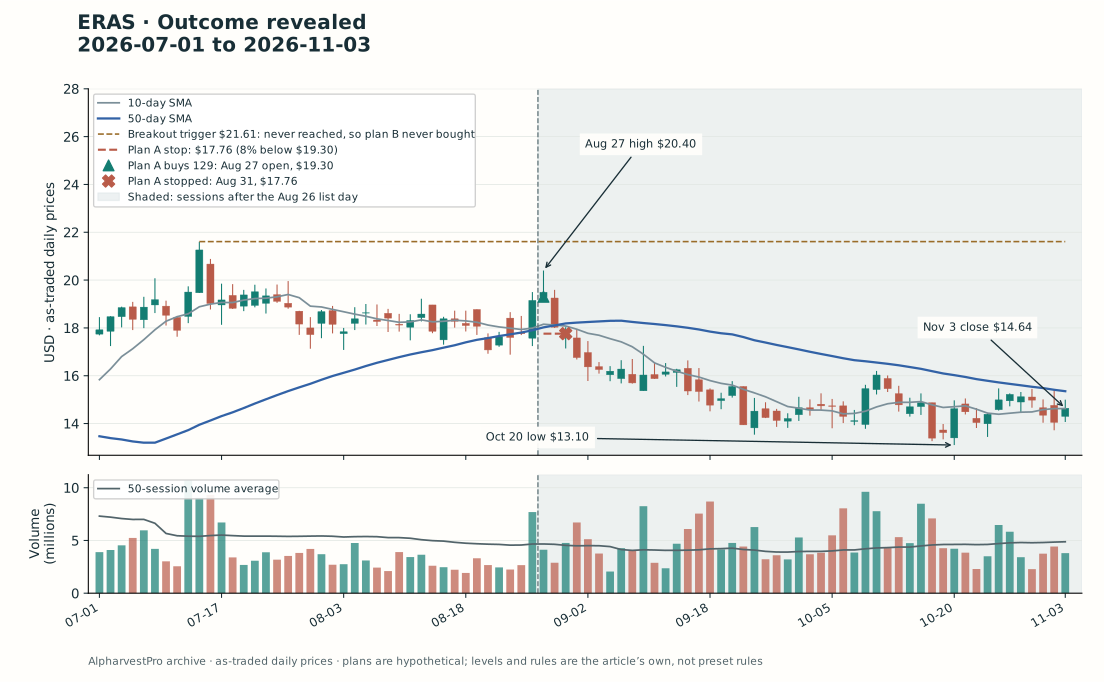
ERAS. The starter filled at the August 27 open: 129 shares, $2,489.70, with a planned loss of $198.66. The stock reached $20.40 that day and never went higher. On August 31 it traded down to $17.14, through the $17.76 stop, and plan A lost $198.66. ERAS never came near the $21.61 trigger, so plan B never bought. The stock fell to $13.10 on October 20 and closed November 3 at $14.64.
| Result | MLAB | ERAS |
|---|---|---|
| Plan A: start, then add | +$214.71 (11 shares still open on November 3) | −$198.66 (129 shares, stopped August 31) |
| Plan B: breakout only | −$392.16 (43 shares, stopped August 17) | No trade: the trigger was never reached |
| Planned loss at entry | $386.44 (A) · $392.16 (B) | $198.66 (A) |
What the order of checks bought
The two pocket pivots looked alike on the day. The weekly chart and the base told them apart before either trade: MLAB was early in a new advance with rising lows; ERAS was late in a sixteen-fold run, under fresh supply, with lows that kept slipping.
At MLAB, the early entry did exactly what Morales and Kacher promise. Their case is a breakout that “fails initially,” and this one did: only the shares bought in the pocket, with a stop below the shakeout, were still there for the advance. A breakout buyer could have bought again after August 19; the plans here do not re-enter.
At ERAS, the early entry cost $198.66, and waiting for the breakout cost nothing, because there was no breakout. Writing about testing the waters with a smaller position, the authors warn that “this will mean potentially many more losses than profits.” The checks and exits in this article do not remove those losses. They decide how big the losses may get, and how much of a winner is kept.
Discussion: when is a pocket pivot worth half a position?
A low hit rate comes with this method; it is not a defect to fix. At anything like the rate Morales describes for his own turnaround year, one or two in ten, most starters will end the way ERAS’s did. The half-size starter is the trade-off that makes that affordable. Each miss costs about $200 rather than $400. Each winner also starts with half the shares: MLAB’s starter was 22 shares, where the full $400 would have bought 45.
The half position is a budget, then, and it belongs where the odds are better than usual. The chart checks in this article say whether a setup is sound. They do not say whether the stock deserves to be bought at all. Morales and Kacher answer that themselves: “When looking for pocket pivot points, limit your universe of potential candidates to fundamentally strong stocks with constructive basing action leading up to the pocket pivot point.” In Cockpit they present the pocket pivot as a tool for “a leading stock during a bull market phase.”
That is where O’Neil’s CAN SLIM and Minervini’s SEPA come in. Beyond the chart, both ask for four things:
- Something new. O’Neil: “It takes something new to produce a startling advance in the price of a stock.” He means a new product or service, new management or new conditions in an industry. Minervini: “Every stock that makes a huge gain has a catalyst behind it.”
- Numbers that show it. O’Neil advises against buying a stock without “earnings per share up at least 18% or 20% in the most recent quarter versus the same quarter the year before.”
- A market in an uptrend. Misjudge a falling market, he warns, and “three out of four of your stocks will plummet along with the market averages.”
- A leading group. By O’Neil’s account, “roughly half of a stock’s move is driven by the strength of its respective group.” Minervini: “Historically, more than 60 percent of superperformance stocks were part of an industry group advance.”
Minervini wants them all at once. He trades “only at the point of alignment across the spectrum with regard to company fundamentals, stock price, and volume activity as well as overall market conditions.”
| On the list day | MLAB, August 11 | ERAS, August 26 |
|---|---|---|
| Something new | A new chief executive, about a hundred days in; no new product named in the release | A clinical-stage cancer-drug developer that had just sold $632.5 million of new stock |
| Latest quarter | Revenue up 1.0%, net income down 40.3% | No product sales or earnings to test |
| Market (SPY) | Above its rising 50-day and 200-day averages, 0.8% below its 52-week high | Above both rising averages, 1.7% below its 52-week high |
| The stock’s group in AlpharvestPro’s ranking | Medical-Systems/Equip, outside the top 50 of 192 groups | Medical-Biomed/Biotech, outside the top 50 of 192 groups |
The market passed both times. The rest did not line up. MLAB had something new, a change at the top, which is one of O’Neil’s kinds. Its quarter did not show it yet: revenue barely moved, though adjusted operating income, a non-GAAP measure, rose 19.5%. Its group was far from the leaders. On August 11 no medical group was in the ranking’s top 20, which was led by computer data storage, fiber optics and document management. ERAS had no sales or earnings that could confirm a story, and its group was outside the leaders too. By October 6 the group had dropped into the bottom 50.
By the full checklist, neither pocket pivot earned even half a position.
That verdict gives up MLAB’s $214.71 result along with ERAS’s $198.66 loss, and it is better to say so than to hide it. A rule strict enough to keep a low-hit-rate method affordable will turn some winners away, and MLAB rose in a recovery that neither its numbers nor its group had confirmed in August. What the rule buys is fewer probes into stocks that fail the masters’ own criteria. The half positions you do take then go to stocks where the story, the market and the group all point the same way.
What this comparison cannot show
- Selection. Both stocks came from a screen of the dated record, run after the outcomes were known, and were chosen to show a contrast. Nothing here measures how often either outcome occurs.
- Events. MLAB’s pocket pivot was a reaction to a scheduled report. ERAS’s base began with a large stock offering. Daily bars cannot separate those flows from the accumulation the method looks for.
- Thin trading. MLAB trades about 197,900 shares a day; fills, gaps and slippage can be worse than these plans assume.
- Fills and costs. Starters assume the next open; other fills assume the price traded through the stated level. Daily bars do not show the order of moves within a session. Commissions, spreads and slippage are excluded.
- Context checks. The published group ranking lists only the top and bottom 50 groups, so a group in neither list sits somewhere in the middle of 192. The earnings check reads one quarterly release, and the market check uses SPY’s averages rather than a full reading of the market’s direction.
- Price basis. Prices are as traded. Mesa Labs paid a $0.16 dividend to holders of record on August 31, so the app’s chart shows earlier MLAB prices slightly lower (the base high reads $113.85). ERAS pays no dividend, and its bars match the app’s.
- Whose rules. The pocket-pivot tests are Morales and Kacher’s; the stage reading is Weinstein’s; the exits are O’Neil’s and Minervini’s. The half-size starter, the base high (the highest high of the 65 sessions before the list day), the one-cent trigger, the pivot-low definition, rounding the half sale down and dating Stage 2 from the turn in the 30-week average are this article’s. So is the rule that a half-size starter needs the CAN SLIM and SEPA checks to agree.
Running it in AlpharvestPro
- After the close, open Pocket Pivot (Morales & Kacher) and note the data date.
- Weekly first. Switch the chart to Weekly and check the long-term trend against the daily chart’s 200-day average. Ask how far the stock has already come, and whether a crash or an offering sits in the recent past. This article’s weekly chart adds Weinstein’s 30-week average, which the app’s weekly view does not draw.
- Then the base. Mark the base high. Are the pullbacks shrinking and the lows rising? Is volume drying up? A VCP Setup (Minervini) appearance is a prompt to check, not a verdict.
- Then the pocket pivot. Check the day’s low against the 10-day average, the close against the 50-day and within the day’s range, and the volume against the largest down day of the prior ten sessions. Check the company’s investor-relations page for a report date or an offering, since the app does not show them.
- Then the backdrop. Read the latest quarterly release for something new and for growth in sales and earnings. Check that SPY is above its rising 50-day and 200-day averages. Find the stock’s Industry Group in its diagnostic view and look for it near the top of the Industry Subgroups ranking (full lists for Pro and Ultra). If any of these fails, the pocket pivot goes on the watchlist, not into the account.
- Write the exits before buying: an 8% stop for each purchase, the +20% line for the half sale, and the week the 30-week average turned up. Size both halves in the position-size calculator.
- Add the stock to Watchlist Alerts (Pro and Ultra), so a new Pocket Pivot or VCP Setup day reaches you.
- After the trade, record which checks it passed and failed, whatever the result.
Conclusion
A pocket pivot answers a narrow question: are buyers showing up inside the base before the breakout? It cannot say whether the stock deserves to be owned. The method’s own authors describe a low hit rate, and the half-size starter is the trade-off that pays for it: smaller losses on the many misses, and a smaller stake in the few winners.
That trade is worth making only when everything else agrees. Read the weekly stage and the base first. Then ask the CAN SLIM and SEPA questions. Is there something new at the company, and does the latest quarter start to show it? Is the market in an uptrend? Is the stock’s group among the leaders? When every answer is yes, a pocket pivot is a reason to start half a position early, with the stop written down. When any answer is no, the stock stays on the watchlist. By that standard, both MLAB and ERAS would have stayed there.
Before the next pocket pivot you consider, write those answers beside the chart, before you write the order.
Reading and chart notes
Gil Morales and Chris Kacher, Trade Like an O’Neil Disciple, Chapter 5 (the pocket pivot’s premise, definition and characteristics); In the Trading Cockpit with the O’Neil Disciples, the Introduction and Chapters 1, 2 and 8. Stan Weinstein, Secrets for Profiting in Bull and Bear Markets, on the 30-week average and the stages. William J. O’Neil, How to Make Money in Stocks, Chapters 3, 5, 9 and 15, on current earnings, something new, market direction and industry groups, and Chapter 11, on taking 20% profits and the 8% loss limit. Mark Minervini, Trade Like a Stock Market Wizard, Chapters 3 and 6, on SEPA, catalysts and industry groups; Momentum Masters, on the sell-half rule; and Think & Trade Like a Champion, Section 9, on selling into weakness and early- and late-stage stocks. Events and company facts come from Mesa Labs’ first-quarter release of August 10, 2026 and its dividend declaration of July 6, 2026, and Erasca’s offering release of July 15, 2026.
Prices are AlpharvestPro’s as-traded daily archive through November 3, 2026, retrieved November 5; weekly bars are built from the same daily data. The same candidates pass the screen on the app’s own dividend-adjusted database. List membership comes from the dated record, which for Pocket Pivot begins on July 16, 2026. Group ranks come from AlpharvestPro’s published US industry-group ranking as it stood each day, which lists the top 50 and bottom 50 of 192 groups on both list days; the stocks’ groups are the app’s own assignments. The market check uses SPY’s as-traded closes. Both cases were selected retrospectively. The plans are hypothetical, use whole shares and exclude costs; actual stop execution is not guaranteed. A historical list match does not establish when an alert was delivered.

