
A huge gap-up does two things at once. It tells you something important may have changed, and it moves the price at which you can act. The first is exciting. The second is arithmetic, and it is the part that decides how much you lose if you are wrong.
Gil Morales and Chris Kacher put the temptation plainly in Trade Like an O’Neil Disciple: “There is nothing more alluring for a trader than a stock that is gapping up hugely on tremendous volume.” They also give the gap a stop, which turns the excitement into something you can measure.
Three masters, one gap
Morales and Kacher define a major gap-up as an opening gap of at least 0.75 times the stock’s 40-day average true range, on volume at least 1.5 times its 50-day average. “The first rule of buying gap-ups is that it should only be done in quality, leading stocks with strong fundamentals,” and “Gap-ups that are also base breakouts are the most powerful base breakouts.” Such gaps can be bought “with the proviso that they hold the intraday low of the gap-up day’s trading range.” In the days that follow, sell if the stock trades below that low, though “One can allow the stock to close first.” They add a warning about buying late in the day: “Buying a gap-up at the end of the day that closes at its high is okay, but you have to allow for that much more downside.”
William O’Neil limits every loss to “an absolute maximum of 7% or 8%” of your cost. He also warns about the opposite kind of gap. When a stock already greatly extended from its base gaps up, “the advance is near its peak.”
Mark Minervini, in Think and Trade Like a Champion, describes a stock that “gapped up sharply on huge volume” and then came back on relatively low volume: “The pivot point or low cheat provided a low-risk entry point—one that was obvious given the large gap upward and low-volume pullback.”
None of them expects to be right most of the time. “In fact, you’ll probably be right less than half the time!” O’Neil writes in How to Make Money in Stocks. That is why the distance to the stop matters more than the size of the gap.
Moderna on August 19, 2026
Before the market opened on August 19, Merck and Moderna (NASDAQ: MRNA) reported Phase 3 results in melanoma for intismeran autogene, given with Merck’s KEYTRUDA: at a pre-specified interim analysis, the trial met its primary endpoint. MRNA had closed at $62.96 the day before. It opened at $116.02, 84.3% higher, and closed at $174.38, up 177.0%, on 199.3 million shares, 27 times its 50-session average.
The stock was not an unknown. AlpharvestPro’s VCP Setup (Minervini) list had shown it on August 14, 17 and 18, with RS 93. The gap opened 35.5% above its 52-week high of $85.60, set on July 6, so it was also a base breakout. The opening gap measured more than 12 times its 40-day average true range. That night, MRNA appeared on AlpharvestPro’s Buyable Gap-Up (Morales & Kacher) list.
The list arrives after the close, and that changes what you know. At the opening print, nobody knew where the day’s low would be. By the evening, the low was a fact: $114.46. So was the close: $174.38, 52.4% above it.
| Plan written on the evening of August 19 | Stop | Distance from the $174.38 close | Shares for a $400 risk (hypothetical $40,000 account) |
|---|---|---|---|
| A. Morales and Kacher: buy, stop at the gap-day low | $114.46 | $59.92 (34.4%) | 6, about $1,046 |
| B. O’Neil: buy, cap the loss at 8% | $160.43 | $13.95 (8.0%) | 28, about $4,883 |
| C. Minervini: wait for a low-volume pullback | Not set yet | — | None yet |
The share counts use the close as a stand-in for the next morning’s price; the real numbers depend on the open. The table makes the conflict visible. The gap-day low that Morales and Kacher use is more than four times O’Neil’s maximum loss away. Plan A respects their stop and buys a tiny position. Plan B respects O’Neil’s limit with a stop that has nothing to do with the chart. Plan C buys nothing yet.
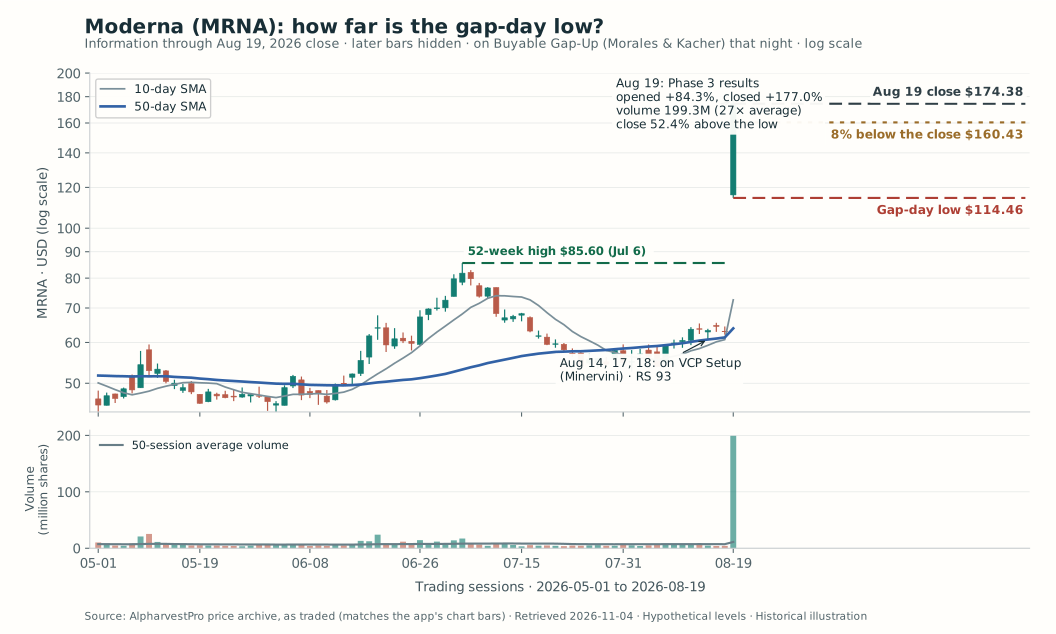
Red dashed: gap-day low. Gold dotted: 8% below the close. Dark dashed: the close. Blue: 50-day SMA; gray: 10-day SMA. Log scale. Tap or click any chart to open it at full size.
Which plan would you write down that night?
Reveal MRNA through November 3
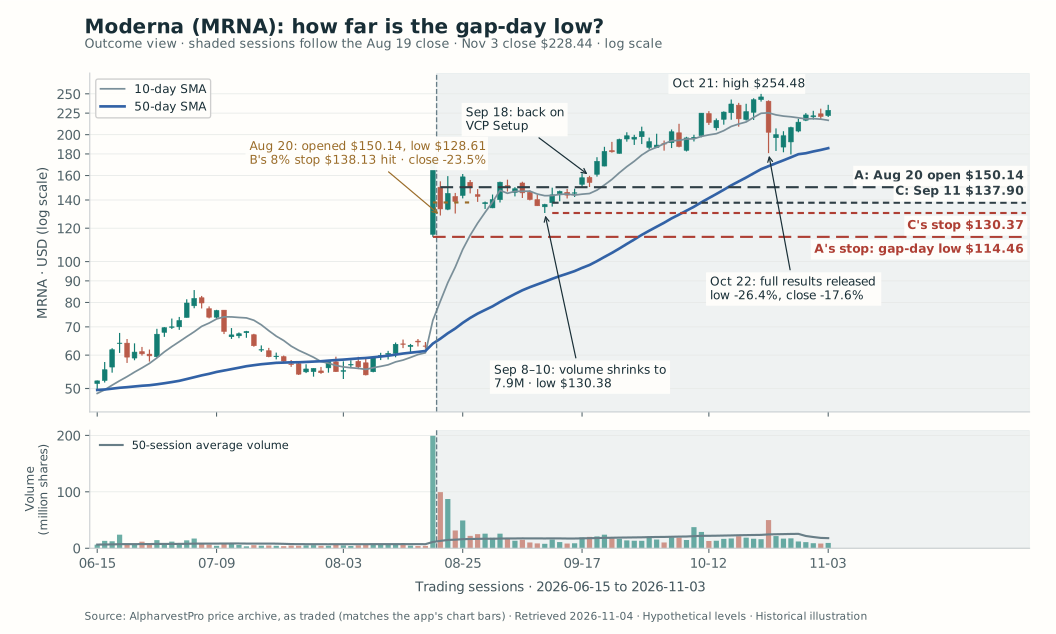
August 20: MRNA opened at $150.14, 13.9% below the previous close. Plan A bought there: $35.68 of risk a share, so 11 shares, $1,651.54, about 4% of the account. Plan B bought 33 shares with an 8% stop at $138.13. The stock fell as low as $128.61 and closed at $133.32, down 23.5% from the gap-day close. Plan B’s stop filled at $138.13 for a loss of $396.33. Plan A’s stop, the gap-day low, was never touched: $128.61 turned out to be the lowest price after the gap.
O’Neil anticipated plan B’s frustration: “Yes, the stock you sell will often turn right around and go back up.” He insists that does not make the sale wrong. The lesson is placement: his 8% is a ceiling on the loss, not a place for the stop, and on a stock that had just moved 177% in a day, 8% sat inside its ordinary swings. Morales and Kacher’s line for volatile stocks says the same thing from the other side: “Stocks with higher volatility can be given a little more room than those with lower volatility.”
September 8 to 10: the stock drifted lower as volume dried up: 10.3, 8.7 and then 7.9 million shares, the lightest since the gap and close to its pre-gap average of 7.3 million. The low on September 10 was $130.38, still well above the gap-day low.
September 11: MRNA opened at $137.90, above the previous day’s high of $137.13. Plan C bought there, with a stop one cent under the September 10 low.
| Plan C, September 11 | |
|---|---|
| Entry | $137.90, the open |
| Stop | $130.37 |
| Size | $7.53 of risk a share, 5.5%, inside O’Neil’s limit: 53 shares, $7,308.70, about 18% of the account; planned loss $399.09 |
September 18 and 21: MRNA was back on VCP Setup (Minervini), and on September 21 it traded above the gap-day high for the first time, reaching $176.86.
October 21 and 22: a high of $254.48 on October 21. The next day, when the companies released the full trial results, the stock fell as much as 26.4% during the session and closed at $202.63, down 17.6%. It did not close below its 50-day average, the sell guide Morales and Kacher use for large companies, at any point after the gap. It closed November 3 at $228.44.
| Plan (hypothetical $40,000 account, $400 risk) | Entry | Shares | Result at the November 3 close, before costs | Multiple of planned risk |
|---|---|---|---|---|
| A. Gap-day low stop | $150.14, August 20 | 11 | +$861.30, still open | 2.2R |
| B. O’Neil’s 8% stop | $150.14, August 20 | 33 | −$396.33, stopped August 20 | −1.0R |
| C. Low-volume pullback | $137.90, September 11 | 53 | +$4,798.62, still open | 12.0R |
The same stock and the same $400 budget produced a small gain, a full loss and a large gain. The difference was not the forecast; all three plans expected the gap to hold. It was the distance from the entry to a stop that made sense for this chart. Plan A had the right stop and so little size that the result barely mattered. Plan B had the right size and a stop the stock ran through on its first full day. Plan C waited until the chart offered a stop close enough to buy a normal position.
What the example cannot show
MRNA was chosen after the outcome was known. It is one stock, and a 177% day is extremely rare; most gaps are smaller, and many fail to hold their low. Nothing here measures how often Buyable Gap-Up candidates work, or how often any of the three plans does.
Morales and Kacher limit gap buying to quality leaders with strong fundamentals. A list can show that MRNA was a technical leader in a base. It cannot judge what a single trial readout means for a company’s business, and that judgment is the reader’s. The gap’s cause also returned on October 22, when the full results came out and the stock fell 26.4% during the session. Plan C’s 53 shares lost $3,445.53 of open profit from the October 21 close to the October 22 low. Scheduled data releases and conference presentations belong in the note, next to the stop.
Size is still the control that works when a stop does not. A stock that can move 177% in a day can also open far below a stop. Plan C’s position was about 18% of the account, which is why its stop had to be close.
Running it in AlpharvestPro
- Screen after the close: open Buyable Gap-Up (Morales & Kacher) and confirm the data date. Then check what the stock was doing before the gap: a base on VCP Setup (Minervini) or Three Weeks Tight (O’Neil), and leadership in RS and the Minervini Score. A gap far above a long, extended run is O’Neil’s warning sign, not a buy.
- Measure: note the gap-day low and the close, and the percentage between them. If it is more than 8%, O’Neil’s limit and Morales and Kacher’s stop disagree: size from the gap-day low, or wait.
- Size: enter the entry, the stop and your risk budget in the position-size calculator; our CPAY example walks through the arithmetic.
- Wait: star the stock. Watchlist Alerts flag a starred stock’s new list entries, such as MRNA’s return to VCP Setup on September 18. Watch volume on the pullback; Minervini’s entry needs it to dry up.
- Hold: sell if the stock closes below the gap-day low. After that, use the 50-day average for large companies, as Morales and Kacher do.
Before your next gap-up, write two numbers in the note: the gap-day low and the percentage from your entry to it. If the second number is larger than your loss limit, the plan is to wait or to buy less, decided before the open.
Reading and chart notes
Gil Morales and Chris Kacher, Trade Like an O’Neil Disciple, Chapter 5, on buying gap-ups in leading stocks and the gap-day-low sell rule. William J. O’Neil, How to Make Money in Stocks, Chapter 10, on cutting losses, and Chapter 11, on exhaustion gaps. Mark Minervini, Think and Trade Like a Champion, Section 7, on the low cheat after a gap. The plans, share counts and routine are this article’s own applications.
NASDAQ: MRNA. Daily prices are as traded, from the archive behind AlpharvestPro’s charts, retrieved November 4, 2026; MRNA’s archived bars match the app’s chart. List appearances come from the dated screening record. The first chart ends at the August 19 close; the outcome chart ends November 3. Both use a logarithmic price scale. Entries, stops, sizes and exits are hypothetical. Fills use the stated open or stop price and exclude commissions, slippage and taxes. The case was chosen after the outcome was known and does not measure how often any method works.

