
The first purchase is working. The stock has moved up, the stop is far below, and a fresh AlpharvestPro list day says the chart has set up again. Adding feels safer than starting over in a stock you do not know. There is a cushion, and the position has already proved something.
It has proved less than it seems. An add-on is a new purchase at a higher price, and it changes the old one. It raises the average cost, and every line that depends on the average cost moves with it. In the two stocks below, a first purchase worked and a later list day invited an add-on. One add-on paid. The other cost most of the profit the first purchase was about to lock in, and the warning was on the page the evening before the order.
What the masters say about adding
Momentum Masters put the question to four traders, and they did not agree. Mark Minervini: “I’m not as big on adding to your winners as much as I am on timing the purchase just right with an optimal position size in the first place.” He adds only “if I started with a smaller-than-normal position and then a new low-risk entry presents itself subsequent to my initial entry.” Dan Zanger is warier still: “Adding to a winner is basically averaging up. If the stock takes a quick break on a downgrade or a secondary stock offering, I could be underwater in a flash.”
David Ryan adds, on two conditions: “I only add to stocks on which I already have a profit,” and “You must add to a stock after it has built a new base following its first move up.” Mark Ritchie II names the feeling that gets in the way: “when you own something at a lower price, the idea of buying more at a higher price feels wrong.” His answer is to “pyramid in such a way where you don’t add much more risk but use your gains to finance buying more.”
William O’Neil learned pyramiding from Jesse Livermore and put limits on it. He followed what was working “with additional but always smaller purchases,” and he made a rule not “to pyramid or add to my position at more than 5% past that point,” the pivot buy point. He also explains why a new base matters: “successful stocks, after breaking out of a proper base, tend to move up 20% to 25%. Then they usually decline, build new bases, and in some cases resume their advances.”
Gil Morales and Chris Kacher, whose pocket pivot appears below, built their method partly for this job. They identify “pocket pivot buy points and buyable gap-up buy points to initiate and add to positions in leading stocks.”
The rules in this article
The first purchase follows this series’ end-of-day plan. It needs a close above the base high on volume at least 50% above the average of the previous 50 sessions, O’Neil’s breakout volume, and it buys at the next open. Nothing is bought while AlpharvestPro’s Market Compass reads Market in Correction. Each plan uses a hypothetical $40,000 account and risks at most $400 on the first purchase.
An add-on must pass five tests, taken from the masters above:
- A profit first. The first purchase is still held and showing a gain (Ryan).
- A new base. After the first move, the stock has rested for at least five weeks. That is the shortest base O’Neil accepts: a flat base “moves straight sideways in a fairly tight price range for at least five or six weeks, and it does not correct more than 10% to 15%.”
- Smaller. Half the first purchase’s shares, O’Neil’s “always smaller.”
- Near the pivot. No more than 5% past the buy point (O’Neil).
- Confirmed at the close, in a healthy market. A fresh list day, an end-of-day trigger, and no purchase while Market Compass reads Market in Correction.
The exits are the series’ selling rules from our article on selling winners:
- Stop: 8% below each purchase. O’Neil: “cut your losses at a maximum of 8% below your purchase price.”
- Into strength: sell half when the price reaches 20% above the average cost. O’Neil’s plan was to “take 20% profits when you have them (except with the most powerful of all stocks),” and Minervini says: “My ‘sell half rule’ is a win-win solution.”
- Breakeven: after the half sale, the stop on the rest moves to the average cost.
- Into weakness: sell the rest at the close of the stock’s largest one-day decline since its Stage 2 advance began. Minervini: “If your stock experiences its largest daily and/or weekly price decline since the beginning of a Stage 2 advance, this is almost always an outright sell signal.”
Notice the words average cost. An add-on changes it. So before any add-on, this article writes four numbers for the whole position, not just for the new shares:
- Giveback to the stops: how much of the position’s value at the add-on price every share could lose before its own stop.
- Result if every stop fills: what the position would then make or lose against its cost.
- The new average cost, which is also the new breakeven.
- The new +20% line, where the half sale now waits.
How we chose these two cases
AlpharvestPro’s Three Weeks Tight (O’Neil) list surfaces uptrend leaders pausing in a tight multi-week closing pattern. O’Neil describes tightness on a weekly chart as “several consecutive weeks’ prices closing unchanged or remarkably near the previous week’s close.” The list was added on August 11, 2026. Pocket Pivot (Morales & Kacher) became a list of its own on July 16, 2026; the pocket-pivot signal behind it has been recorded since February 4, 2026, as our pocket pivot article explains.
We read every US stock with a Three Weeks Tight or Pocket Pivot day from July 16 to October 23. We looked for a first purchase under the series’ plan that was still held at a profit when a later list day arrived, and followed both purchases under the exits above to November 6. Two cases show the contrast best:
- NTRA (Natera) came to its add-on after a new five-week base, on a Three Weeks Tight list day.
- DAC (Danaos) came to its add-on on a Pocket Pivot list day near the top of a nine-week climb, with no new base.
Both were chosen after the outcomes were known, to show a contrast. They do not measure how often an add-on helps.
Step 1: the weekly chart
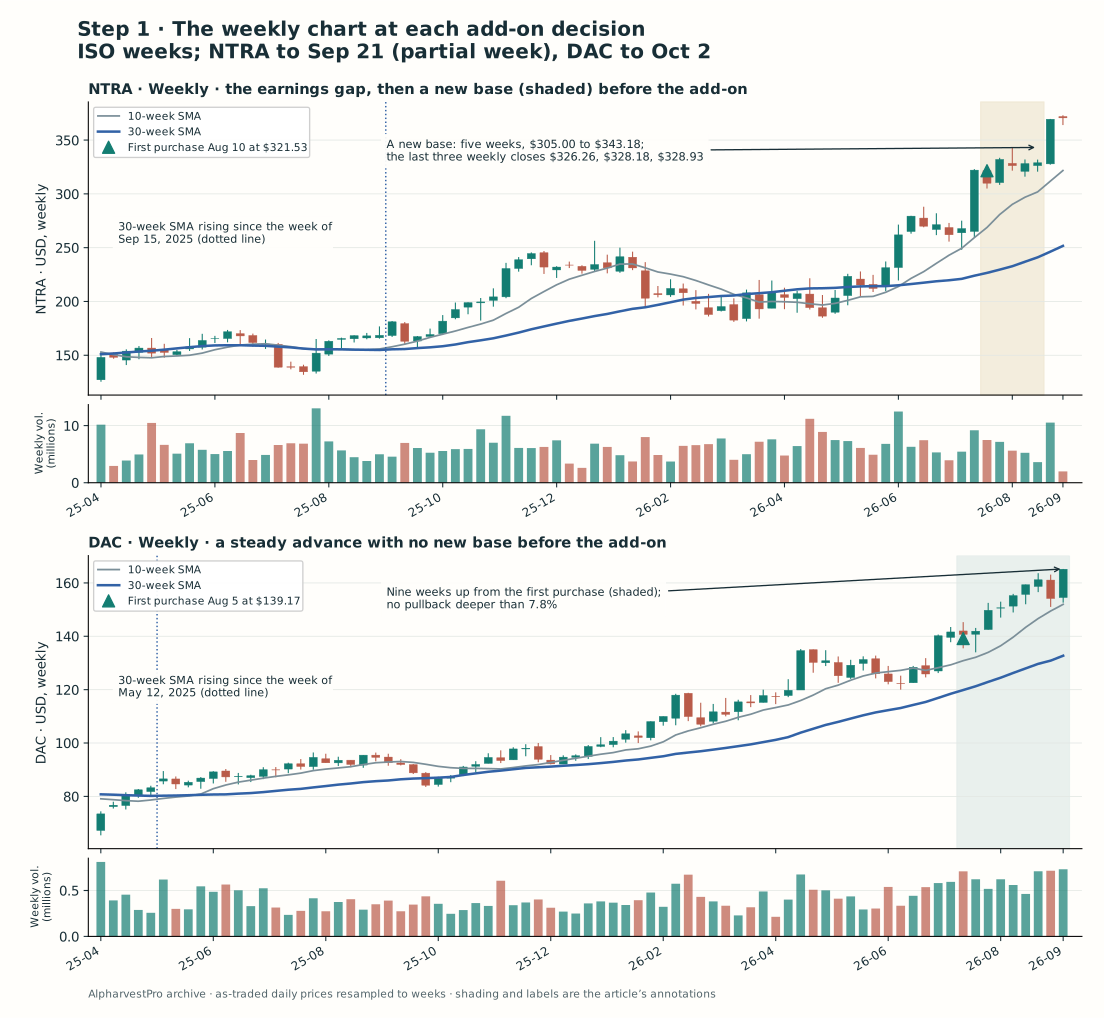
Weekly decision view. Weeks run Monday to Friday; NTRA’s last bar is the partial week of September 21. The shading is this article’s reading of the chart.
Both stocks were in long advances above a rising 30-week average, Stan Weinstein’s measure of the long-term trend. NTRA’s had been rising since the week of September 15, 2025, and DAC’s since the week of May 12, 2025. The difference is the shape just before the add-on. NTRA gapped up on earnings in August and then went sideways for five weeks, closing its last three weeks within 0.8% of each other. DAC climbed for nine weeks from its first purchase without a pullback deeper than 7.8%.
Steps 2 and 3: NTRA, a new base after the gap
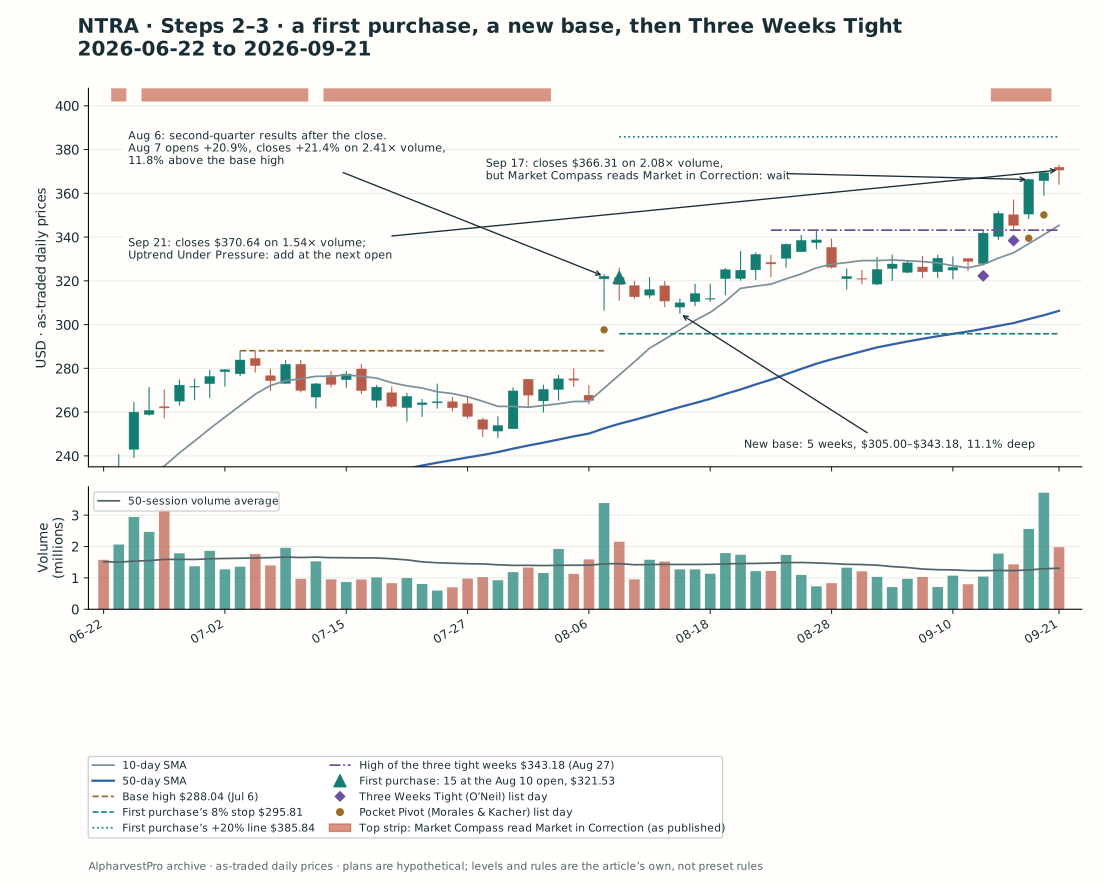
NTRA, daily decision snapshot. No bar after September 21 is shown. The top strip shows Market Compass’s published readings.
The first purchase. Natera reported second-quarter results after the close on August 6; EDGAR accepted the filing at 4:05 p.m. ET. Revenue rose 37.7%, and the company raised its revenue guidance for the year. The next day the stock opened 20.9% higher and closed up 21.4% at $322.10 on 2.41 times its average volume, 11.8% above its July 6 base high of $288.04. Market Compass read Confirmed Uptrend. AlpharvestPro listed the day on Pocket Pivot (Morales & Kacher) and Buyable Gap-Up (Morales & Kacher).
The masters split on a gap like that. Morales and Kacher: “Despite the fact that a huge upside gap can often appear to be too high, the hard trading reality may be that the move is very buyable.” Minervini, one question later in the same roundtable: “If a stock gaps up more than a few percentage points past my buy point, I won’t touch it.” The series’ plan bought it: 15 shares at the August 10 open of $321.53 ($4,822.95), 11.6% above the base high. The 8% stop, $295.81, sat below the gap day’s low of $306.38, and the planned loss was $385.80. The +20% line was $385.84.
The new base. The stock rose to $343.18 on August 27 and then went sideways. For five weeks it held between $305.00 and $343.18, 11.1% deep, and its last three weekly closes were $326.26, $328.18 and $328.93, within 0.8% of each other. On September 14 it made the Three Weeks Tight list. The trigger was a close above the high of those three weeks, $343.18, on at least 1.5 times average volume.
Waiting for the market. NTRA closed above $343.18 on September 15, on 1.44 times average volume, short of the rule. On September 17 it closed at $366.31 on 2.08 times, but Market Compass read Market in Correction from September 15 to 18, so the plan waited. On September 21 it closed at $370.64 on 1.54 times, with Market Compass at Uptrend Under Pressure, and the add-on was set for the next open.
It passed four of the five tests: a profit, a five-week base, half size and a close confirmed outside a correction. It failed the fifth. By the September 21 close the stock was already 8.0% above $343.18, past O’Neil’s 5%, because the correction had held the plan back while the stock ran.
Steps 2 and 3: DAC, an add-on near the +20% line
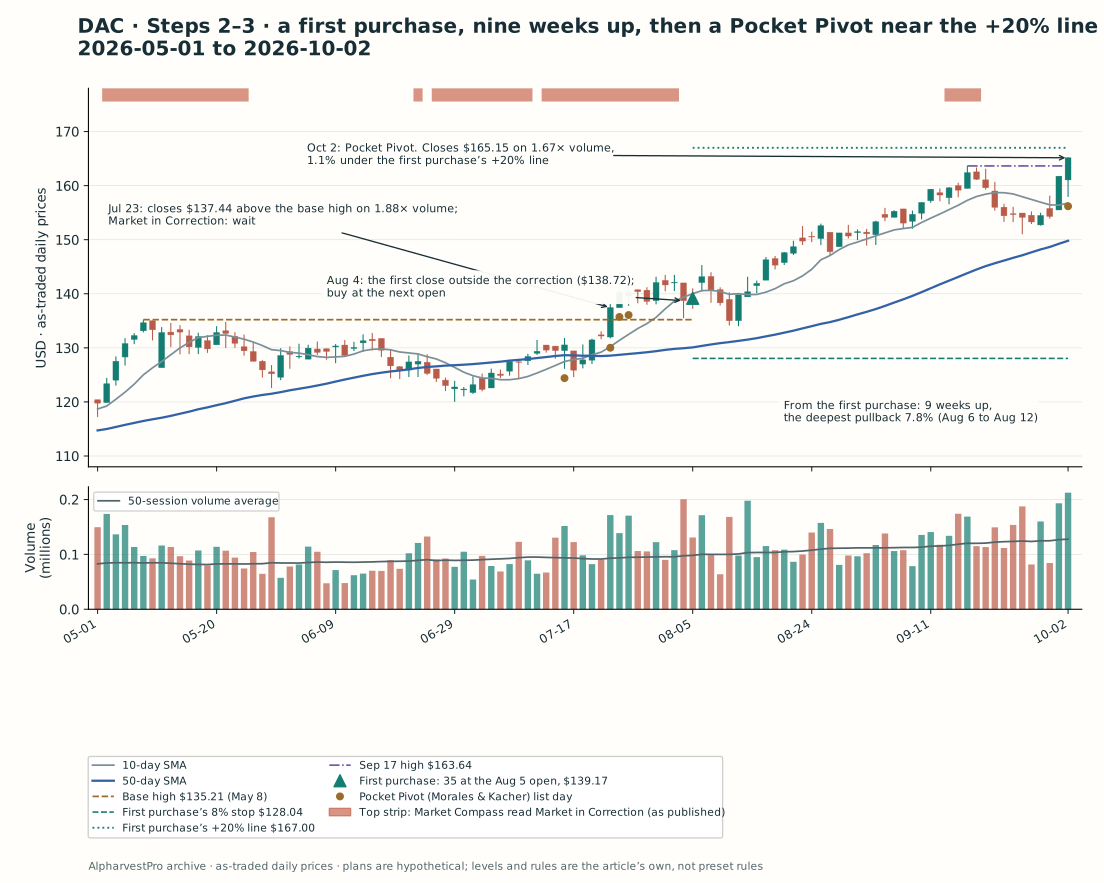
DAC, daily decision snapshot. No bar after October 2 is shown.
The first purchase. Danaos owns containerships and charters them out on multi-year contracts. On July 23 the stock closed at $137.44, above its May 8 base high of $135.21, on 1.88 times average volume, and made the Pocket Pivot list. Market Compass read Market in Correction, so the plan waited, and every close stayed above $135.21. On August 4 Market Compass turned to Confirmed Uptrend and DAC closed at $138.72. That morning Danaos had filed its second-quarter report; EDGAR accepted it at 6:02 a.m. ET. The plan bought 35 shares at the August 5 open of $139.17 ($4,870.95), 2.9% above the base high. The 8% stop was $128.04, the planned loss $389.55 and the +20% line $167.00.
No new base. From there DAC climbed for nine weeks. Its deepest pullback was 7.8%, from $145.31 on August 6 to $134.00 on August 12. The latest ran from a $163.64 high on September 17 to $151.00 on September 25. On October 2 the stock closed at $165.15 on 1.67 times average volume and made the Pocket Pivot list again.
This add-on passed four tests: a profit, half size, a close 0.9% above the September 17 high, well within O’Neil’s 5%, and Market Compass at Uptrend Under Pressure. It failed the base. An eleven-session dip of 7.7% is a pause, not a base of five weeks. And the chart showed one more thing: DAC closed 1.1% under the first purchase’s +20% line.
The checks, before any order
This series asks every purchase to pass four checks that a chart cannot show: something new, numbers that show it, a market in an uptrend and a leading group. O’Neil’s numbers test is strict. He advises against buying without “earnings per share up at least 18% or 20% in the most recent quarter versus the same quarter the year before,” and adds that “Strong and improving quarterly earnings should always be supported by sales growth of at least 25% for the latest quarter.” On groups, by his account, “roughly half of a stock’s move is driven by the strength of its respective group.”
| At each purchase | NTRA | DAC |
|---|---|---|
| Something new | Three regulatory approvals for its Signatera test, wider Medicare coverage for Prospera and an enhanced Panorama test, in the company’s words; oncology test volume up 57.2% | A new 8,258 TEU containership delivered in July on a long-term charter; 28 more on order |
| Latest quarter | Revenue $752.8 million vs $546.6 million (+37.7%); net loss $67.0 million vs $100.9 million | Operating revenues $274.4 million vs $262.2 million (+4.7%) |
| Market Compass | Confirmed Uptrend (August 7); Uptrend Under Pressure (September 21) | Confirmed Uptrend (August 4); Uptrend Under Pressure (October 2) |
| Group in the app’s ranking | Medical-Research Eqp/Svc: #43 of 192 (August 7), #36 (September 21) | Transportation-Ship: #33 of 192 (August 4), #19 of 189 (October 2) |
| Relative-strength rank | 93, then 96 | 82, then 94 |
The market and the groups passed both times. The numbers did not, read strictly. Natera’s sales growth cleared O’Neil’s 25% with room to spare, but the company still lost money, so it had no earnings to grow; the loss narrowed from $0.74 to $0.47 a share. Danaos’s revenue grew 4.7%. A strict reader would have bought neither stock, and there would have been nothing to add to. We keep both because this article’s question begins after the first purchase, and we say so here rather than leave it out.
Write the whole position before the order
Here are the four numbers for each add-on. They use the next session’s opening price, so the arithmetic is concrete; on the evening of the decision you would use the close.
| NTRA at the September 22 open, $368.26 | No add-on | Half: 7 shares | A full $400 add-on: 13 shares |
|---|---|---|---|
| Shares held | 15 | 22 | 28 |
| Average cost | $321.53 | $336.40 | $343.23 |
| +20% line for the half sale | $385.84 | $403.68 | $411.87 |
| Giveback to the stops | $1,086.75 | $1,292.97 | $1,469.73 |
| Result if every stop fills | −$385.80 | −$592.02 | −$768.78 |
| DAC at the October 5 open, $166.18 | No add-on | Half: 17 shares | A full $400 add-on: 30 shares |
|---|---|---|---|
| Shares held | 35 | 52 | 65 |
| Average cost | $139.17 | $148.00 | $151.64 |
| +20% line for the half sale | $167.00 | $177.60 | $181.96 |
| Giveback to the stops | $1,334.90 | $1,560.83 | $1,733.60 |
| Result if every stop fills | −$389.55 | −$615.48 | −$788.25 |
The add-on’s own planned loss looks small: $206.22 at NTRA (a stop at $338.80) and $225.93 at DAC (a stop at $152.89). The whole position tells a different story. Most of the giveback was the first purchase’s open profit, $700.95 at NTRA and $945.35 at DAC. Ritchie’s gains that “finance buying more” are real money, and they can be given back.
The line that matters most for DAC is the +20% line. Without an add-on it sat at $167.00, 1.1% above the October 2 close. A half add-on moves it to $177.60, 7.5% above that close. This add-on does not just buy more shares. It moves the half sale further away.
Before opening the outcome, decide: would you add to NTRA, to DAC, to both or to neither, and how many shares?
Reveal what NTRA and DAC did next
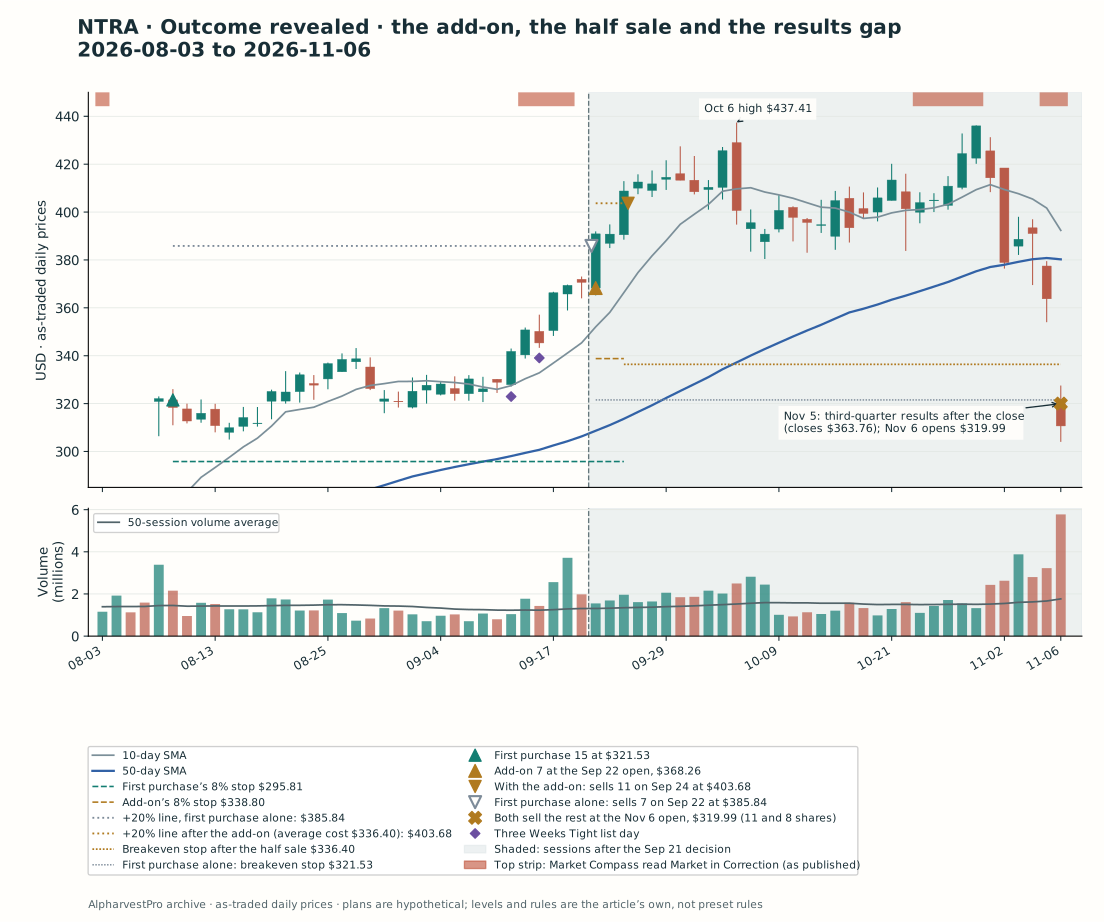
The shaded area was unknown at the decision. The top strip shows Market Compass’s published readings.
NTRA. The add-on filled at the September 22 open: 7 shares at $368.26 ($2,577.82), 7.3% above $343.18 and 14.5% above the first purchase. The same day the stock reached $391.93. That passed the first purchase’s own +20% line, so a trader who had not added sold 7 shares at $385.84. With the add-on, the line was $403.68. On September 24 the stock reached $412.92, and the plan sold 11 of its 22 shares at $403.68 and moved the stop on the rest to the $336.40 average cost.
NTRA peaked at $437.41 on October 6. On November 2 it fell 8.5%, but its largest decline since the Stage 2 advance began was 11.6%, on May 8, so the weakness rule held. On November 5 it fell 7.0% to $363.76, and after the close Natera reported third-quarter results; EDGAR accepted the filing at 4:07 p.m. ET. Revenue rose 34.1%, and the company raised its guidance again. On November 6 the stock opened at $319.99, under both breakeven stops, and both plans sold the rest there: 11 shares with the add-on, 8 without. NTRA closed that day at $310.67, down 14.6%.
The top strip shows Market Compass’s published readings.
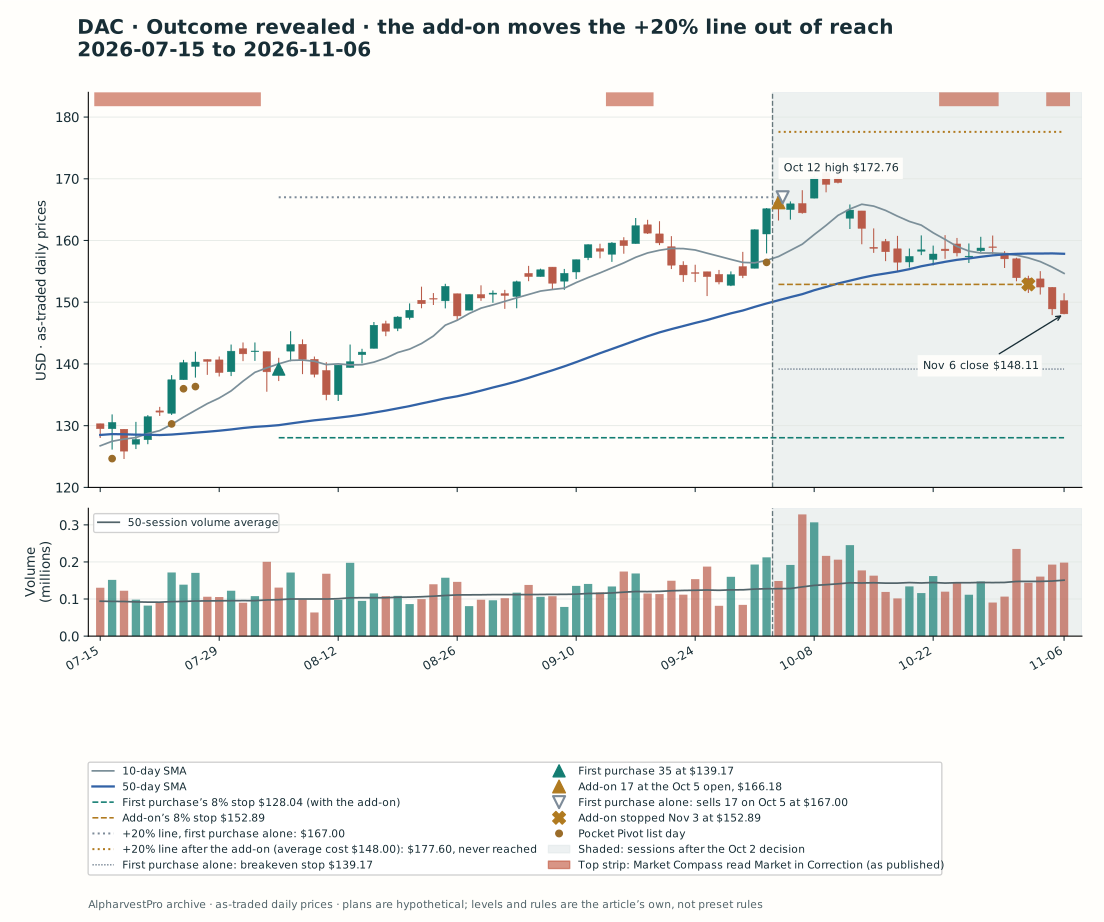
DAC. The add-on filled at the October 5 open: 17 shares at $166.18 ($2,825.06), 19.4% above the first purchase. That session DAC traded up to $167.77. A trader who had not added sold 17 shares at $167.00 and moved the stop on the other 18 to $139.17. With the add-on, the line was $177.60. DAC peaked at $172.76 on October 12, 2.7% short of it, and then drifted lower. On November 3 it traded down to $151.50, through the add-on’s $152.89 stop, and the 17 added shares were sold for a loss of $225.93. The first purchase’s 35 shares, with their own stop at $128.04, were still held at the November 6 close of $148.11.
| Result to November 6, before costs | NTRA | DAC |
|---|---|---|
| No add-on | +$437.85 (7 sold at $385.84, 8 at $319.99) | +$634.03 (17 sold at $167.00; 18 still held) |
| Half add-on | +$559.60 (11 sold at $403.68, 11 at $319.99) | +$86.97 (17 stopped at $152.89; 35 still held) |
| Full $400 add-on | +$635.71 (14 sold at $411.87, 14 at $319.99) | −$85.80 (30 stopped at $152.89; 35 still held) |
What the add-on changed
At NTRA the add-on did what Ryan describes. It came after a new base, the stock kept going, and the half sale still came: two sessions later and $17.84 higher. The add-on added $121.75 to the result. It also broke O’Neil’s 5% rule, because the correction made the plan wait. A strict O’Neil reader would have skipped it and kept $437.85, which is a fine result too.
At DAC the add-on bought 82 cents under the first purchase’s half sale and moved that sale $10.60 further away. The stock rose another 3.4% past the old line and then fell back. The first purchase alone sold half at $167.00 and kept the rest on a breakeven stop. With the add-on, nothing was sold into strength, the added shares were stopped, and the result fell from $634.03 to $86.97.
None of this needed hindsight. On October 2 the worksheet showed that an add-on would move the +20% line from 1.1% above the close to 7.5% above it, in a stock that had built no base since the first purchase. DAC’s close was 22.1% above its old base high, inside the 20% to 25% move after which, in O’Neil’s words, stocks “usually decline, build new bases.” The add-on bought at the point where the first purchase was about to be paid.
Size made each result bigger in its own direction. A full $400 add-on would have added more at NTRA and turned DAC into a loss. That is Zanger’s “averaging up” in numbers. The add-on amplifies whatever the stock does next, so the base, the market and the four lines have to justify the bet before the order, not after it.
What these cases cannot show
- Selection. Both stocks came from a screen of the dated record, run after the outcomes were known, and were chosen to show a contrast. In that screen some add-ons helped and some hurt; nothing here measures how often either happens.
- The case we dropped. The first draft of this article used Hanover Insurance (THG). Its first shares were bought on August 14 at $223.73, inside a pullback from an August 3 high of $236.07, on NR7 Squeeze Setup (Linda Raschke) and AVWAP Pullback Watch (Brian Shannon) list days, with a relative-strength rank of 74, a group outside the top 50 and a 3% stop. Its add-on traded above $233.29 during the session on September 16, while Market Compass read Market in Correction, and the stock closed below that level at $231.76. The draft stopped its window on October 2, near the lows. With this series’ 8% stop, $205.83, those first shares were never stopped: the low was $213.63 on October 1. THG closed above $236.07 on October 22, made the Pocket Pivot and Buyable Gap-Up lists on October 30 and November 2, and reached $256.74 on November 5. A window that ends early can teach the opposite lesson.
- Context checks. As the table shows, both first purchases fail O’Neil’s numbers test read strictly. The published group ranking lists only the top and bottom 50 groups. The earnings check reads one quarterly release, and the market check uses Market Compass’s headline reading as published after each close.
- Events. NTRA’s first purchase followed an earnings gap, and its last shares were sold on the gap after the next report. DAC’s first purchase came the day after its quarterly report. Danaos filed no third-quarter report before November 10. This article draws no conclusion about any test, product or charter.
- Thin trading. DAC traded about 126,900 shares, about $21.0 million, a day in the 50 sessions before October 2; NTRA traded about $421.7 million. Fills, gaps and slippage in a stock as thin as DAC can be worse than these plans assume.
- Fills and costs. Purchases use the next open. A stop fills at its level, or at the open if the stock opens below it. Daily bars do not show the order of moves within a session. Dividends, commissions, spreads, slippage and taxes are excluded.
- Price basis. Prices are as traded. NTRA’s bars match the app’s. Danaos pays dividends, and the app’s chart is dividend-adjusted. Until October 13 it shows DAC lower than the prices here, by about $0.80 to $1.00 from late July and by more before then: the May 8 base high of $135.21 reads $132.55.
- Whose rules. The views on adding are Minervini’s, Ryan’s, Zanger’s, Ritchie’s and O’Neil’s; the pocket pivot and buyable gap-up are Morales and Kacher’s; the exits are O’Neil’s and Minervini’s; Market Compass adapts its counts from O’Neil. The five add-on tests as a set, the half-size add-on, the five-week minimum read from O’Neil’s flat base, the three-tight-weeks trigger, the market rule, the whole-position worksheet, rounding the half sale down and dating Stage 2 from the 30-week turn are this article’s.
Running it in AlpharvestPro
- After the close, open Three Weeks Tight (O’Neil) or Pocket Pivot (Morales & Kacher), note the data date, and look for stocks you already own.
- Weekly first. Switch the chart to Weekly. Since your first purchase, has the stock built a new base of five weeks or more, or has it only kept climbing? The app’s weekly view does not draw the 30-week average.
- Then the trigger. Mark the high of the tight weeks, or the high before the pocket pivot, and measure how far the close is past it. More than 5% is past O’Neil’s limit.
- Then the market. Open Market Compass and add nothing while it reads Market in Correction.
- Write the whole position. Shares, average cost, the +20% line before and after, the giveback to every stop, and the result if every stop fills. Size the new shares in the position-size calculator; the whole-position lines are yours to write. If the add-on moves the half sale from just above the price to well beyond it, ask whether you are adding or postponing a sale.
- Then the checks. Read the company’s latest release on its investor-relations page, since the app does not show report dates, and find the stock’s Industry Group in the Industry Subgroups ranking (full lists for Pro and Ultra).
- Add the stock to Watchlist Alerts (Pro and Ultra) so the next list day reaches you.
- After the trade, record each add-on’s result separately from the first purchase’s.
Conclusion
A first purchase that works earns the right to ask the next question, not the answer. Ryan adds only on a profit and only after a new base. O’Neil adds smaller and never far past the pivot. Minervini would rather size the first purchase right. All of them are guarding the same thing: the profit the first purchase has already made.
NTRA’s add-on passed most of those tests and paid. DAC’s passed the ones a quick glance checks, a fresh list day, a profit and a healthy market, and failed the base. The worksheet showed the cost before the order: the add-on would carry the half sale from 82 cents above the price to more than ten dollars above it.
Before your next add-on, write the new average cost and the new +20% line beside the chart. If the add-on moves the sale you were about to make out of reach, you are not adding to a winner. You are betting that it has further to run.
Reading and chart notes
Mark Minervini, Momentum Masters, Section 7, questions 10 and 11 (Minervini, Ryan, Zanger and Ritchie on adding to winners; Minervini on gaps), and the sell-half rule; Think & Trade Like a Champion, Section 9 (selling into weakness). William J. O’Neil, How to Make Money in Stocks, Chapter 2 (tight areas, flat bases and breakout volume), Chapter 3 (current earnings and sales), Chapter 11 (pyramiding, the 5% limit, the 20% to 25% move, 20% profits and the 8% loss limit) and Chapter 15 (industry groups). Gil Morales and Chris Kacher, In the Trading Cockpit with the O’Neil Disciples, Introduction (pocket pivots and buyable gap-ups, to start and to add to positions). Stan Weinstein, Secrets for Profiting in Bull and Bear Markets, on the 30-week average. Company facts come from Natera’s second- and third-quarter releases of August 6 and November 5, 2026, and Danaos’s report on Form 6-K of August 4, 2026. Filing times are EDGAR’s acceptance times.
Prices are AlpharvestPro’s as-traded daily archive through November 6, 2026, retrieved November 10; weekly bars are built from the same daily data. List membership comes from the dated records of the Three Weeks Tight list, added on August 11, 2026, and the Pocket Pivot list, added on July 16, 2026. Group ranks come from AlpharvestPro’s published US industry-group ranking as it stood each day, which lists the top 50 and bottom 50 groups; the stocks’ groups are the app’s own assignments. Market readings are Market Compass’s headline as published after each close, from its dated archive, which begins May 1, 2026; days without a published reading are left blank on the charts. All cases were selected retrospectively. The plans are hypothetical, use whole shares and exclude costs; actual stop execution is not guaranteed. A historical list match does not establish when an alert was delivered.

