
A stock appears on a momentum list after three weeks of almost uninterrupted gains. Buying tomorrow feels late. Waiting feels like volunteering to miss the move. Most traders settle the argument with a feeling.
David Ryan settled it with a definition. Asked in Mark Minervini’s roundtable book Momentum Masters about the hardest obstacle in his career, he answered: “When I looked at mistakes I was committing early on in my career, I found that I was buying too many stocks that were extended from their breakout point. Once I corrected that mistake, my performance took off.”
The irony is that Ryan also spent years studying the stocks that kept rising after he refused to buy them.
The stocks Ryan would not buy
Minervini tells the story in Think & Trade Like a Champion. While Ryan was running the New USA Growth Fund with William O’Neil, he noticed that many stocks broke out of a base and quickly became extended. His definition of “extended” was “any stock that is up more than 10 percent from the most recent consolidation.” He would not buy them. Yet some kept climbing.
Ryan reasoned that large funds could not fill their orders in a day or two and kept bidding for weeks. With programmer Rajneesh Gupta, he studied what separated those stocks from short-lived moves. The qualifying sessions earned small marks above the price bars, which he called “ants.” He later described the idea as an MVP indicator: momentum, volume and price. The momentum part is simple to state — the stock is up on 12 of 15 days — while volume expands and the price rises substantially over the same 15 days.
Two instructions travel with the marks. If the stock is extended, Ryan says, “you should wait for a pullback (natural reaction) or a new base to form.” But when the 15-day count begins near the bottom of a base, the stock may not be extended at all, and is then “in position to be bought immediately.”
In the roundtable, Ryan also describes what he wants beneath a purchase: “I like to have some technical support, a base, a moving average, a trendline somewhere in the area of my purchase.”
AlpharvestPro’s ANTS (David Ryan) preset applies this idea of persistent momentum, volume and price. Its dated record begins on August 11, 2026, the first night the list ran. A match is a prompt to open the chart. It does not tell you whether the stock is extended, which consolidation counts, or who did the buying. The two stocks below come from the list’s first two nights, chosen after the fact because they show both halves of Ryan’s rule.
NSIT: on the list the first night
Insight Enterprises, ticker NSIT, was on the ANTS list on August 11. It was also on the Minervini Trend Template list that night, with a relative-strength rank of 90.
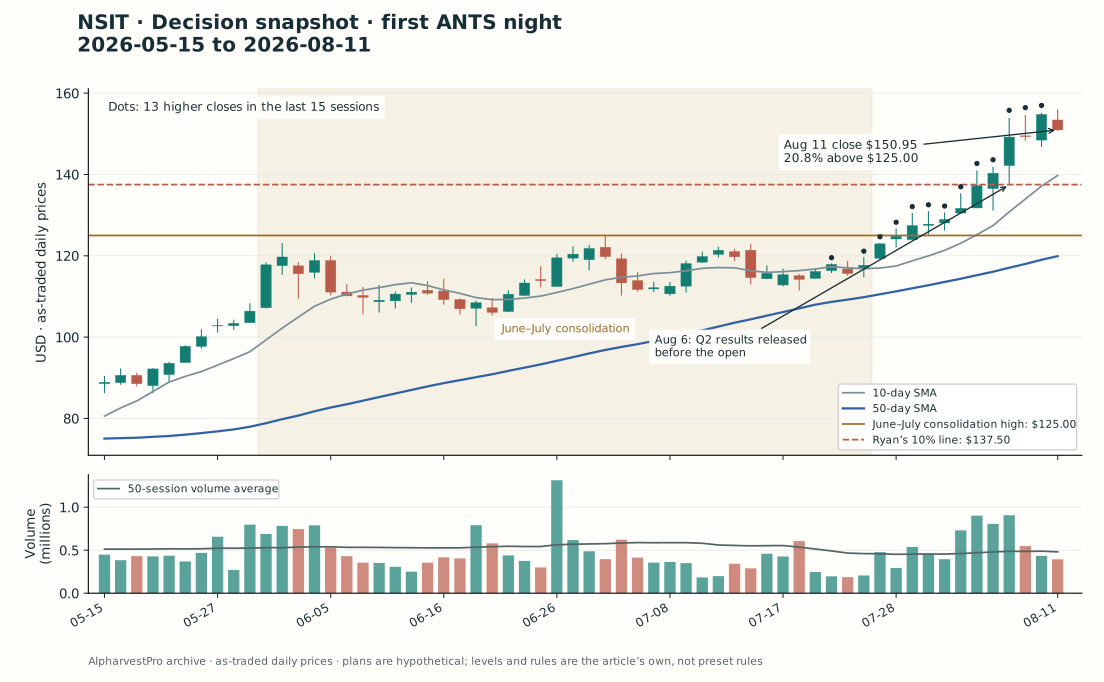
Decision snapshot. No bar after August 11 is shown. The dots and lines are this article’s annotations, not the app’s indicator display. Download the chart observations.
| NSIT at the August 11 close | What the archive shows |
|---|---|
| Closing price | $150.95 |
| Change over the 15 sessions from the July 21 close | +30.0% |
| Higher closes in those 15 sessions | 13 |
| June–July consolidation | $102.68–$125.00 |
| Ryan’s 10% line above $125.00 | $137.50 |
| Distance above the consolidation high | 20.8% |
| 10-day simple moving average | $139.75 |
This was persistence, not one jump. Insight reported second-quarter results on the morning of August 6, ahead of a 9:00 a.m. ET call. That session ranged from $137.43 to $153.91 on 1.9 times its 50-session average volume. Yet no session in the 15-day window opened more than 1.5% away from the previous close.
The timing still matters. NSIT first closed above $125.00 on July 29 and above the 10% line on August 5, and it had closed above that line in every session since. By the time the list first showed it, the stock was already extended. On Ryan’s definition, the first ANTS night was a reason to wait.
ATRC: the harder call
The next night, August 12, AtriCure (ATRC) joined the list. It had appeared on the Minervini Trend Template and VCP Setup (Minervini) lists the night before, and its relative-strength rank was 87.
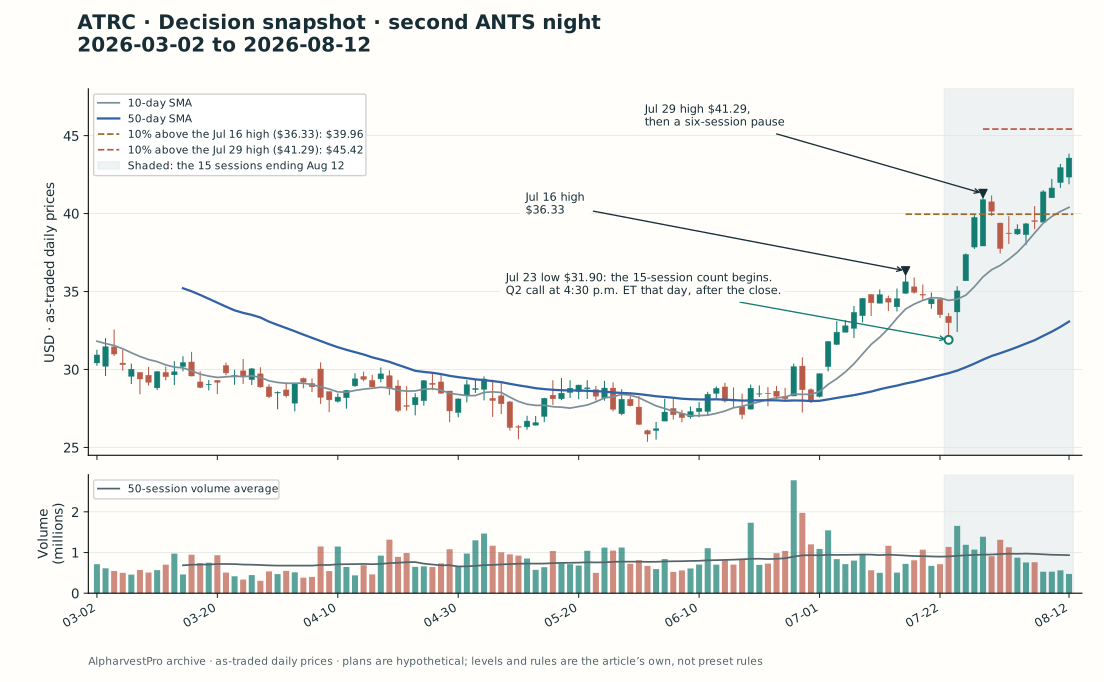
Decision snapshot. No bar after August 12 is shown. Download the chart observations.
ATRC’s count began in an unusual place. The 15 sessions ending August 12 start on July 23, the day of its July low at $31.90. AtriCure reported second-quarter results that day and held its conference call at 4:30 p.m. ET, after the market closed. The next session opened 2.1% higher and closed up 6.2% on 1.8 times its 50-session average volume. Over the 15 sessions the stock rose 30.0%, with 12 higher closes.
Whether ATRC was extended depends on which consolidation you count:
- After peaking at $41.29 on July 29, ATRC paused for six sessions, with a low of $37.44. On that reading, the August 12 close of $43.56 was 5.5% above the high, inside Ryan’s 10%.
- The last larger swing high was $36.33 on July 16. On that reading, the stock was 19.9% above it and extended.
The nearest support was not far away either. The rising 10-day average stood at $40.40, 7.3% below the next morning’s open. The pause low was 14.1% below. Answering the same roundtable question, Minervini describes his approach when support is distant: “If support is too far away to use as a stop level, I simply use a percentage stop that I’m comfortable with.” O’Neil’s ceiling for that percentage is familiar: “a 7% or 8% loss should be the absolute limit.”
Write the plans before you look
ANTS is an end-of-day list, so the first executable price is the next session’s open. Use a hypothetical $40,000 account and a $400 loss budget for each idea.
The waiting plan needs a rule written in advance. This article uses its own version of Ryan’s “wait for a pullback”:
- A pullback begins with the first close below the 10-day average.
- Buy at the next open after the first close above the previous session’s high.
- Place the stop one cent below the lowest low since the pullback began.
- Skip the trade if that stop is more than 8% below the entry.
| Hypothetical plan | Entry reference | Stop | Risk per share | Shares (≤ $400) | Position |
|---|---|---|---|---|---|
| NSIT, buy now | $151.17, August 12 open | $139.08 (8%) | $12.09 | 33 | $4,988.61 |
| NSIT, wait | Next open after the trigger | One cent under the pullback low | Set by the pullback | Set by the pullback | — |
| ATRC, buy now | $43.59, August 13 open | $40.10 (8%) | $3.49 | 114 | $4,969.26 |
| ATRC, wait | Next open after the trigger | One cent under the pullback low | Set by the pullback | Set by the pullback | — |
NSIT’s 8% stop happens to sit just below its rising 10-day average. ATRC’s does too. Neither buy-now plan is reckless by these rules; the question is whether the stock was extended when you bought it.
Before opening the outcome, decide for each stock: extended or not, by your reading of the most recent consolidation? Which plan would you have used?
Reveal what NSIT and ATRC did next
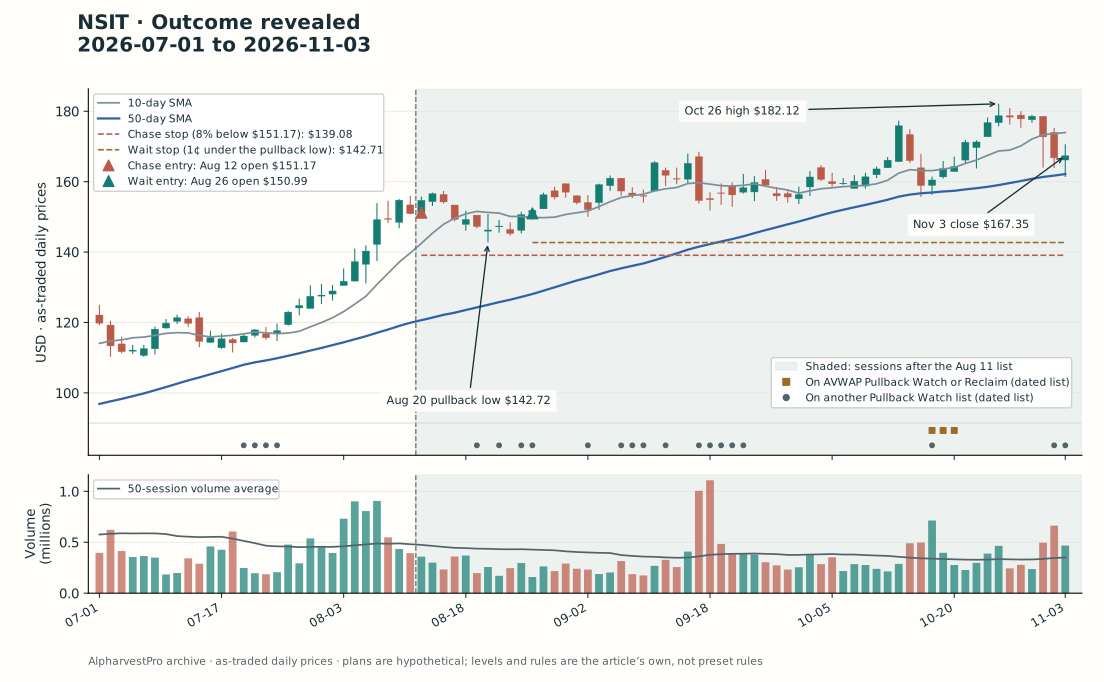
The shaded area was unknown at the decision. The markers along the bottom show dated Pullback Watch list membership. Download the outcome observations.
NSIT. The buy-now plan filled at $151.17. NSIT began to slip on August 14 and stayed on the ANTS list through August 17. That day it first closed below its 10-day average, at $149.31 against $149.66. Volume stayed below its 50-session average throughout the decline. The low came on August 20 at $142.72, 5.6% below the first entry. The $139.08 stop was never reached.
On August 25, NSIT closed at $150.63, above the previous session’s high of $148.41. The waiting plan bought at the next open, $150.99, with a stop at $142.71, 5.5% away. That allowed 48 shares, a $7,247.52 position with a planned loss of $397.44.
Neither stop was touched through November 3. NSIT reached $182.12 on October 26, then fell from $178.57 on October 29 to $167.35 on November 3, with no opening gap larger than 1%. On that date, before costs, the buy-now plan showed an open gain of $533.94, or 1.34R. The waiting plan showed $785.28, or 1.98R. Neither result is realized; no exit rule was specified.
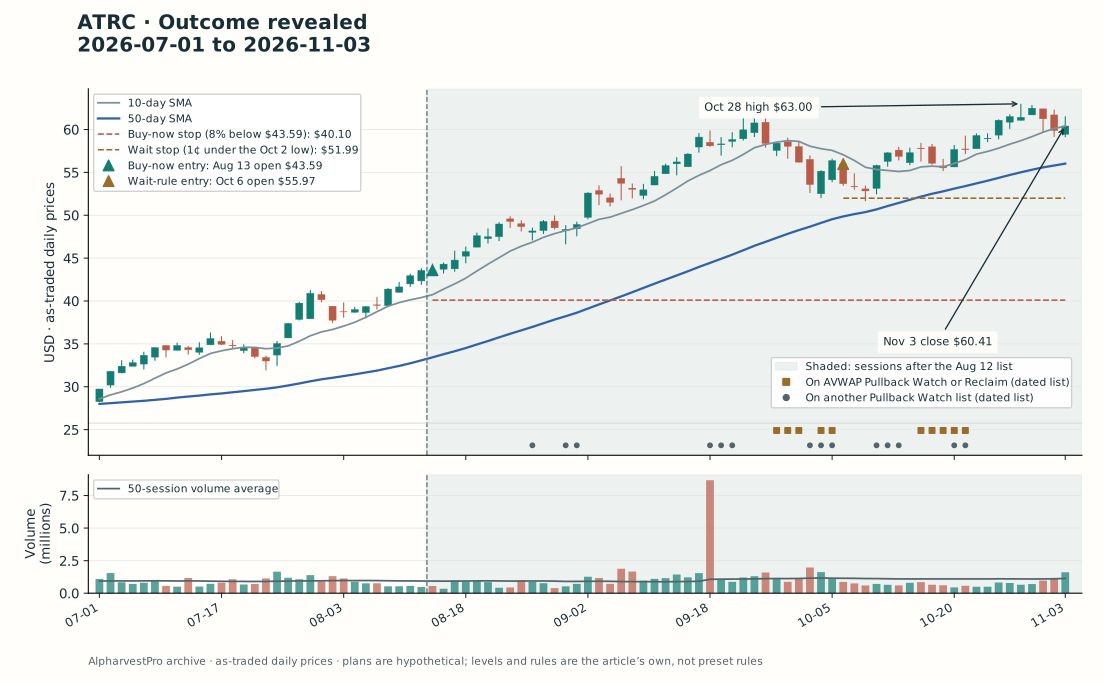
ATRC’s dated list record begins on July 27. Download the outcome observations.
ATRC. The buy-now plan filled at $43.59 on August 13. The stock traded down to $43.03 that day and never lower through November 3. It reached $63.00 on October 28 and closed November 3 at $60.41: an open gain of $1,917.48 on 114 shares, or 4.82R.
The waiting rule had nothing to do for almost seven weeks. ATRC did not close below its 10-day average until September 28. The pullback bottomed at $52.00 on October 2, and the October 5 close of $56.37 cleared the previous high of $55.25. The plan bought at $55.97 on October 6, with a stop at $51.99: 100 shares, a $5,597.00 position and a planned loss of $398.00. On November 3 it showed $444.00, or 1.12R.
What the rule bought, and what it cost
Waiting did not buy NSIT cheaper. The waiting entry was 18 cents below the buy-now entry. What it bought was a failure level the stock had actually tested, on light volume. That level sat 5.5% away instead of 8%, so the same $400 paid for 48 shares instead of 33. That is Ryan’s point about support in the area of the purchase, expressed as a share count.
ATRC shows the price of the rule. A trader who counted the six-session pause as the most recent consolidation saw a stock 5.5% above it, with a count that started at the July low — close to Ryan’s own exception. A trader who measured from July 16 saw a stock 19.9% extended, waited, and bought 28.4% higher in October.
Neither outcome proves which reading was right. Ryan’s rule is not a forecast. It limits the purchases you make without support beneath them, and sometimes that means a smaller gain or a missed move. He is blunt about the alternative: his losing trades come when “I buy a stock that is too extended or whose base is not exactly set up the right way.”
The same count can also mean the opposite late in a long advance. In Section 9 of Think & Trade Like a Champion, Minervini explains why many up days early in a move can signal strength, while similar action from a late-stage base can signal exhaustion. Where the count begins matters as much as the count.
Let the Pullback Watch lists do the waiting
Ryan’s rule turns an extended ANTS name into a stock to watch. AlpharvestPro has a preset category for that stage, Pullback Watch, and each list in it follows a different author’s method. Four describe the pullback itself. Four describe strength returning after it.
The two AVWAP lists show the sequence most plainly. They are inspired by Brian Shannon’s work with the anchored VWAP: the volume-weighted average price of every share traded since a chosen starting point, such as a breakout day. AVWAP Pullback Watch (Brian Shannon) lists leaders testing a rising anchored VWAP during an orderly pullback. AVWAP Pullback Reclaim (Brian Shannon) lists leaders showing renewed strength after that pullback. Reclaim is the stricter of the two, and on some nights it is empty. A video on Shannon’s Alphatrends site sums up the order in its title: “Don’t Buy The Dip… Buy Strength After The Dip.” This article’s trigger works the same way. It waits for the first close above the previous session’s high, not for the low.
The other lists split the same way. OWL VDU Pullback Watch (Morales & Kacher) looks for a pullback on drying-up volume, and OWL VDU Pullback Pocket Pivot (Morales & Kacher) for a pocket pivot out of that quiet pullback. Elder Extreme Pullback (Alexander Elder) and Holy Grail Pullback Setup (Linda Raschke) describe pullbacks within constructive or established trends. CCI Healthy Pullback (Donald Lambert) looks for a pullback and recovery, and Undercut & Rally (Morales & Kacher) for a rally after a stock undercuts a low.
Here is when each stock appeared on each list after its first ANTS night. The markers along the bottom of the two outcome charts show the same sessions.
| Pullback lists | NSIT, Aug 12–Nov 3 | ATRC, Aug 13–Nov 3 |
|---|---|---|
| AVWAP Pullback Watch | Oct 16–20 (3) | Sep 28–Oct 5 (5); Oct 15–21 (5) |
| OWL VDU Pullback Watch | Aug 19–26 (4); Sep 2–14 (5) | Aug 26–Sep 1 (3); Oct 20–21 (2) |
| Elder Extreme Pullback | Sep 17–23 (5); Nov 2–3 (2) | Sep 18–22 (3); Oct 1–5 (3) |
| Holy Grail Pullback Setup | — | Oct 5 (1); Oct 9 (1) |
| Strength lists | NSIT, Aug 12–Nov 3 | ATRC, Aug 13–Nov 3 |
|---|---|---|
| AVWAP Pullback Reclaim | — | — |
| OWL VDU Pullback Pocket Pivot | — | — |
| CCI Healthy Pullback | — | Oct 9–13 (3) |
| Undercut & Rally | Oct 16 (1) | — |
The number in parentheses counts the sessions on the list within each date range; a dash means the stock never appeared. Exact dates are in the outcome chart downloads.
- ATRC: the AVWAP list tracked the pullback. ATRC joined AVWAP Pullback Watch on September 28, the session its first close below the 10-day average began this article’s pullback. It was still on the list on October 5, when the close above the previous high triggered the waiting plan. It never reached AVWAP Pullback Reclaim. The first strength list to show it was CCI Healthy Pullback, on October 9, three sessions after the waiting entry.
- NSIT: a different list caught the pullback. Its August decline never reached the AVWAP lists. It appeared instead on OWL VDU Pullback Watch on four sessions between August 19 and 26, which fits the light volume of that decline. No strength list showed NSIT until Undercut & Rally on October 16, about seven weeks after the waiting entry.
- Each list keeps its own definition. ATRC appeared on OWL VDU Pullback Watch in late August and on Elder Extreme Pullback in mid-September, before it had closed below its 10-day average even once.
So watch the category, not a single preset, and keep your own trigger. Let the pullback lists keep an extended ANTS name in front of you while it rests, and mark the pullback low. Treat a strength list, or your own trigger if it comes first, as the prompt to check the plan. A match does not set the stop or the size: the stop still goes one cent under the pullback low, the share count still comes from the $400 budget, and the 8% cap still applies. Our CPAY article works through an AVWAP Pullback Reclaim match with a strength bar, a stop and a share count.
What this comparison cannot show
- Selection. Both stocks were chosen retrospectively from the first two nights of the ANTS record, and both rose. Many stocks on the same first-week list later fell through an 8% stop. Nothing here measures how ANTS candidates, or Pullback Watch matches, perform.
- Fills and costs. Entries assume the next session’s opening price. Costs, slippage and taxes are excluded, and a gap can carry a stock through a stop. All four results are open on November 3; NSIT’s late-October decline shows how quickly that can change.
- Earnings. Both 15-day windows contained a quarterly report. The app does not show earnings dates, so check the company’s investor-relations page before entering.
- Judgment. The 10% test depends on which consolidation you choose. The levels, the pullback rule and the 8% cap are this article’s stated choices, not Ryan’s formula or the preset’s. Each Pullback Watch list applies its own definition, which this article does not reproduce.
Running it in AlpharvestPro
- After the close, open ANTS (David Ryan) (Pro plan and above) and note the data date.
- Open the chart. Mark the most recent consolidation’s high and the line 10% above it. Note where the 15-session count began.
- If it is not extended, write the entry, stop and share count with the position-size calculator.
- If the stock is above that line, write the waiting rule now and add the ticker to a watchlist. Watchlist Alerts will show when it enters another eligible preset list, including the Pullback Watch lists. Each alert is a prompt to review the plan, not an instruction.
- While it pulls back, check AVWAP Pullback Watch (Brian Shannon) and the other Pullback Watch lists, and mark the pullback low. When strength returns, on AVWAP Pullback Reclaim (Brian Shannon), another strength list or your own trigger, set the stop one cent under that low and size the position. Skip it if the stop is more than 8% away.
- Check the next earnings date on the company’s investor-relations page.
For the next ANTS name you study, finish one sentence before you look at the next open: “It is __% above the consolidation that ended on __, so I will __.”
Reading and chart notes
David Ryan’s remarks are from Mark Minervini, Momentum Masters: A Roundtable Interview with Super Traders, Section 8 (Risk Management) and Section 11 (Final Thoughts); Minervini’s percentage-stop answer is in Section 8. The ants/MVP history and Ryan’s 10% definition are Minervini’s account in Think & Trade Like a Champion, Section 1; the late-stage contrast is in Section 9. William J. O’Neil, How to Make Money in Stocks, Chapter 10. The AVWAP lists are inspired by Brian Shannon; the quoted title is from a December 3, 2024 video on his Alphatrends site. Company events: Insight Enterprises’ August 6, 2026 results release and AtriCure’s July 23, 2026 results release, both filed with the SEC.
Prices and dated list memberships were retrieved on November 5, 2026. The decision cutoffs are August 11 (NSIT) and August 12 (ATRC); the outcomes run through November 3. Prices are as-traded daily observations and match the bars in the app’s charts for both stocks. Averages include the completed session and use earlier warm-up data. Pullback Watch dates come from the same dated record. Dated list history records membership, not proof that a particular user received an alert. Trades are hypothetical, and the cases were selected retrospectively.

