
A badly damaged chart makes the bearish case feel easy. The old buyers are underwater, every rebound looks temporary, and there is a tidy explanation for why the stock deserves to be lower. Then a sharp rally arrives, and the explanation does nothing for the position.
William O’Neil wrote that rally into the rules. In How to Make Money Selling Stocks Short, written with Gil Morales, he warns that if you time a short sale wrongly, “the stock may rally up 15 to 25 percent in price very rapidly, as professional buyers attempt to run in the shorts, even if the stock is ultimately going much lower.” Being right about the stock and wrong about the timing is still a loss.
Short sellers have to be wrong small
O’Neil does not expect a short seller to be right most of the time. He sets the loss limit first, “a little less than the normal eight percent loss limit used for long positions,” and asks for a profit objective at least double that limit: “This allows you to be wrong twice for each time you are right and still not get into financial trouble.” In Short-Selling with the O’Neil Disciples, Morales and Chris Kacher go tighter: “Stop-losses on short positions should range around 3–5 percent.”
Put numbers on it with the second position used below: 206 shares, $1.94 of risk on each. One short covered 20% lower makes $1,594.44. Two that hit their buy-stops cost $799.28. The three trades net $795.16 before costs.
The other half of the arithmetic is worse than on a purchase. A stock you own can only fall to zero. A stock you are short has no ceiling, and it can open far above your stop. Morales and Kacher start from the account rather than the chart: “There are no ‘magic’ stops.” The stop has to fit the most you are willing to lose on the whole account, which makes the share count part of the stop.
O’Neil’s checklist
The first part of the book ends with a short-selling checklist. In brief:
- Market: “Cardinal Rule #1 is to sell short only during what you believe is a developing bear market, not a bull market.”
- Stock: a big leader of the previous advance, liquid enough to resist a squeeze: about one million shares a day or more.
- Time: five to seven months or more after the stock’s peak, often after the 50-day average has crossed below the 200-day.
- Pattern: a head-and-shoulders top, or a late-stage base that fails.
- Timing: not at the neckline, which he calls “too obvious.” After the first break below the 50-day average, the stock usually rallies back through it two to four times. Short the sharp, high-volume break back below.
- Exits: a buy-stop a little under 8% above the entry, and profit objectives of 20–30%.
Before any of it, he says, have your broker confirm that the shares can be borrowed. A short seller also owes any dividend paid while the position is open.
A note before the example
AlpharvestPro’s dated screening record began on July 7, 2026, and its four short screens first appear on July 20. The market rose for that entire period. SPY closed above its 200-day average on every session from July 7 to November 3, and never more than 4.0% below its closing high. O’Neil’s first rule was never met, so no stock in the record can satisfy his full checklist.
Read IREN as an example of how the other five rules look on a real chart, not as a short O’Neil would have taken.
IREN on July 20
IREN (NASDAQ: IREN) was on AlpharvestPro’s Head & Shoulders Top (O’Neil / Morales) list on July 20, 2026, the first night of the short screens. It had been one of the big winners of the previous year, rising from a $5.30 close on April 8, 2025 to $76.41 on November 5, more than 14 times higher. On July 20 it closed at $40.20, 47% below that peak and more than eight months after it.
| Checklist | IREN on July 20 |
|---|---|
| 1. Market | Not met. SPY closed 6.5% above its 200-day average and 0.3% below a rising 50-day average |
| 2. Former leader, liquid | Yes: more than 14 times higher into the November 2025 peak; 48.9 million shares a day (50-session average) |
| 3. Time since the peak | Yes: more than eight months |
| 4. Pattern | On the Head & Shoulders Top list |
| 5. Timing | Not met. The stock rose 19.6% that day on volume 91% above average and closed 23% below its 50-day average ($52.30), which was still above the 200-day ($48.98). This is the obvious short, not the high-volume break back below the 50-day |
| 6. Plan | Hypothetical $40,000 account risking 1% ($400): a 5% buy-stop at $42.21 leaves $2.01 of risk a share, so 199 shares, $7,999.80, 20% of the account |
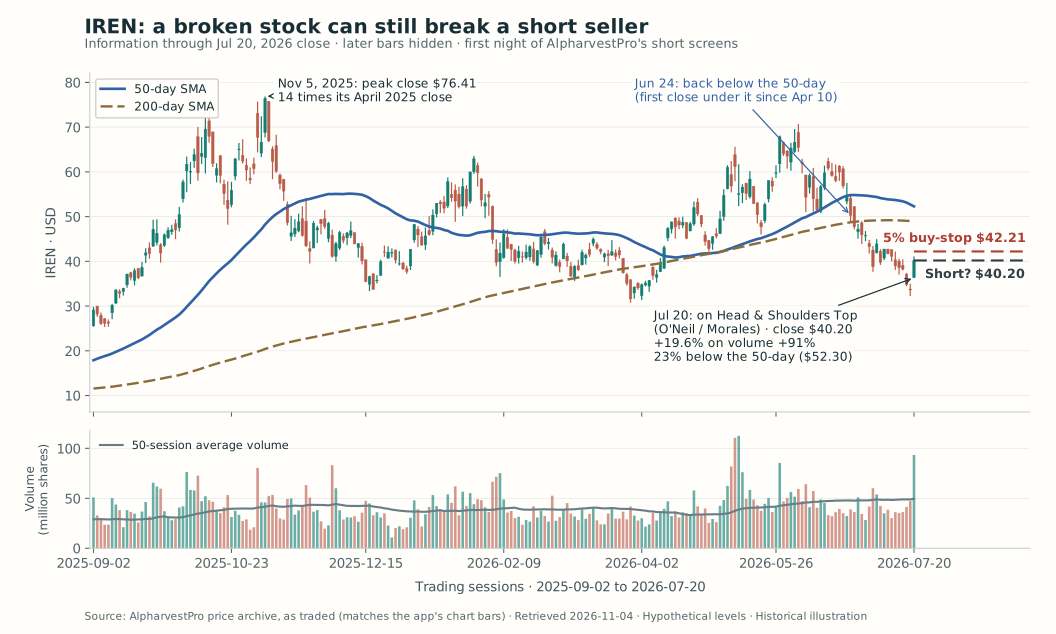
Blue: 50-day SMA. Brown dashed: 200-day SMA. Dark dashed: hypothetical short entry. Red dashed: 5% buy-stop. Tap or click any chart to open it at full size.
The list said the stock had broken. The checklist said the market was wrong for a short and the entry was the obvious one. Would you sell it short on July 20?
Reveal IREN through November 3
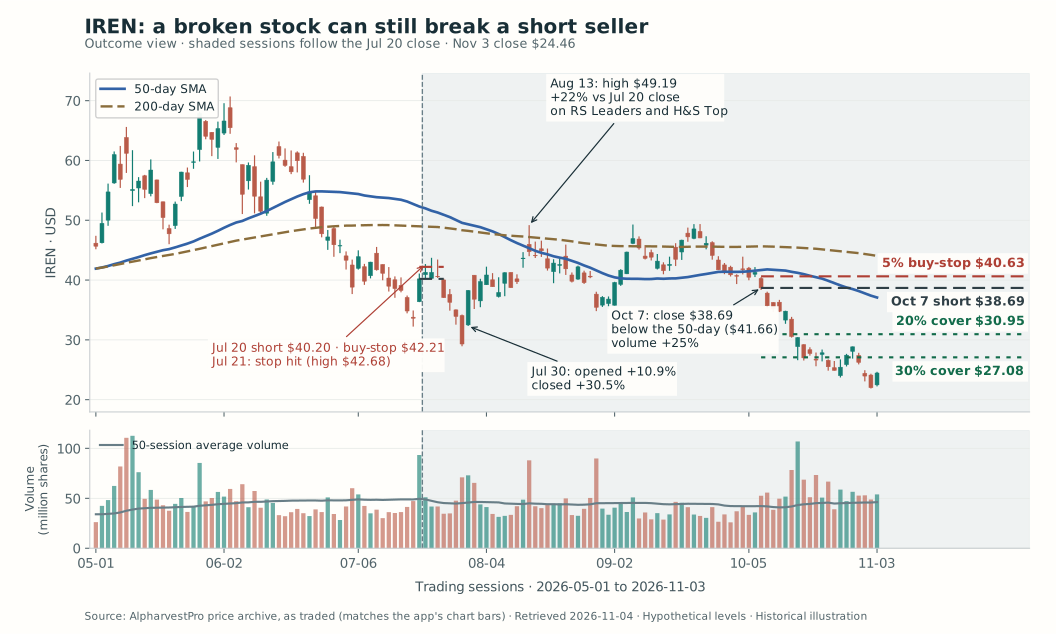
July 21: the high reached $42.68. The 5% buy-stop at $42.21 closed the short for a loss of $399.99, the planned 1%.
July 29: the stock fell to $28.93, 28% below the July 20 close. The bearish read was right; the timing was not, and the stop had already done its job. A short taken at the July 29 close of $29.31, with a 5% buy-stop at $30.78 (272 shares), met a different problem the next morning. IREN opened at $32.51, 10.9% higher, so the buy-stop filled at the open for a loss of $870.40, 2.2 times the plan. It closed that day up 30.5%.
August 13: a high of $49.19, 22% above the July 20 close and 70% above the July 29 low: O’Neil’s 15 to 25 percent, and then some. That night IREN was on two AlpharvestPro lists at once, RS Leaders and Head & Shoulders Top. Lists are research filters, and they can disagree.
August 17 to October 2: IREN closed back above its 50-day average three times: on August 17, from September 3 to 28, and for one day on October 2. These are the rallies O’Neil tells short sellers to wait through. IREN reported fiscal-year results after the close on August 27 and fell 12.5% the next day on twice its average volume, then rallied to $49.37 on September 23. The stock left the Head & Shoulders Top list on September 18.
October 7: a close of $38.69, down 6.3% on the day, below the 50-day average ($41.66) on volume 25% above average. Its closes below the line on September 29 to October 1 and on October 5 and 6 had all come on below-average volume. The 50-day was now below the 200-day ($45.65), eleven months after the peak. Except for rule 1, this is the point the checklist describes. SPY closed 7.6% above its own 200-day average that day.
| Line | Hypothetical short on October 7 |
|---|---|
| Entry | $38.69, the close |
| Buy-stop | $40.63, 5% above |
| Size | $1.94 of risk a share, so 206 shares, $7,970.14, 19.9% of the account; planned loss $399.64 |
| 20% cover | $30.95 |
| 30% cover | $27.08 |
October 14 and 15: the low reached $30.38, then $26.60. The 20% objective covered on October 14, five sessions in, for $1,594.44 (4.0R). The 30% objective covered the next day for $2,391.66 (6.0R). The buy-stop was never threatened: the highest price after October 7 was $38.06, the next day.
Late October: even inside the slide, IREN rallied 21.8%, from a $23.72 low on October 26 to $28.88 on October 28, another short, sharp rally of the kind that can “cause any profits you have in a short position to evaporate.” It closed November 3 at $24.46, 36.8% below the October 7 entry.
| Plan (hypothetical $40,000 account) | Entry | Exit | Result before costs | Multiple of planned risk |
|---|---|---|---|---|
| Short the July 20 list appearance | $40.20 | Buy-stop $42.21, July 21 | −$399.99 | −1.0R |
| Short the July 29 close | $29.31 | Opened through the stop: $32.51, July 30 | −$870.40 | −2.2R |
| O’Neil’s timing, cover at 20% | $38.69, October 7 | $30.95, October 14 | +$1,594.44 | 4.0R |
| O’Neil’s timing, cover at 30% | $38.69, October 7 | $27.08, October 15 | +$2,391.66 | 6.0R |
The same broken stock produced both losses and both gains. The difference was the timing rule. None of the four rows met the first rule.
What the example cannot show
IREN is one stock, chosen after the outcome was known, from a record with no bear market in it. It does not show how often O’Neil’s checklist works or how AlpharvestPro’s short screens perform. The daily bars also cannot show who was buying during the July and August rallies, whether shares were available to borrow, or what borrowing cost. O’Neil’s “run in the shorts” describes the pattern; it is not a finding about who bought IREN.
The size matters more on a short than on a purchase. Each hypothetical position was about 20% of the account. When IREN opened 10.9% above the July 29 close, the buy-stop could only fill at the open, and the planned 1% loss became 2.2%. Had the stock opened where it closed that day, 30.5% higher, the same 272 shares would have lost $2,434.40, about 6% of the account. A stop cannot cap a gap; the share count is what still works. O’Neil also advises against shorting too many stocks too quickly, and suggests achieving one or two gains before shorting a number of them. Known report dates belong in the note: IREN reported on August 27.
Running it in AlpharvestPro
- Market first: compare SPY with its 50- and 200-day averages, and check the breadth readings on Market Compass. If the market is not in a downtrend, O’Neil’s checklist stops at rule 1.
- Screen: on Pro and Ultra plans, AlpharvestPro runs four short screens: Head & Shoulders Top, Late-Stage Failed Base and Punchbowl of Death (O’Neil / Morales), and Bear Flag Continuation (Morales & Kacher). A list appearance is a candidate to study, not an instruction to sell short.
- Chart: the daily chart already plots the 50- and 200-day averages. Mark the peak date and count the months, note each rally back through the 50-day, and use the drawing tools for the entry, the buy-stop and the 20% cover line.
- Size: switch the position-size calculator to Short, then enter the entry, the buy-stop and your risk budget; our CPAY example walks through the arithmetic for a purchase.
- Watch: Watchlist Alerts flag a starred stock’s new list entries, such as IREN joining Bear Flag Continuation on August 26. An alert is a reason to reread the checklist, not to act.
- Borrow: before entering, confirm with your broker that the shares can be borrowed, and at what cost.
Before your next short, write rule 1 at the top of the note, with the date you last checked it. In a rising market, the honest answer to the checklist is usually “not yet,” however broken the stock looks.
Reading and chart notes
William J. O’Neil with Gil Morales, How to Make Money Selling Stocks Short, Part 1, on the market environment, what to sell short, timing, covering and the short-selling checklist. Gil Morales and Chris Kacher, Short-Selling with the O’Neil Disciples, Chapter 2, on stops and position size. The checklist summary, plan tables and routine are this article’s own applications.
NASDAQ: IREN; SPY for the market check. Daily prices are as traded, from the archive behind AlpharvestPro’s charts, retrieved November 4, 2026; IREN’s archived bars match the app’s chart. List appearances come from the dated screening record, in which the short screens begin on July 20, 2026. The first chart ends at the July 20 close; the outcome chart ends November 3. Entries, stops, sizes and exits are hypothetical. Fills use the stop or target price, or the open when the stock opened beyond it, and exclude borrowing fees, commissions, slippage and taxes. The case was chosen after the outcome was known and does not measure how often any method works.

