
A stock doubles in a few weeks, then pauses. Every sideways day starts to look like a high tight flag, and the advance is so impressive that it seems to vouch for whatever comes next. It does not. Two stocks with poles of more than 130% made the same AlpharvestPro list within three weeks of each other. One went on to make money for both buyers in this article. The other stopped out the buyer who placed the obvious order. The difference was in the weekly chart, the flag and the way each plan bought, not in the size of the rally.
What the masters require of a flag
William O’Neil starts with a warning: “A ‘high, tight flag’ price pattern is rare, occurring in no more than a few stocks during a bull market.” His description is specific: “It begins with the stock moving generally 100% to 120% in a very short period of time (four to eight weeks). It then corrects sideways no more than 10% to 25%, usually in three, four, or five weeks.” And he does not oversell it: “This is the strongest of patterns, but it’s also very risky and difficult to interpret correctly.”
Mark Minervini calls the same setup a power play and “one of the most misinterpreted among all the technical patterns.” In Think & Trade Like a Champion he sets out his conditions. The pole: “An explosive price move on huge volume that propels the stock price up 100 percent or more within eight weeks.” Where it comes from: “Stocks that have already made a huge gain coming off a late-stage base usually don’t qualify. The best power plays are stocks that were quiet in Stage 1 and then suddenly explode.” The flag: “not correcting more than 20 percent (some lower-priced stocks can correct as much as 25 percent) over a period of three to six weeks (some can emerge after only 10 or 12 days).” And the closes: “With a power play, you should look for tight weekly closes over three to six weeks.”
He also makes an exception that no other setup in this series gets: “this is the type of situation I will enter even with a dearth of fundamentals.” The chart still has to earn it: “Even the power play must go through a proper digestion of supply and demand.”
So the rally is only the first of four questions. Where did it start on the weekly chart? Did the pole come over weeks or in one day of news? Is the flag shallow, and are its weekly closes tight? And did the stock actually break out?
How we chose these two cases
AlpharvestPro’s High Tight Flag (Power Play) list, in the Consolidation About to Break Out group, surfaces rare high-tight-flag and power-play candidates after the close. It is available on Pro and Ultra. The list was added in July 2026, and its dated record begins on July 17, 2026, the first night it named a stock.
The list is as rare as O’Neil says. We read every US list day from July 17 to October 23 in three steps:
- The weekly stage: a quiet base before the pole, or a long advance already behind it.
- The pole: about 100% in eight weeks, and whether it came over weeks or in a single day of news.
- The flag: its depth under the high, its length, and how tight its weekly closes are.
Then we followed each stock through two ways of buying the breakout and the checks used in this series. Two cases show the difference best:
- CDNA (CareDx) passes the weekly step the way Minervini describes: months of quiet, then the explosion. Its flag was shallow, and its weekly closes were within 3.0% of each other.
- DFTX (Definium Therapeutics) made the same list with a bigger pole. But it had already risen almost fourfold in the year before, the pole came mostly in one day of clinical-trial news, and its flag was deep and loose.
Both were chosen after the outcomes were known, to show the contrast. They do not measure how often a flag works.
| Why each case | CDNA, August 17 | DFTX, July 30 |
|---|---|---|
| Weekly stage | 30-week average between $15.48 and $19.07 from September 2025 to May 2026 | Up 286% in the year before the pole |
| The pole | +130.6% from June 3 to August 3 | +154.5% from May 19 to June 30, mostly in one day |
| The flag | 10.5% deep; weekly closes within 3.0% | 18.1% deep; weekly closes within 9.0% |
| The market | Confirmed Uptrend | Market in Correction |
Step 1: the weekly chart
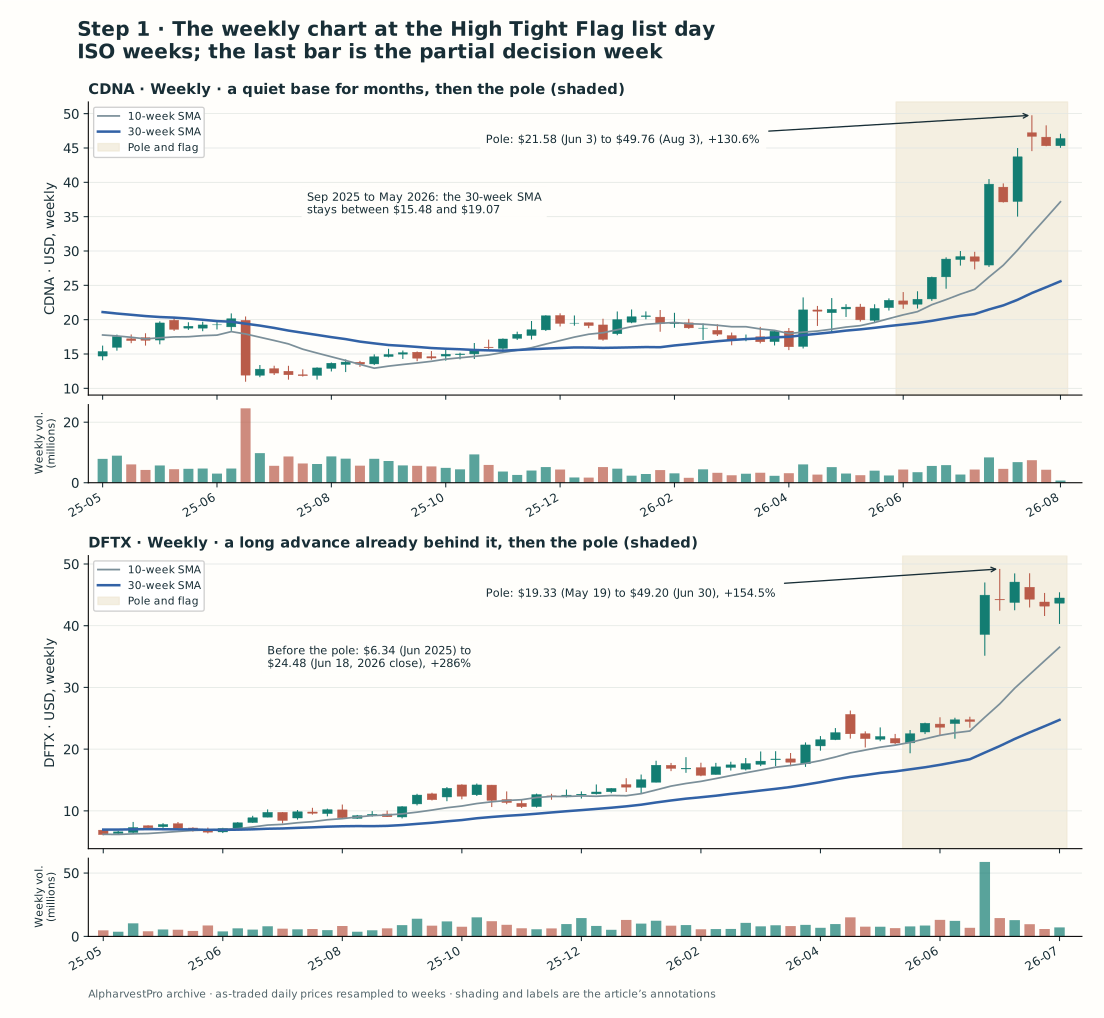
Weekly decision view. Weeks run Monday to Friday; the last bar is the partial decision week. The shading marks this article’s reading of the pole and the flag. Download the weekly observations.
CDNA spent most of a year doing very little. From September 2025 to May 2026 its 30-week average stayed between $15.48 and $19.07, and the stock moved around it. That is the quiet Stage 1 Minervini prefers. By the list day the stock was 81.2% above its 30-week average, which is what a pole does.
DFTX had no quiet stage. It had already risen 286%, from $6.34 in June 2025 to a $24.48 close on June 18, 2026, before the pole began. Minervini’s warning about stocks that “have already made a huge gain” fits it. On the weekly chart, the pole looks like a second leg of a long advance, not an explosion out of a base.
Step 2: the pole
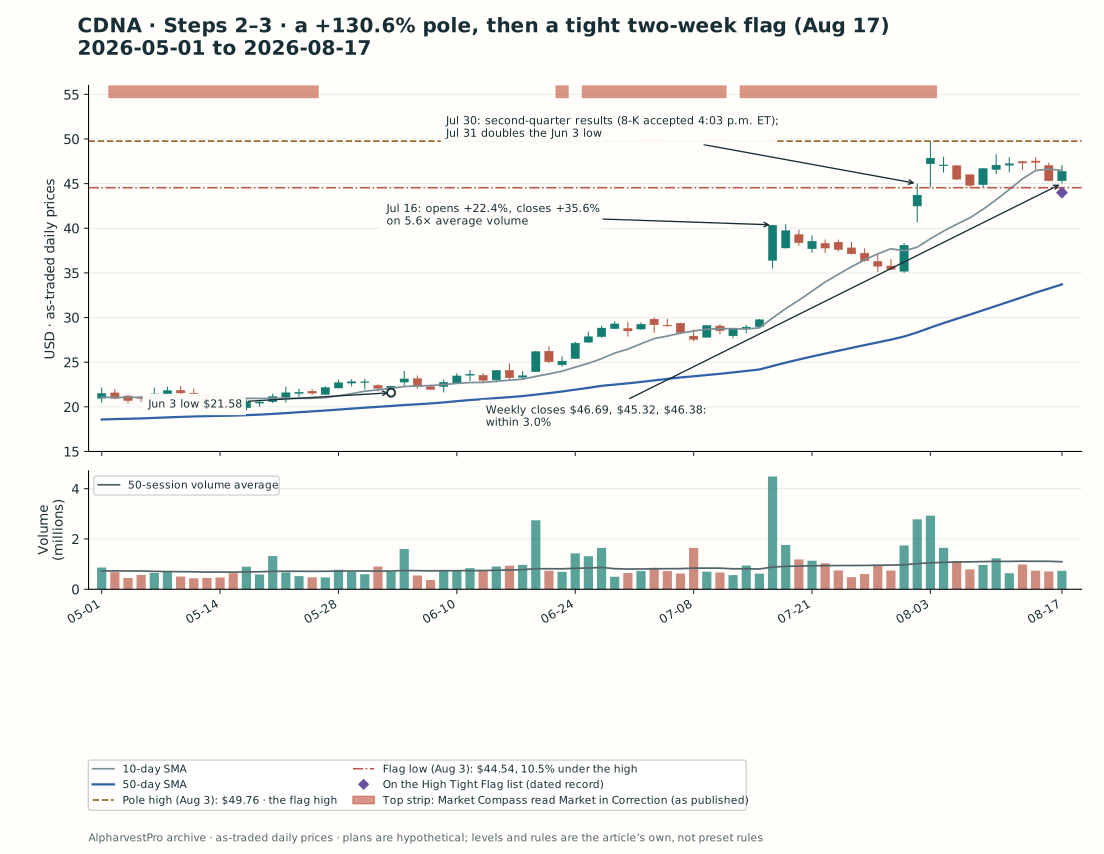
CDNA, daily decision snapshot. No bar after August 17 is shown. The top strip shows Market Compass’s published readings. Download the chart observations.
CDNA. The pole ran from $21.58 on June 3 to $49.76 on August 3, a gain of 130.6% over 41 sessions. It first doubled its low on July 31, 58 days in: just past Minervini’s eight weeks and at the edge of O’Neil’s. It came in steps. On July 16 the stock opened 22.4% higher and closed up 35.6% on 4,484,600 shares, 5.6 times its average volume. CareDx filed no 8-K that day or the day before, so the cause is not established here. In a July 7 filing it had reported completing its acquisition of Naveris and the sale of its lab products business. It reported second-quarter results on July 30; EDGAR accepted the filing at 4:03 p.m. ET. The next day it doubled its June low.
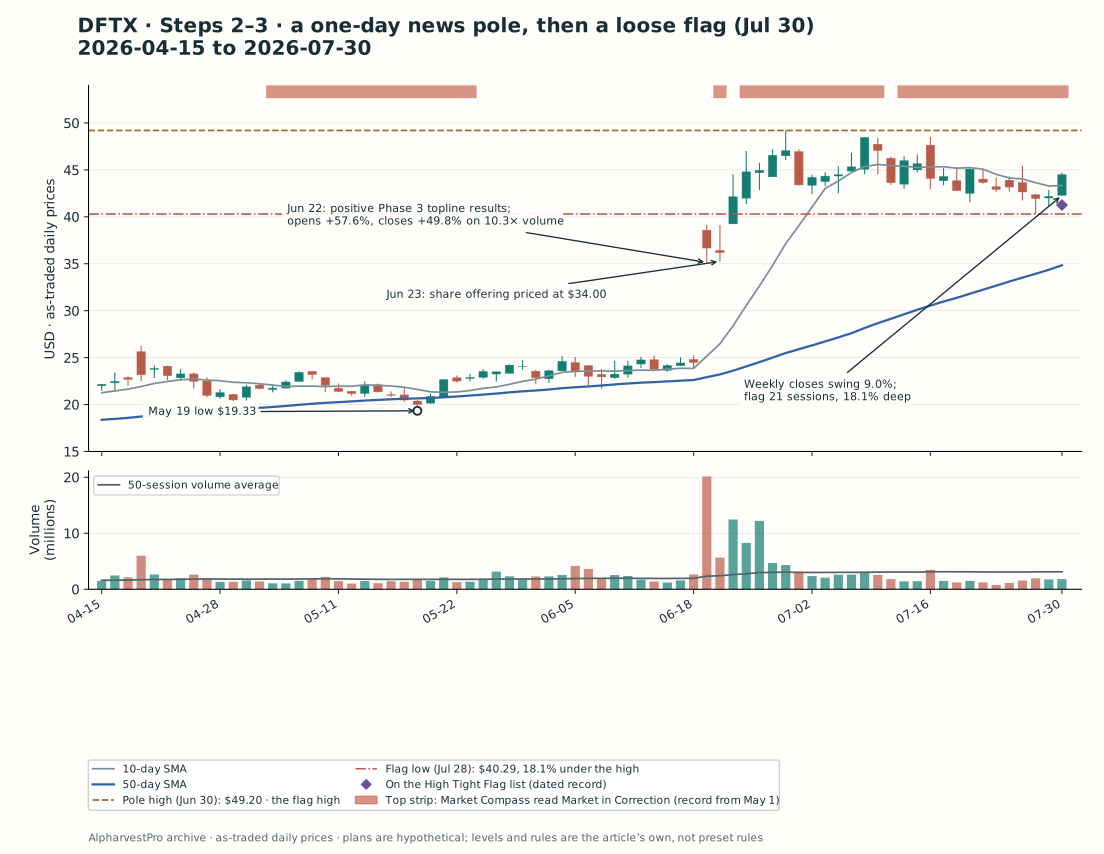
DFTX, daily decision snapshot. No bar after July 30 is shown. The top strip shows Market Compass’s published readings, which begin May 1. Download the chart observations.
DFTX. Definium’s pole was one day. On June 22 the company announced positive topline results from a Phase 3 study; EDGAR accepted the filing at 8:01 a.m. ET. The stock opened 57.6% higher and closed up 49.8% on 20,142,900 shares, 10.3 times its average. The next day it priced a share offering at $34.00 a share. The pole ran from $19.33 on May 19 to $49.20 on June 30, a gain of 154.5%.
Minervini allows a pole made by news, including a drug approval or an earnings report. What news cannot do is make the next step a base. A single repricing day says what the market thought of one announcement. It says less about the steady accumulation that a pole built over weeks suggests.
Step 3: the flag
| On the list day | CDNA, August 17 | DFTX, July 30 |
|---|---|---|
| Close | $46.38 | $44.49 |
| Close vs the flag high | 6.8% under | 9.6% under |
| Flag depth (high to lowest low) | 10.5% | 18.1% |
| Flag length | 10 sessions | 21 sessions |
| Range of the weekly closes | 3.0% | 9.0% |
| Volume vs the previous 50-session average | 0.66 times | 0.58 times |
| Relative-strength rank | 97 | 98 |
CDNA’s flag was short and tight. Its lowest price, $44.54, came on the pole day itself. In the two weeks after it, the stock stayed between $44.57 and $48.29, and its three weekly closes were $46.69, $45.32 and $46.38. Ten sessions is short, but inside Minervini’s “10 or 12 days” exception, and the depth of 10.5% is half his limit.
DFTX’s flag was the opposite. It swung for 21 sessions, as deep as 18.1% under its high, close to Minervini’s 20% limit, and its weekly closes ranged from $43.17 to $47.07. Both stocks were quiet on the list day. Only one of them was tight.
Two ways to buy the breakout
Each plan uses a hypothetical $40,000 account and risks at most $400. The list is published after the close.
- Plan A, a buy-stop: an order one cent above the flag high, working from the next session. It buys the moment the price trades there, at that level or at the open if the stock opens above it. It needs intraday execution.
- Plan B, an end-of-day confirmation: wait for a close above the flag high on volume at least 50% above the 50-session average, then buy the next open. The volume rule is O’Neil’s: a breakout “should be accompanied by a volume increase to at least 50% above the stock’s average daily volume.” This is the article’s rule. It uses only end-of-day information, the same information the list itself is built from.
- The market rule, for both: neither plan buys while AlpharvestPro’s Market Compass reads Market in Correction. Plan A’s order does not work in the session after such a close; plan B waits for a close at which it does not. A close below the flag low cancels both.
The exits follow our earlier article on selling winners, as in the volume dry-up article:
- Stop: 8% below each purchase. The flag low is the level at which the idea has failed, but a deep flag puts it too far away to size around.
- Into strength: sell half when the price reaches 20% above cost. O’Neil’s plan was to “take 20% profits when you have them (except with the most powerful of all stocks),” and Minervini’s “sell half rule” keeps the rest.
- Breakeven: after the half sale, move the stop on the rest to the purchase price.
- Into weakness: sell the rest at the close of the stock’s largest one-day decline since its Stage 2 advance began. Minervini: “If your stock experiences its largest daily and/or weekly price decline since the beginning of a Stage 2 advance, this is almost always an outright sell signal.”
| What was known at the list day | CDNA | DFTX |
|---|---|---|
| Market Compass at that close | Confirmed Uptrend | Market in Correction |
| Plan A’s order | One cent above $49.76, at $49.77 | One cent above $49.20, at $49.21, once Market Compass leaves its correction |
| Plan B’s trigger | A close above $49.76 on more than about 1.7 million shares | A close above $49.20 on more than about 4.7 million shares |
| Both cancelled by | A close below $44.54 | A close below $40.29 |
The checks, before any order
Minervini waives the fundamentals for this pattern. This series does not, because the four checks are the part of CAN SLIM and SEPA a chart cannot show:
- Something new. O’Neil: “It takes something new to produce a startling advance in the price of a stock.” Minervini: “Every stock that makes a huge gain has a catalyst behind it.”
- Numbers that show it. O’Neil advises against buying without “earnings per share up at least 18% or 20% in the most recent quarter versus the same quarter the year before.”
- A market in an uptrend. Misjudge a falling market, he warns, and “three out of four of your stocks will plummet along with the market averages.” After a correction he waits for a follow-through day, because “waiting for powerful follow-through days keeps you from being drawn prematurely into rally attempts that ultimately end in failure.” Market Compass counts distribution days and follow-through days on the major indexes in this way and publishes a reading after each close.
- A leading group. By O’Neil’s account, “roughly half of a stock’s move is driven by the strength of its respective group.”
| At the decision | CDNA | DFTX |
|---|---|---|
| Something new | The Naveris acquisition, completed in July | Positive Phase 3 topline results in a clinical-stage company |
| Latest quarter | Revenue $132 million vs $87 million (+52%); GAAP net income $111 million, which included a $113 million gain on a sale; full-year revenue guidance raised | Second quarter: no revenue; net loss $159.0 million vs $42.7 million |
| Market (Market Compass) | Confirmed Uptrend: the June 25 to August 3 correction had ended with a new closing high in the NYSE Composite | Market in Correction on the list day; Confirmed Uptrend from August 4 |
| Group in the app’s ranking | Medical-Products, outside the top 50 of 192 groups; CDNA’s own relative-strength rank 97 | Medical-Biomed/Biotech, outside the top 50 of 192 groups; DFTX’s own relative-strength rank 98 |
CDNA’s revenue grew 52%, well beyond O’Neil’s minimum for earnings growth, but its earnings figure is not a clean read: the $113 million gain alone was larger than the quarter’s $111 million net income. Its group was outside the top 50, read beside the stock’s own rank of 97, as with HALO in the volume dry-up article. It passes, with that caveat. DFTX had no revenue to measure. A strict reader would stop there; Minervini would not. Under this article’s rules, DFTX was a stock to watch, not to buy.
Before opening the outcome, decide: which plan would you have used, and would you have bought DFTX at all?
Reveal what CDNA and DFTX did next
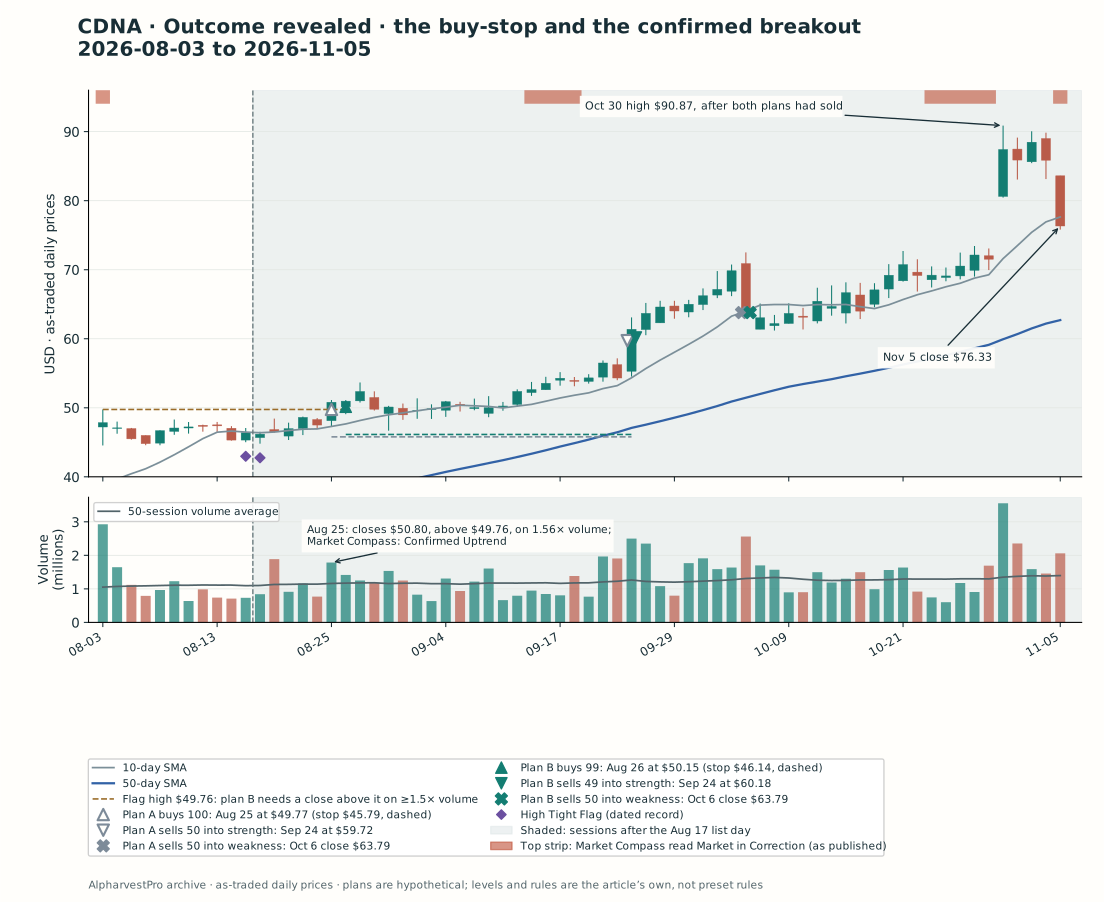
The shaded area was unknown at the decision. The top strip shows Market Compass’s published readings. Download the outcome observations.
CDNA. Plan A’s order filled on August 25, when the stock traded through $49.77 after opening at $48.13: 100 shares ($4,977.00, planned loss $398.00). The same session gave plan B its signal. CDNA closed at $50.80, above the flag high, on 1,784,500 shares, 1.56 times its average, with Market Compass reading Confirmed Uptrend. Plan B bought 99 shares at the August 26 open of $50.15 ($4,964.85, planned loss $396.99). It paid 38 cents a share more for knowing the breakout had held to the close.
Neither stop came close. On September 24 the stock rose 13.0% and passed both +20% levels: plan A sold 50 shares at $59.72 and plan B 49 at $60.18. On October 6 it fell 8.7% to $63.79, its largest one-day decline since its Stage 2 advance began, and both plans sold the rest at that close. Plan A made $1,198.50 and plan B $1,173.47, about three times their planned losses. CDNA kept going without them, to $90.87 on October 30, and closed at $76.33 on November 5.
The top strip shows Market Compass’s published readings. Download the outcome observations.
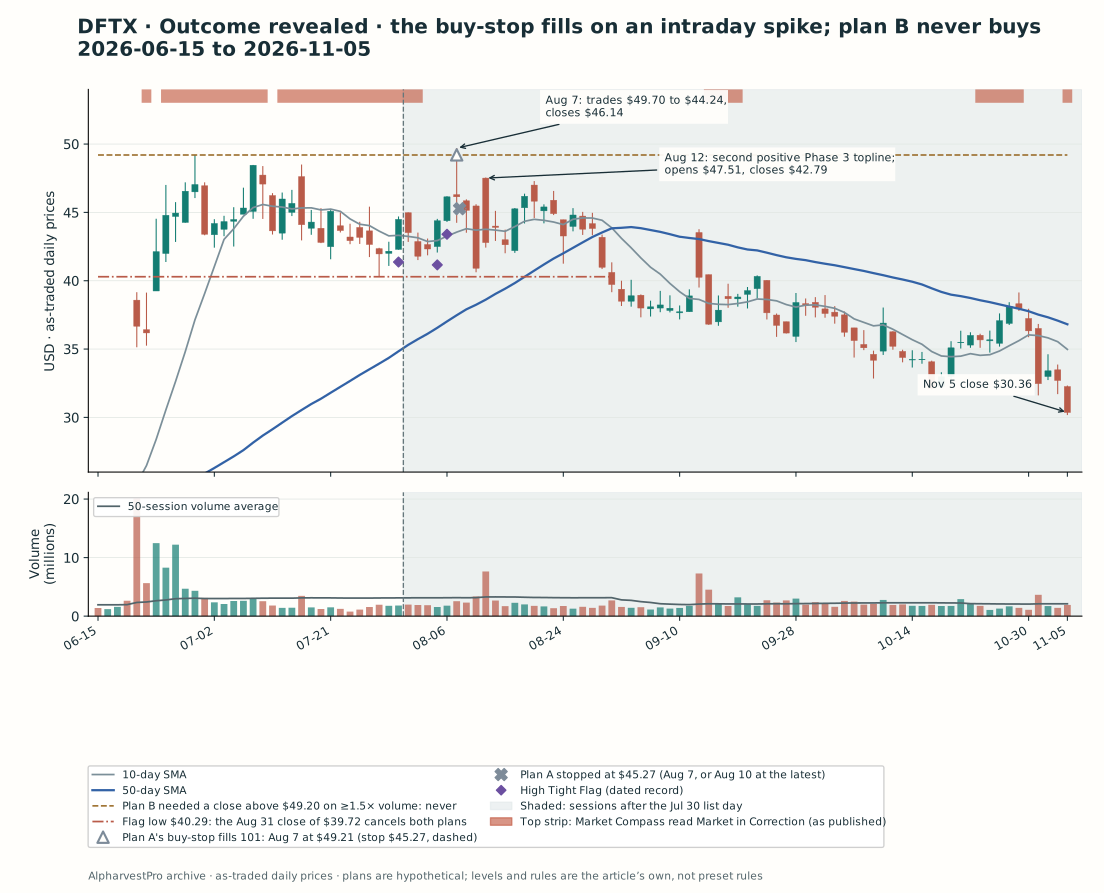
DFTX. Market Compass read Market in Correction until the August 3 close, so plan A’s order first worked on August 5. On August 7 the stock opened at $46.30 and traded up to $49.70, through the $49.21 order: plan A bought 101 shares ($4,970.21, planned loss $397.94). The same session it fell to $44.24 and closed at $46.14. Its 8% stop, $45.27, was inside that range. The daily bar cannot show whether the low came after the fill; if it did, the stop filled that day, and if not, it filled on August 10, when the stock traded down to $43.51. Either way plan A lost $397.94.
Plan B never bought. DFTX never closed above $49.20, with or without the volume. Definium reported second-quarter results on August 6 and a second set of positive Phase 3 topline results on August 12; that morning the stock opened at $47.51 and closed at $42.79. On August 31 it closed at $39.72, below the $40.29 flag low, which cancelled both plans. It closed at $30.36 on November 5.
| Result to November 5 | CDNA | DFTX |
|---|---|---|
| Plan A: buy-stop at the flag high | +$1,198.50 (50 sold at $59.72, 50 at $63.79) | −$397.94 (stopped August 7 or 10) |
| Plan B: end-of-day confirmation | +$1,173.47 (49 sold at $60.18, 50 at $63.79) | No trade: never confirmed; cancelled August 31 |
| Planned loss at entry | $398.00 (A) · $396.99 (B) | $397.94 (A) |
What the close bought, and what it cost
At CDNA the close cost a little. Plan B paid $50.15 instead of $49.77 and finished $25.03 behind plan A, on a trade that worked for both. That is the normal price of confirmation in a stock that does break out.
At DFTX the close was the whole difference. The buy-stop did exactly what it was told: the price traded through $49.21 for part of one session, and the order filled. By the close the stock was back at $46.14, under the flag high, and the evidence that the breakout had failed was already on the daily bar. Plan B, which only reads closes, never saw a breakout to buy. The same rule also sidestepped the question the daily bar cannot answer, which way the session moved first.
That is why this article uses plan B. AlpharvestPro’s lists are built after the close, and a rule that also acts on the close asks for the same kind of evidence the list provides. A buy-stop needs someone, or something, watching during the session. It buys earlier, and it buys every intraday push, including the ones that do not last.
The weekly chart and the flag told the same story before either order. CDNA came out of a quiet base with a tight flag. DFTX came after a long advance, on one day of news, with a flag that swung 9.0% from week to week. O’Neil called the pattern “very risky and difficult to interpret correctly”; reading those two steps first is most of the interpretation.
What these cases cannot show
- Selection. Both stocks came from a screen of the dated record, run after the outcomes were known, and were chosen to show a contrast. Nothing here measures how often either plan works.
- The case we dropped. The first draft of this article used Twist Bioscience (TWST), from the same list on July 17. Its flag was 19.4% deep on the list day, it had already risen about 140% from September 2025 to February 2026, and on August 3, the day of its fiscal third-quarter results, it traded 23.6% under its high before closing up 10.4%. The next day it priced a $300.0 million share offering at $96.00. By Minervini’s depth limit and his warning about late stages, it was not a power play. It never closed below its flag low, though, and on August 5 it closed above its high on 1.84 times its average volume with Market Compass reading Confirmed Uptrend. Plan B would have bought it at $113.76 and made $1,648.37 by October 6; our checks would have refused it, on a net loss. A careful reading can reject a stock that then works. The rules are meant to keep out the DFTXs, and they will sometimes keep out a TWST too.
- Events. CDNA’s pole included an unexplained gap and a results release; DFTX’s was a single clinical-trial announcement followed by a share offering. Daily bars cannot separate those flows from the accumulation the pattern describes. This article draws no conclusion about any trial or product.
- Fills and costs. Purchases assume the stated level, or the open when a session opens beyond it. Daily bars do not show the order of moves within a session; DFTX’s August 7 is the example. Commissions, spreads and slippage are excluded.
- Context checks. The published group ranking lists only the top and bottom 50 of 192 groups, so a group in neither list sits somewhere in the middle. The earnings check reads one quarterly release. The market check uses Market Compass’s headline reading as published after each close; it reads several indexes, and the timing depends on which.
- Price basis. Prices are as traded. Neither stock paid a dividend in the period, and the bars match the app’s.
- Whose rules. The pole, flag and stage criteria are O’Neil’s and Minervini’s, the breakout volume rule and the follow-through day O’Neil’s, and the exits O’Neil’s and Minervini’s. Market Compass adapts its counts from O’Neil. The two plans, the pole and flag definitions, the cancellation rule, the market rule (no purchase while Market Compass reads Market in Correction), rounding the half sale down, dating Stage 2 from the 30-week turn, and the rule that a purchase needs the CAN SLIM and SEPA checks to agree are this article’s.
Running it in AlpharvestPro
- After the close, open High Tight Flag (Power Play) in the Consolidation About to Break Out group and note the data date.
- Weekly first. Switch the chart to Weekly. Was the stock quiet before the pole, or had it already made a long advance? This article’s weekly chart adds Weinstein’s 30-week average, which the app’s weekly view does not draw.
- Then the pole. Measure it from its low to its high, count the weeks, and find the biggest single day in it. If one day made most of the pole, find out what that day was.
- Then the flag. Mark the flag high and the flag low. Is it within 20% of the high? Are the weekly closes tight? Check the company’s investor-relations page for a report date or an offering inside the flag; the app does not show them.
- Write the trigger before it happens: a close above the flag high, the volume it needs (50% above the 50-session average) and the low that cancels the idea. Add the stock to Watchlist Alerts (Pro and Ultra).
- Then the checks. Something new and a quarter that shows it. Then the market: after the close, open Market Compass and buy nothing new while it reads Market in Correction. Then find the stock’s Industry Group, from its diagnostic view, in the Industry Subgroups ranking (full lists for Pro and Ultra), and read it beside the stock’s own relative-strength rank.
- Write the exits before buying: the 8% stop, the +20% line for the half sale and the week the 30-week average turned up. Size the position in the position-size calculator.
- After the trade, record which checks it passed and failed, whatever the result.
Conclusion
A huge rally gets a stock onto the High Tight Flag list. It does not make the stock a high tight flag. O’Neil and Minervini both put the rally first and then ask harder questions: where it started, how it was built, and whether the pause after it is shallow and tight. CDNA answered all three well, and DFTX answered none of them well, though its pole was the bigger one.
Then let the close decide. A buy-stop above the flag high buys every intraday push; a close above it on volume buys only the ones that hold until the end of the day. At CDNA that cost 38 cents a share. At DFTX it was the difference between a full loss and no trade.
The next time a stock doubles and pauses, write down the weekly stage, the biggest day in the pole and the range of the weekly closes before you look at how far it has already gone.
Reading and chart notes
William J. O’Neil, How to Make Money in Stocks, Chapter 1 (historical high-tight-flag examples), Chapter 2 (“High, Tight Flags Are Rare”), Chapters 2 and 3 (breakout volume, current earnings), 5, 9 and 15 (something new, market direction and follow-through days, industry groups) and 11 (20% profits and the 8% loss limit). Mark Minervini, Think & Trade Like a Champion, Section 7 (the power play) and Section 9 (selling into weakness); Trade Like a Stock Market Wizard, Chapter 3 (catalysts); Momentum Masters, on the sell-half rule. Stan Weinstein, Secrets for Profiting in Bull and Bear Markets, on the 30-week average. Company facts come from CareDx’s July 7 and July 30, 2026 filings; Definium Therapeutics’ releases and filings of June 22, June 24, August 6 and August 12, 2026; and Twist Bioscience’s fiscal third-quarter release of August 3, 2026 and offering filing of August 5, 2026. Filing times are EDGAR’s acceptance times. Nothing here is a view on any clinical result.
Prices are AlpharvestPro’s as-traded daily archive through November 5, 2026, retrieved November 9; weekly bars are built from the same daily data. List membership comes from the High Tight Flag list’s dated record, which begins on July 17, 2026. Group ranks come from AlpharvestPro’s published US industry-group ranking as it stood each day, which lists the top 50 and bottom 50 of 192 groups; the stocks’ groups are the app’s own assignments. Market readings are Market Compass’s headline as published after each close, from its dated archive, which begins May 1, 2026; days without a published reading are left blank on the charts. All cases were selected retrospectively. The plans are hypothetical, use whole shares and exclude costs; actual stop execution is not guaranteed. A historical list match does not establish when an alert was delivered.

