
Few things in trading feel more personal. You put your stop just under an obvious low. The stock trades through it, the stop fills, and before the week is out the price is back above the low as if nothing happened. The exit was sensible, and it now looks like a mistake that needs repairing.
That feeling is the trap. A second purchase does not have to prove the first sale wrong. It has to deserve its own money, on its own setup, in a market that allows it. This article follows two stocks that did exactly this on the same AlpharvestPro list, and asks what would have earned a re-entry.
What the masters say about buying back
Mark Minervini’s contingency plan in Think & Trade Like a Champion has two parts that belong together. The stop comes first: “Once I’m out of the stock, I can then evaluate the situation with a clear head.” Then the second look: “If the stock still has all the characteristics of a potential winner, look for a reentry point.” He warns that “It could take two or even three tries to catch a big winner,” and he does not let hope do the work: “You shouldn’t assume that a stock will reset if it stops you out; you should always protect yourself and cut your loss.”
The traders in Minervini’s Momentum Masters roundtable were asked this exact question. Minervini: “Yes, I often reenter a stock that previously stopped me out, but only if the stock sets up another low-risk entry point.” He separates two cases: “Pivot failures can recover very quickly, sometimes in just a few days. Base failures take longer, usually weeks to months depending on how severe the break is.” David Ryan: “My reentry is when the stock again sets up technically.” Dan Zanger is the most patient: “I would not, for example, reenter the stock within a few days of exiting, as it’s clearly having trouble at the breakout area at that time.”
Gil Morales and Chris Kacher explain why stocks undercut an obvious low in the first place. In Trade Like an O’Neil Disciple, Infospace breaks a prior low inside its base on heavy volume: “This appears as a breach of support and hence is interpreted as a bearish development for the stock. However, this is too obvious, so the crowd is faked out here.” They record a rule of William O’Neil’s: “after a stock has consolidated and built a base of at least five weeks, then usually the stock can be bought on pullbacks that are near to or undercut the prior low of the base in the sixth week or later.” And they add a condition from his “shakeout-plus-three” buy: “The turn off the lows following the undercut should be swift.” Their own example of that buy “resulted in a tepid rally, and the stock eventually rolled over and failed.” Minervini likes the same shape in a double bottom: “I prefer an undercut, because it tends to shake out more weak holders.”
The pattern is not only bullish. The same book uses an undercut and rally in a falling stock as a place for short sellers to cover, because stocks undercut and rally even as they trend lower. A reclaimed low is a question about the base, not an answer.
How we chose these two cases
AlpharvestPro’s Undercut & Rally (Morales & Kacher) list, in the Pullback Watch group, surfaces stocks that have undercut a low and rallied back, after the close. It is available on Pro and Ultra. The signal behind it is older than the list: AlpharvestPro has recorded Morales and Kacher’s undercut-and-rally signal for US stocks since February 4, 2026, in its OWL entry-signal report. From May 2026, AlpharvestPro’s web screener showed it inside a combined OWL list, before it became a list of its own on July 16, 2026.
We screened the list’s own dated record, from July 16 to October 23, in the order the masters suggest:
- The weekly stage: the stock is above a rising 30-week average.
- The base: at least five weeks old, so the undercut comes in the sixth week or later, and not yet broken out.
- The undercut: the stock trades under the base’s earlier low and closes back above it quickly.
Then we followed each candidate through the company and market checks used in this series. Two cases make the point:
- AMRX (Amneal Pharmaceuticals) passes every chart step cleanly: week 8 of its base, a shallow undercut, and a strong reclaim on heavy volume. Its market was in correction that day.
- CMI (Cummins) came from the same list with the same kind of day: a stop under an obvious low filled, and a reclaim on heavy volume. Its market was in a confirmed uptrend and its group was among the leaders. Its chart and its company told a different story.
Both were chosen after the outcomes were known, to show the contrast. They do not measure how often a reclaimed low works.
| Why each case | AMRX, September 16 | CMI, August 4 |
|---|---|---|
| Weekly stage | 19.6% above a 30-week average rising since July 2025 | 2.4% above a 30-week average rising since July 2025 |
| Base | Seven weeks from a $19.26 high; 14.0% deep | Nearly seven weeks from a $737.76 high; 21.7% deep |
| The undercut | 1.25% under the August 12 low; reclaimed the next day | 7.2% under the July 17 low, on its results day |
| The market | Market in Correction | Confirmed Uptrend |
Step 1: the weekly chart
Stan Weinstein reads the long-term trend from the 30-week average and is blunt about it: “Stocks trading beneath their 30-week MAs should never be considered for purchase.” Both stocks passed that test on their list days, but not in the same way.
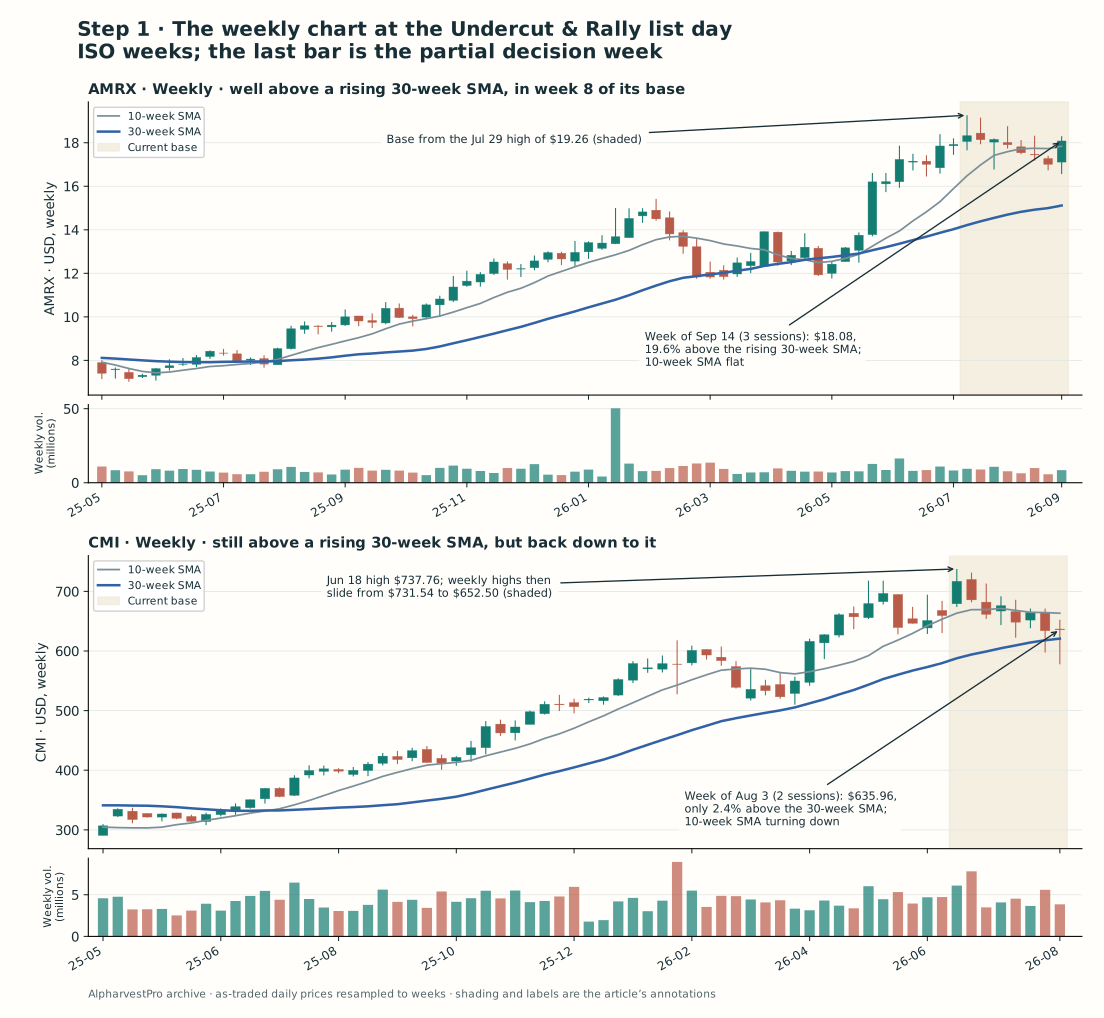
Weekly decision view. Weeks run Monday to Friday; the last bar is the partial decision week. The base shading is this article’s reading of the chart. Download the weekly observations.
AMRX had more than doubled in a year, from $9.49 in September 2025 to the $19.26 high of July 29, 2026. On September 16 it sat 19.6% above its rising 30-week average, with the 10-week average flat. The weekly trend had plenty of room.
CMI had doubled too, from $356.92 to its June 18 high of $737.76. But by August 4 it had come all the way back to its 30-week average, 2.4% above it, and its 10-week average was turning down. Its weekly highs had slid from $731.54 to $652.50 since the top. Weinstein describes a Stage 3 top as the moment the 30-week average “loses its upward slope and starts to flatten out” and the stock begins to “tiptoe below and above the MA on declines and rallies.” CMI was not there yet; its average was still rising. It was at the line.
Step 2: the base and the undercut
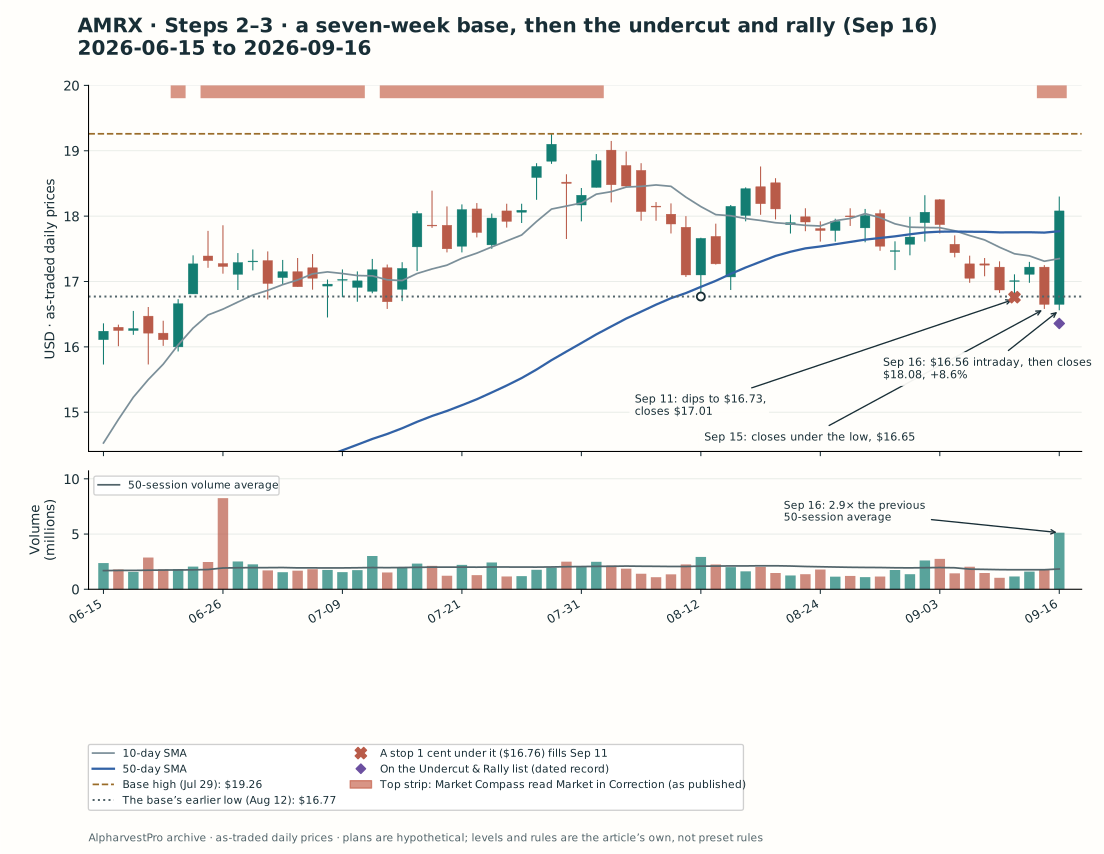
AMRX, daily decision snapshot. No bar after September 16 is shown. The top strip shows Market Compass’s published readings. Download the chart observations.
AMRX. After the July 29 high of $19.26, the stock pulled back to $16.77 on August 12, rallied, and drifted back down through early September. The August 12 low was the obvious floor of the base, and the obvious place for a stop. A stop one cent under it, at $16.76, filled on September 11, when the stock dipped to $16.73 and closed at $17.01. On September 15 it closed under the low, at $16.65.
On September 16 it opened at $16.65, traded at $16.56, and closed at $18.08, up 8.6% on 5,123,500 shares, 2.9 times its average volume. The close was near the top of the day’s range and above the 50-day average. That is the shape Morales and Kacher describe: a breach of support too obvious to work, and a quick turn back up, in the eighth week of a base. The stopped-out holder from September 11 was watching it from the sidelines.
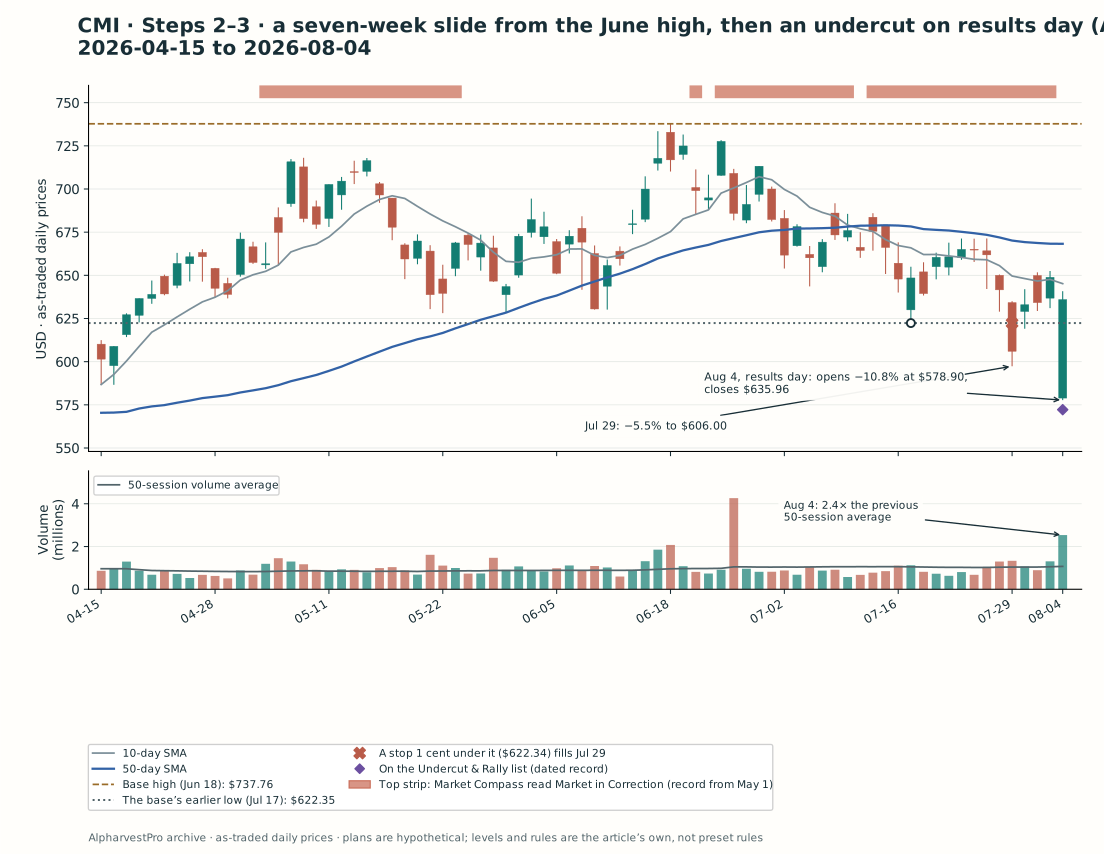
CMI, daily decision snapshot. No bar after August 4 is shown. The top strip shows Market Compass’s published readings, which begin May 1. Download the chart observations.
CMI. After its June 18 high, the stock slid to $622.35 on July 17. On July 29 it fell 5.5% to $606.00, through that low, and a stop at $622.34 filled. The next session it closed back above it.
Then came the results. Cummins released second-quarter results on August 4; EDGAR accepted the filing at 7:58 a.m. ET, before the open. The stock opened 10.8% lower at $578.90, traded at $577.72, and closed at $635.96 on 2,535,000 shares, 2.4 times its average. Back above the July 17 low, it made the Undercut & Rally list that evening. Any stop placed under that low after July 30 would have filled at the open, far below its level. That undercut was an earnings reaction, not a quiet shakeout inside a base.
| On the list day | AMRX, September 16 | CMI, August 4 |
|---|---|---|
| Close | $18.08 | $635.96 |
| Change on the day | +8.6% | −2.0% |
| Volume vs the previous 50-session average | 2.9 times | 2.4 times |
| Undercut below the base’s earlier low | 1.25% | 7.2% |
| Close vs the base high | 6.1% under | 13.8% under |
| Close vs the 50-day average | 1.8% above | 4.8% under |
| Relative-strength rank | 90 | 76 |
Two ways to buy back, and the market rule
Each plan uses a hypothetical $40,000 account and risks at most $400. The list is published after the close, so the first executable price is the next session’s open.
- Plan A, re-enter on the reclaim: buy half the shares the $400 would allow at the next open after the list day. Half, because this is the early entry Minervini allows after a quick reset, and there is no breakout yet.
- Plan B, wait for the pivot: wait for a close above the base high on volume at least 50% above the 50-session average, then buy the full amount at the next open. The volume rule is O’Neil’s: a breakout “should be accompanied by a volume increase to at least 50% above the stock’s average daily volume.” This is the reset Ryan and Zanger wait for.
- The market rule, for both: neither plan buys while AlpharvestPro’s Market Compass reads Market in Correction at the signal close. It waits for the first close at which it does not, with the stock still above the reclaimed low (plan A) or the base high (plan B). A close below the undercut low cancels either plan.
The exits follow our earlier article on selling winners, as in the volume dry-up article:
- Stop: 8% below each purchase.
- Into strength: sell half when the price reaches 20% above cost. O’Neil’s plan was to “take 20% profits when you have them (except with the most powerful of all stocks),” and Minervini’s “sell half rule” keeps the rest.
- Breakeven: after the half sale, move the stop on the rest to the purchase price.
- Into weakness: sell the rest at the close of the stock’s largest one-day decline since its Stage 2 advance began. Minervini: “If your stock experiences its largest daily and/or weekly price decline since the beginning of a Stage 2 advance, this is almost always an outright sell signal.”
| What was known at the list day | AMRX | CMI |
|---|---|---|
| Market Compass at that close | Market in Correction | Confirmed Uptrend |
| Plan A | Waits for the market | Next open; half of a $400 position, stop 8% below |
| Plan B trigger | A close above $19.26 on more than about 2.7 million shares | A close above $737.76 on more than about 1.6 million shares |
| Either plan cancelled by | A close below $16.56 | A close below $577.72 |
The checks, before any order
A reclaimed low says nothing about whether the company deserves to be owned. O’Neil’s CAN SLIM and Minervini’s SEPA ask four more questions, the same four used in the earlier articles of this series:
- Something new. O’Neil: “It takes something new to produce a startling advance in the price of a stock.” Minervini: “Every stock that makes a huge gain has a catalyst behind it.”
- Numbers that show it. O’Neil advises against buying without “earnings per share up at least 18% or 20% in the most recent quarter versus the same quarter the year before.”
- A market in an uptrend. Misjudge a falling market, he warns, and “three out of four of your stocks will plummet along with the market averages.” After a correction he waits for a follow-through day, because “waiting for powerful follow-through days keeps you from being drawn prematurely into rally attempts that ultimately end in failure.” Market Compass counts distribution days and follow-through days on the major indexes in this way and publishes a reading after each close.
- A leading group. By O’Neil’s account, “roughly half of a stock’s move is driven by the strength of its respective group.”
| On the list day | AMRX, September 16 | CMI, August 4 |
|---|---|---|
| Something new | Closed the purchase of Kashiv BioSciences on August 10, “among the few U.S.-based companies to both manufacture and receive marketing authorization for multiple biosimilars” | None identified; the release’s headline was a raised full-year outlook |
| Latest quarter | Second quarter: revenue $796 million vs $725 million (+10%); diluted EPS $0.18 vs $0.07; adjusted diluted EPS $0.30 vs $0.25 (+20%); guidance raised for the second time | Second quarter: revenue $9.5 billion (+9%); diluted EPS $6.73 vs $6.43 (+4.7%); outlook raised |
| Market (Market Compass) | Market in Correction, as it had been since September 15 | Confirmed Uptrend: the June 25 to August 3 correction had ended with a new closing high in the NYSE Composite |
| Group in the app’s ranking | Medical-Generic Drugs, outside the top 50 of 192 groups; AMRX’s own relative-strength rank 90 | Trucks & Parts-Hvy Duty, ranked 25th of 192 |
AMRX’s story and its numbers lined up: a new business line and adjusted earnings up 20%, O’Neil’s minimum. Its group was not among the top 50, but the stock itself ranked 90 on relative strength, so we read the group beside the stock, as with HALO in the volume dry-up article. What failed was the market. Under the rules, AMRX was a re-entry to wait for, not to refuse.
CMI was the reverse. The market passed, and its group was one of the leaders. But nothing new showed in the results, and earnings rose 4.7%, far below O’Neil’s minimum. Under these rules, no plan should buy it back, however strong the reclaim looked.
Before opening the outcome, decide: would you have bought either stock back, and when?
Reveal what AMRX and CMI did next
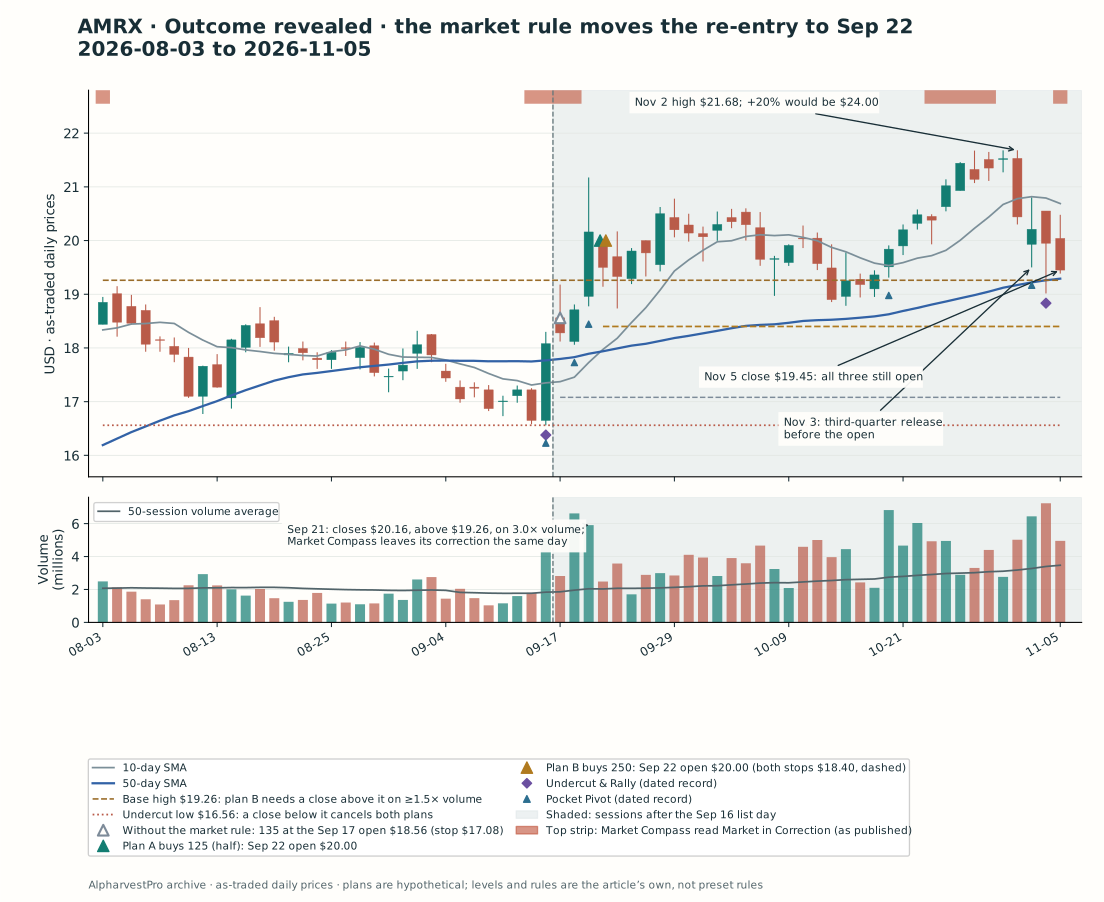
The shaded area was unknown at the decision. The top strip shows Market Compass’s published readings. Download the outcome observations.
AMRX. Market Compass stayed in correction through September 18, so plan A did not buy at the September 17 open. On September 21 two things happened at once. A new closing high in the Nasdaq Composite ended the correction, and Market Compass read Uptrend Under Pressure. AMRX closed at $20.16, up 7.7%, above its $19.26 base high on 5,905,200 shares, 3.0 times its average. Plan A’s market condition and plan B’s breakout arrived on the same session.
So both bought at the September 22 open of $20.00: plan A 125 shares ($2,500.00, planned loss $200.00), plan B 250 shares ($5,000.00, planned loss $400.00). The stock’s lowest price afterward was $18.74 on September 23, well above the $18.40 stop. It peaked at $21.68 on October 30 and again on November 2, 8.4% above the purchase price and far short of the +20% level of $24.00, so nothing was sold into strength.
Amneal reported third-quarter results on November 3; EDGAR accepted the filing at 8:07 a.m. ET, before the open. Revenue rose 10%, to $863 million from $785 million. It reported a net loss of $22 million, against net income of $2 million a year earlier, while adjusted diluted EPS rose 53%, to $0.26 from $0.17, and it raised its guidance again. The stock had already fallen 5.0% on November 2. It was back on the Undercut & Rally list on November 4. On November 5, when SPY fell 4.4%, it closed at $19.45.
The holder stopped out at $16.76 on September 11 could only buy back at $20.00, 19.3% higher. A re-entry does not have to beat the old exit price. It has to deserve its own money, and this one waited for the market to deserve it too.
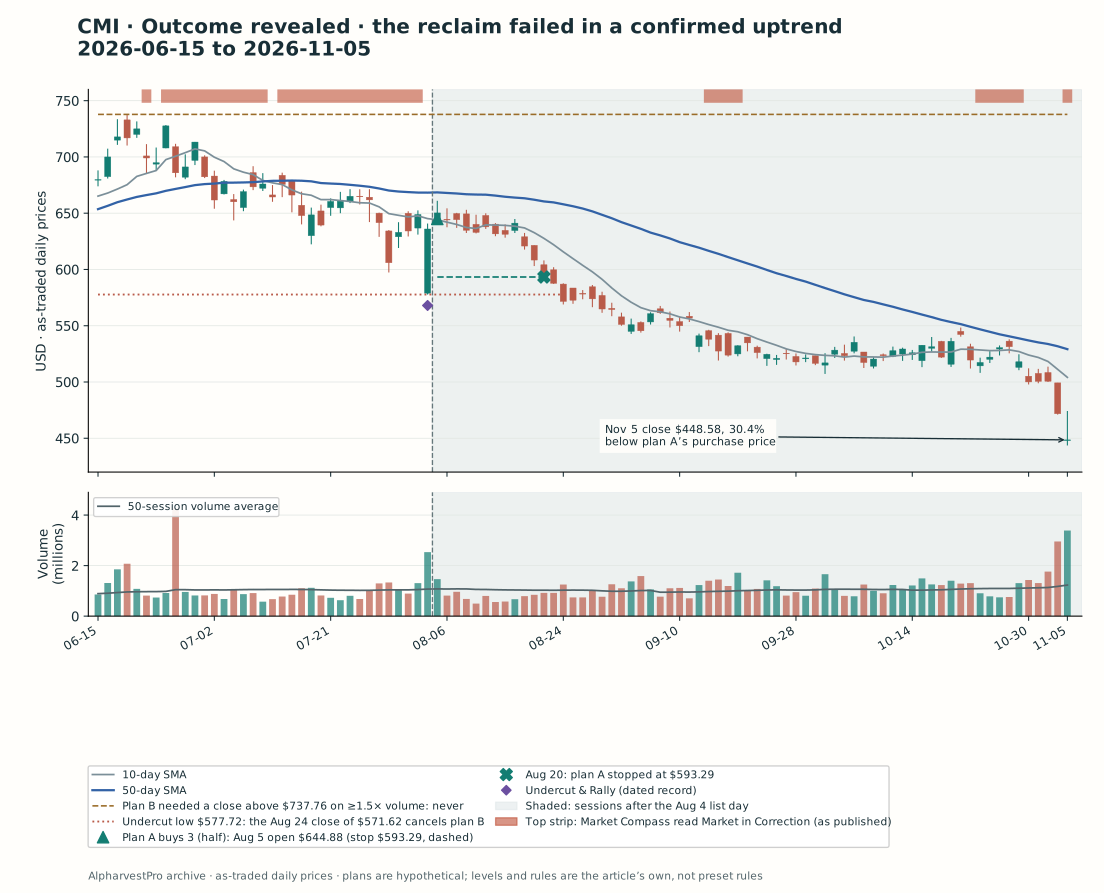
The top strip shows Market Compass’s published readings. Download the outcome observations.
CMI. The market check allowed plan A, so it bought 3 shares at the August 5 open of $644.88 ($1,934.64, planned loss $154.77). The high that day, $661.01, was the best price CMI saw after the list day. On August 20 it fell through the $593.29 stop: plan A lost $154.77. On August 24 it closed at $571.62, below the $577.72 undercut low, which cancelled plan B; it had never come near the $737.76 base high. By November 5 it had closed at $448.58, 30.4% below plan A’s purchase price.
| Result to November 5 | AMRX | CMI |
|---|---|---|
| Plan A: re-enter on the reclaim (half) | −$68.75, open (125 shares bought September 22 at $20.00) | −$154.77 (stopped August 20) |
| Plan B: wait for the pivot | −$137.50, open (250 shares bought September 22 at $20.00) | No trade: cancelled August 24 |
| Plan A without the market rule | +$120.15, open (135 shares bought September 17 at $18.56) | Same as plan A |
| Planned loss at entry | $200.00 (A) · $400.00 (B) | $154.77 (A) |
What the market rule cost, and what it could not do
At AMRX the market rule cost money, so far. A re-entry at the September 17 open, ignoring the market, paid $18.56 and was ahead $120.15 on November 5. Waiting for Market Compass moved the purchase to $20.00, $1.44 a share higher, and both waiting plans were behind. The wait also changed the trade itself: by the time the market cleared, the stock had broken out, so the early re-entry and the confirmed one became the same purchase at different sizes. None of these results is final. All three positions were still open, below their +20% level and above their stops, after a quarter with a net loss and a raised outlook.
At CMI the market rule did nothing at all. Market Compass read Confirmed Uptrend, the group ranked 25th, and the reclaim came on heavy volume. Every outside check said yes, and plan A lost its full planned amount within 12 sessions; by November 5 the stock was 24.4% below the stop price. What would have kept a buyer out was inside the company and on the weekly chart: earnings up 4.7%, nothing new, an undercut made by a results gap, and a stock back down to its 30-week average.
So the market check can delay a good re-entry, and in AMRX’s case it delayed it into a higher price. It cannot make a weak company worth buying back. A leading group cannot either. The checks have to agree, and the chart has to show a base worth trusting, not only a low that held for a day.
Minervini’s line between the two kinds of failure is useful here. AMRX’s stop was taken out by a few cents inside a sound base, a quick reset of the kind he says “can recover very quickly.” CMI’s was the start of something more like his base failure, which takes “weeks to months.” Zanger’s patience would have cost a little at AMRX and saved the whole loss at CMI. Neither stock let anyone know which it was on the day of the reclaim.
What these cases cannot show
- Selection. Both stocks came from a screen of the dated record, run after the outcomes were known, and were chosen to show a contrast. Nothing here measures how often any plan works.
- The case we dropped. The first draft of this article used F5 (FFIV), which made the list on July 27. Its undercut came the day after F5’s fiscal third-quarter release, which EDGAR accepted at 4:06 p.m. ET on July 27. On July 28 the stock opened 3.4% lower, traded 10.1% below the prior close, and closed at $403.46. Its pullback from a $435.00 high was only eight sessions old, not a base, and Market Compass read Market in Correction. With these exits, a full position bought at the July 28 open made $472.80; bought one session later, at the July 29 open, it lost $387.36, after peaking at $483.30 on October 12, $0.85 short of its +20% level, and falling through its stop after the next results. A result that flips on a one-day difference in the entry cannot teach anything about the setup.
- Events. CMI’s undercut came on its results day, and AMRX reported results inside the window. Daily bars cannot separate a reaction to news from the shakeout the method describes. The stopped-out holders’ fills assume the stop price, or the open when a session opens below it.
- Open positions. Every AMRX result is an open position marked at the November 5 close, not a realized gain or loss.
- Fills and costs. Purchases assume the next open; other fills assume the price traded through the stated level. Daily bars do not show the order of moves within a session. Commissions, spreads and slippage are excluded.
- Context checks. The published group ranking lists only the top and bottom 50 of 192 groups, so a group in neither list sits somewhere in the middle. The earnings check reads one quarterly release. The market check uses Market Compass’s headline reading as published after each close; it reads several indexes, and the timing depends on which.
- Price basis. Prices are as traded. AMRX paid no dividend in the period, and its bars match the app’s. CMI went ex-dividend in late August, so the app’s dividend-adjusted chart shows its earlier prices lower than the as-traded figures here, by about $2.40 around the list day.
- Whose rules. The undercut, the sixth-week rule and the swift turn come from Morales and Kacher’s accounts of O’Neil; the re-entry views from Minervini, Ryan and Zanger; the stage reading from Weinstein; the breakout volume rule and the follow-through day from O’Neil; and the exits from O’Neil and Minervini. Market Compass adapts its counts from O’Neil. The two plans, the half size for plan A, the base and low definitions, the cancellation rule, the market rule (no purchase while Market Compass reads Market in Correction), rounding the half sale down, dating Stage 2 from the 30-week turn, and the rule that a purchase needs the CAN SLIM and SEPA checks to agree are this article’s.
Running it in AlpharvestPro
- After the close, open Undercut & Rally (Morales & Kacher) in the Pullback Watch group and note the data date.
- Weekly first. Switch the chart to Weekly. Is the stock in a rising long-term trend, and how far above it? A stock back at its 30-week average is a different case from one well above it. This article’s weekly chart adds Weinstein’s 30-week average, which the app’s weekly view does not draw.
- Then the base. Mark the base high and the earlier low the stock undercut. Is the base at least five weeks old? Did the stock close back above the low within a session or two, or did it drift underneath?
- Ask why it broke. Check the company’s investor-relations page for a report date or news on the day of the undercut. The app does not show earnings dates, and a results gap is not a shakeout.
- Write both triggers before they happen: the reclaim for a half position, the base high and the volume it needs (50% above the 50-session average) for the full one, and the undercut low that cancels both. Add the stock to Watchlist Alerts (Pro and Ultra).
- Then the checks. Something new and a quarter that shows it. Then the market: after the close, open Market Compass and buy nothing new while it reads Market in Correction. Then find the stock’s Industry Group, from its diagnostic view, in the Industry Subgroups ranking (full lists for Pro and Ultra), and read it beside the stock’s own relative-strength rank. A passing market and a leading group do not rescue a failing company.
- Write the exits before buying: the 8% stop, the +20% line for the half sale and the week the 30-week average turned up. Size the position in the position-size calculator.
- If you were the one stopped out, keep the old trade closed in your record. Give the new attempt its own entry, stop and budget, and never enlarge it to win back the first loss.
Conclusion
A stop that fills under an obvious low and a stock that climbs straight back above it is one of the most common sequences on a chart. Morales and Kacher explain why: the low was too obvious. That explains the move. It does not make the stock worth buying back.
Read the reclaim the way the masters do. First the weekly stage, then a base old enough for O’Neil’s sixth-week rule, then a swift turn. Then the company, the market and the group, with the stock’s own relative strength beside it. AMRX passed the chart and the company and was held back only by the market, which cost $1.44 a share. CMI passed the market and the group and failed everything that mattered more.
The next time a stock reclaims the low that stopped you out, write down two things before you act: what it would take for the stock to deserve a new position, and what the market has to say first.
Reading and chart notes
Mark Minervini, Think & Trade Like a Champion, Section 1 (contingency planning and reentry criteria) and Section 7 (the double bottom); Momentum Masters, the roundtable answers on reentering a stock after a stop, and the sell-half rule; Trade Like a Stock Market Wizard, Chapter 3 (catalysts); Think & Trade Like a Champion, Section 9, on selling into weakness. Gil Morales and Chris Kacher, Trade Like an O’Neil Disciple, Chapter 5 (the Infospace shakeout), Chapter 6 (undercuts and short covering) and Chapter 9 (O’Neil’s sixth-week rule and the shakeout-plus-three buy). William J. O’Neil, How to Make Money in Stocks, Chapters 2 and 3 (breakout volume, current earnings), 5, 9 and 15 (something new, market direction and follow-through days, industry groups) and 11 (20% profits and the 8% loss limit). Stan Weinstein, Secrets for Profiting in Bull and Bear Markets, on the 30-week average and Stage 3 tops. Company facts come from Amneal’s second- and third-quarter releases of July 30 and November 3, 2026 and its release of August 10, 2026 on the Kashiv BioSciences acquisition; Cummins’ second-quarter release of August 4, 2026; and F5’s fiscal third- and fourth-quarter releases of July 27 and October 27, 2026. Filing times are EDGAR’s acceptance times; the releases state no time of day.
Prices are AlpharvestPro’s as-traded daily archive through November 5, 2026, retrieved November 9; weekly bars are built from the same daily data. List membership comes from AlpharvestPro’s dated records: the undercut-and-rally signal record, which begins on February 4, 2026, and the Undercut & Rally list’s own record, which begins on July 16, 2026; the case screen covers July 16 to October 23. Group ranks come from AlpharvestPro’s published US industry-group ranking as it stood each day, which lists the top 50 and bottom 50 of 192 groups; the stocks’ groups are the app’s own assignments. Market readings are Market Compass’s headline as published after each close, from its dated archive, which begins May 1, 2026; days without a published reading are left blank on the charts. SPY figures are as-traded closes. All cases were selected retrospectively. The plans are hypothetical, use whole shares and exclude costs; actual stop execution is not guaranteed. A historical list match does not establish when an alert was delivered.

