
A familiar ticker has an advantage that never appears in a valuation model: you already have a story for it. You know the products and you remember the big advance. When the stock stumbles, the mind supplies a reassuring explanation before the chart has earned one. Meanwhile, something less familiar may be attracting steadier demand.
William O’Neil saw this pattern across decades of market cycles: “Many growth leaders in one cycle do not repeat in the next cycle.” Mark Minervini is blunter about what happens to them. In Think and Trade Like a Champion he writes: “Once big market leaders top, they experience an average decline of more than 70 percent!”
Minervini calls this his 50/80 rule: after a secular market leader makes a major top, he estimates an 80% chance of a 50% decline and a 50% chance of an 80% decline. These are his generalizations, not a way to identify a top or predict the size or timing of any one stock’s decline.
Groups move stocks
O’Neil’s reason for watching industry groups is a number. In How to Make Money in Stocks he writes that “37% of a stock’s price movement is directly tied to the performance of the industry group the stock is in,” and another 12% to its sector: “roughly half of a stock’s move is driven by the strength of its respective group.” He also gives the warning that matters most for a watchlist. When important stocks in a group “break seriously, the weakness may sooner or later ‘wash over’ into the remaining stocks in that field.”
Neither master expects every call to be right. “The whole secret to winning big in the stock market is not to be right all the time, but to lose the least amount possible when you’re wrong,” O’Neil writes. A watchlist review is where that happens: cut the old favorite by a rule, and write the new candidate’s buy point and stop before buying.
AlpharvestPro publishes a daily ranking of US industry groups, the Leading groups step of its daily routine. The list is ordered by each group’s average RS rating, and it shows each group’s 3-month price change beside the rank. Because RS looks back a year, the rank moves slowly. The 3-month column moves first.
Friday, August 7, 2026
The ranking. Applied Materials (NASDAQ: AMAT) sits in the Elec-Semiconductor Equip group. Exxon Mobil (NYSE: XOM) sits in Oil&Gas-Integrated. On the evening of August 7, two chip groups were in the ranking’s top 10 and no energy group was.
| Ranking date | Elec-Semiconductor Equip (AMAT) | Oil&Gas-Integrated (XOM) |
|---|---|---|
| June 30 | #3, 3-month +73.6% | Outside the top 50 |
| July 20 | #9, 3-month −0.2% | #47, 3-month −6.6% |
| July 24 | #10, 3-month −11.1% | #36, 3-month −3.0% |
| August 7 | #5, 3-month −12.6% | Outside the top 50 |
The rank still favored chips. The 3-month column for semiconductor equipment first turned negative on July 20 and had been negative every day since July 23.
AMAT, the old favorite. It reached $739.67 on June 30. On Monday, July 20, it closed below its 50-day average for the first time since the high, then recovered the next day. On Friday, July 24, it closed at $536.25, below the 50-day at $537.49. Under the Friday-close version of Minervini’s 50-day rule, which our article on selling winners uses, that was the exit. The lists were slower. On July 24 AMAT was still on RS Leaders with RS 95, and on the Minervini Trend Template. On August 7 it closed at $539.14, still below the 50-day, and it had joined VCP Setup (Minervini) the day before.
XOM, the new candidate. It had been out of favor for months: its 52-week high was $176.41 on March 30, and by June 25 it had fallen 23.5% to $134.95. It joined the Trend Template on July 13. On July 17 it closed above its 50-day average and appeared on RS Leaders and Stage 2 Initiation. Then it paused. After a high of $159.07 on July 29, it pulled back 6.3% to $149.09 on August 4, with volume below its 50-day average on every session from July 27 to August 6.
That pause is what Minervini calls a cheat. The stock pauses and forms “a plateau area (the cheat), which should be contained within 5 percent to 10 percent from high point to low point.” Then: “As the stock rallies above the high of the plateau area, you place your buy order.” XOM’s pause sat in the middle third of its base, between $148.77 and $162.59.
| Watchlist note, August 7 | |
|---|---|
| AMAT | Demote. Friday close below the 50-day on July 24 at $536.25; a holder sells there |
| XOM buy point | $159.07, the high of the pause |
| XOM stop | $149.08, one cent under the pause low |
| XOM size | Hypothetical $40,000 account risking 1% ($400): $9.99 of risk a share, 6.3%, so 40 shares, $6,362.80, about 16% of the account |
| Next reference | The $176.41 52-week high, where O’Neil’s classic new-high breakout would be |
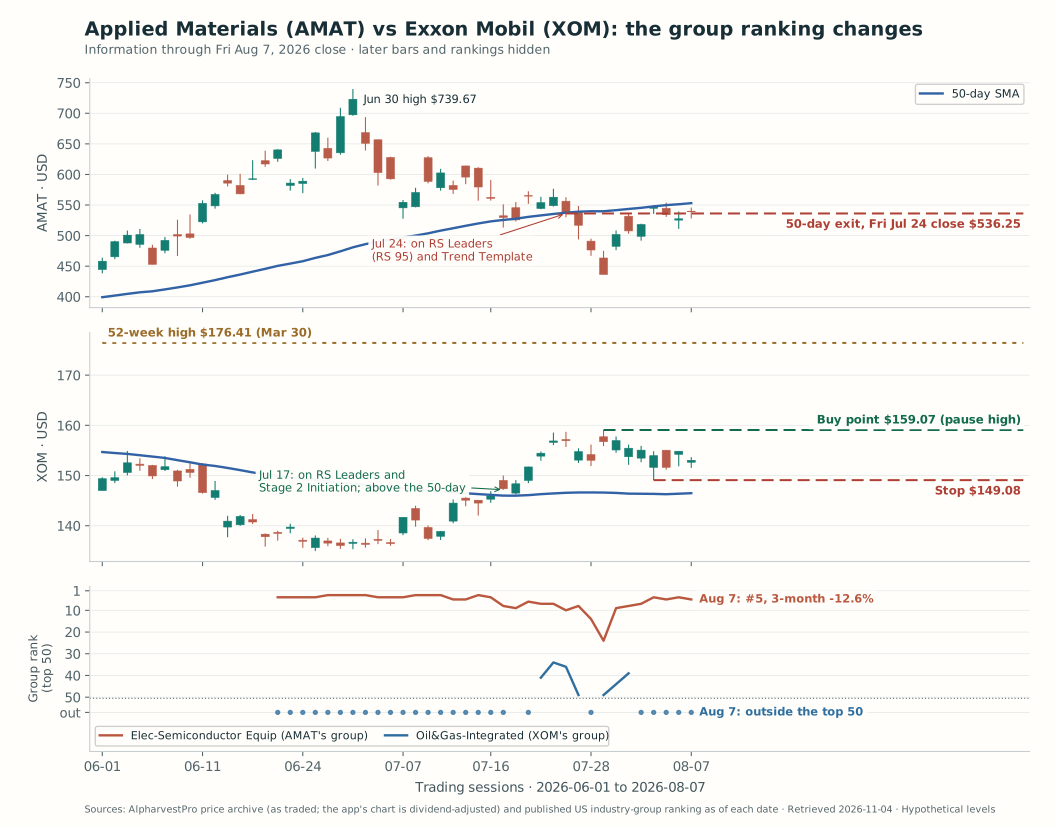
Blue: 50-day SMA. Red dashed: AMAT’s exit and XOM’s stop. Green dashed: XOM’s buy point. Gold dotted: XOM’s 52-week high. Bottom panel: group rank, with dots marking days outside the top 50. Tap or click any chart to open it at full size.
Which name belongs on your active list for the next week?
Reveal AMAT, XOM and the ranking through November 3
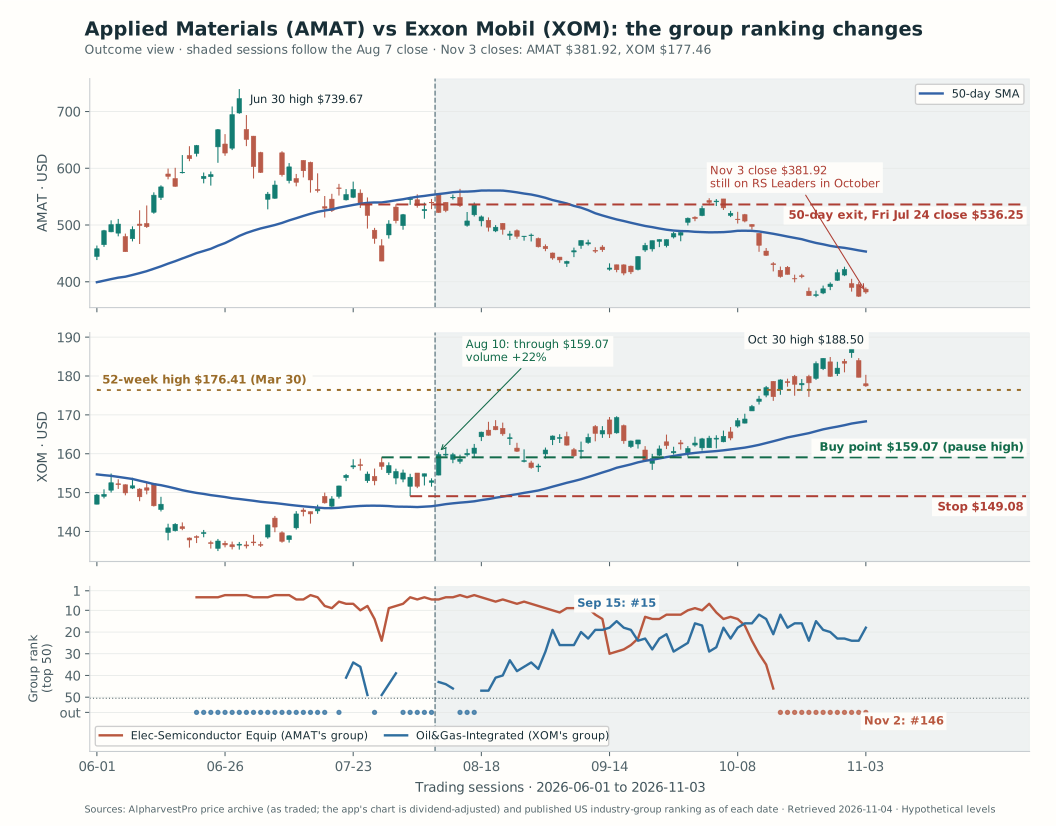
XOM, August 10: it opened at $154.50 and traded up to $160.37, so the buy order filled at $159.07. Volume was 22% above average, short of the 40% to 50% O’Neil likes on a breakout but an increase all the same. The lowest price after the purchase was $154.45, that same day; the $149.08 stop was never near. XOM did not close below its 50-day average again through November 3.
The ranking turned. By September 15, four energy groups were in the top 10 and no chip group was. Oil&Gas-Integrated stayed in the top 30 from August 31 onward.
| Ranking date | Elec-Semiconductor Equip (AMAT) | Oil&Gas-Integrated (XOM) |
|---|---|---|
| September 15 | #29, 3-month −30.7% | #15, 3-month +16.5% |
| October 2 | #7, 3-month −0.8% | #29, 3-month +9.2% |
| October 15 | #46, 3-month −18.4% | #21, 3-month +3.4% |
| November 2 | #146, 3-month −29.4% | #24, 3-month +2.4% |
Semiconductor equipment bounced back to #7 on October 2 before falling out of the top 50 on October 16. A ranking can whipsaw too, which is why the rule sits on the stock’s own 50-day line, not on the group’s rank.
XOM, October: on October 14 it closed at $177.01, above its 52-week high, on average volume. On October 30 it reached $188.50 on volume 67% above average. It closed November 3 at $177.46, up $735.60 on the 40 shares, 1.8 times the planned risk, and still open.
AMAT: it closed November 3 at $381.92, 28.8% below the July 24 exit and 48.4% below its June high. It did close back above its 50-day average once, on September 29, and fell below it again on October 13. Through all of it, the 12-month RS kept it on RS Leaders: RS 83 on October 15. By then its Minervini Score had fallen to 6.
The old favorite never stopped looking like a leader on a 12-month view. The rank of its group took until October to agree with the price. What changed first were the things a weekly review can check in a few minutes: the Friday close against the 50-day line, and the group’s 3-month column.
What the example cannot show
AMAT and XOM were chosen after the outcome was known, and they are only two stocks. The ranking is one view of group strength. It shows the top 50 and bottom 50 groups each day, and groups move in and out of it. A falling group can rebound: semiconductor equipment returned to #7 for a day in October. XOM’s gain is open and modest, and a stop can still be gapped. Nothing here measures how often the rule works, or how AlpharvestPro’s ranking or lists perform.
The two positions also differ in risk. XOM’s 40 shares were about 16% of the account. AMAT’s exit rule limits a holder’s damage only from the exit onward; it does not recover the 27.5% already lost from the June high to the July 24 close.
Running it in AlpharvestPro
- Groups, weekly: open the Leading groups ranking. For each stock on your list, note its group’s rank and its 3-month change. A group still ranked high with a negative 3-month column is a question, not a confirmation. A stock’s Industry Group and Industry-Group Peers (by RS) appear in its diagnostic view.
- Stocks, every Friday: compare each close with the 50-day line, and check the Minervini Score. RS Leaders reflects a year of strength; it will be the last to let go.
- Demote by rule: a Friday close below the 50-day removes a name from the active list. For a holder, it is the exit our selling article describes.
- Promote with a plan: write the buy point and the stop, and size it in the position-size calculator. Our CPAY example walks through the arithmetic.
- Watch: Watchlist Alerts flag a starred stock’s new list entries, such as XOM joining Near 52-Week High on August 10, the day it traded through its buy point.
The review takes a few minutes. Skipping it costs more: AMAT stayed on RS Leaders through most of the fall and closed November 3 28.8% below the price at which the 50-day rule had said to leave.
Reading and chart notes
William J. O’Neil, How to Make Money in Stocks, Chapter 4, on growth leaders not repeating; Chapter 10, on limiting losses; Chapter 15, on industry groups. Mark Minervini, Think and Trade Like a Champion, Section 5, on the declines of former leaders, and Section 7, on the cheat. The watchlist note, plans and routine are this article’s own applications.
NASDAQ: AMAT; NYSE: XOM. Daily prices are as traded, from the archive behind AlpharvestPro’s charts, retrieved November 4, 2026. The app’s chart adjusts earlier bars for dividends, so some levels read slightly lower there: XOM’s March 30 high shows as $174.09, and its July 29 high as $158.05. Group ranks come from AlpharvestPro’s published US industry-group ranking as it stood each day, which lists the top 50 and bottom 50 of 184 to 192 groups. List appearances come from the dated screening record. The first chart ends at the August 7 close; the outcome chart ends November 3. Entries, stops and sizes are hypothetical and exclude costs, slippage and taxes. The case was chosen after the outcome was known and does not measure how often any method works.

