
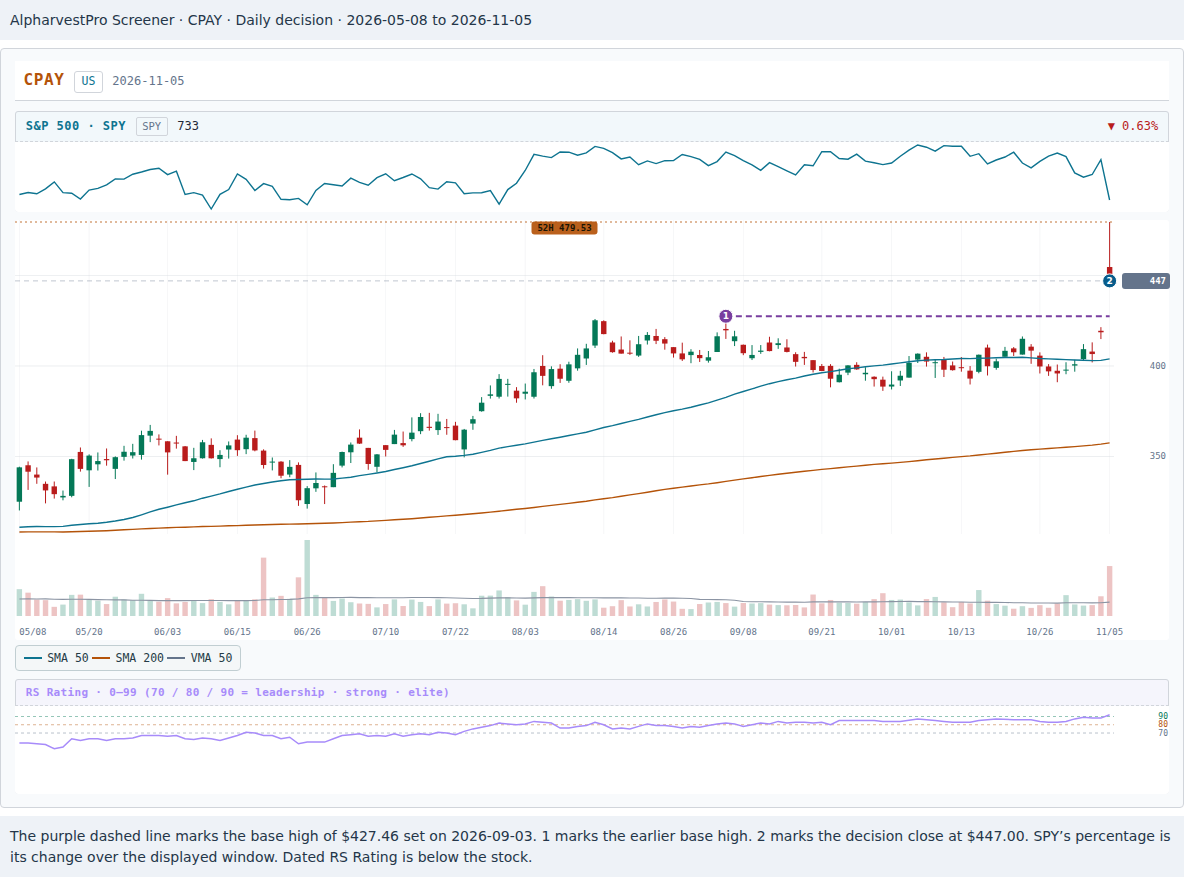
On November 5, 2026, Corpay closed at $447.00. Its September high had been $427.46. Earnings were up, trading volume was nearly four times normal, and the stock had cleared a price that had held for two months. That evening’s Market Compass report put the US market back in Market in Correction. Which piece of evidence would decide what you did at the next open?
David Ryan faced this question in Section Six of Momentum Masters. He explained that “the leading stocks in many cases break out sometimes months before the market starts into an uptrend.” Ryan said he might start with 5% of his account in the stock instead of 10%, then add if the stock continued to follow through. Mark Minervini gives a similar reason for keeping a watchlist during a correction. Many of the big advances he studied began as the market emerged from one. In Chapter 13 of Trade Like a Stock Market Wizard, he describes buying small as watchlist stocks emerge and the market tries to rally off its lows. Read Minervini’s August 30 story (select English)
A smaller purchase and a later purchase sound like two ways to be cautious. They put your money at risk on different days. Corpay (CPAY) and Royal Gold (RGLD) let us see that difference during the same correction.
Corpay was on the watchlist before earnings
Start with the weekly chart. Corpay entered Three Weeks Tight (O’Neil) on October 6, was still on the list on October 23 and left it on October 26. A trader who saved the name had a reason to keep watching through earnings. The trade considered here has a separate buy point, the September 3 high of $427.46. The stock fell to $386.23 on September 30. Even the late-October pullback held above that low, at $391.01 on October 28. By the November 5 close, the 10-week average was $406.92, above a rising 30-week average of $374.91. That Thursday’s weekly candle still had Friday to run.
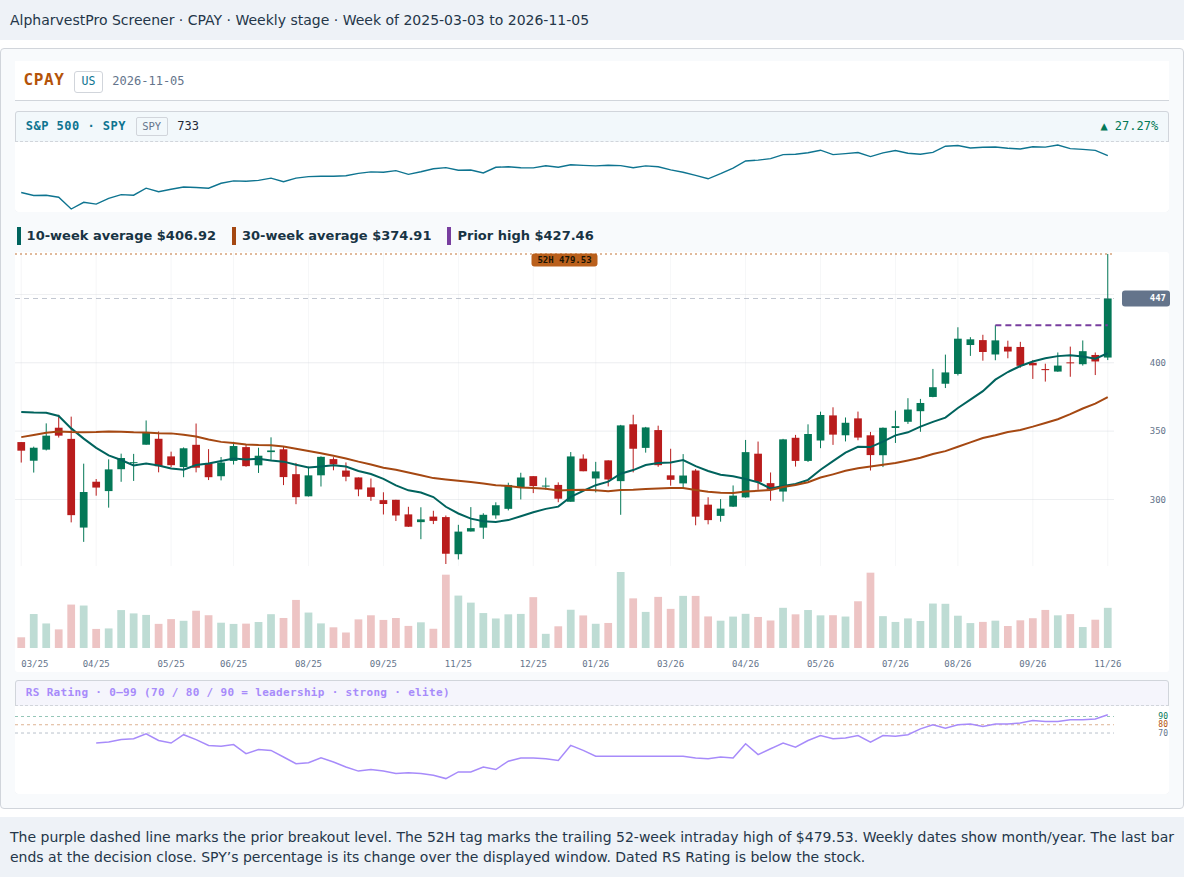
There was a business reason to take a second look. On September 24, Corpay announced new AI agents for accounts payable and spend management inside Corpay Complete. On November 4 it reported third-quarter revenue growth of 18%, with diluted earnings of $5.66 a share against $3.91 a year earlier. Those numbers were public before the breakout session. Corpay product announcement · Corpay quarterly results
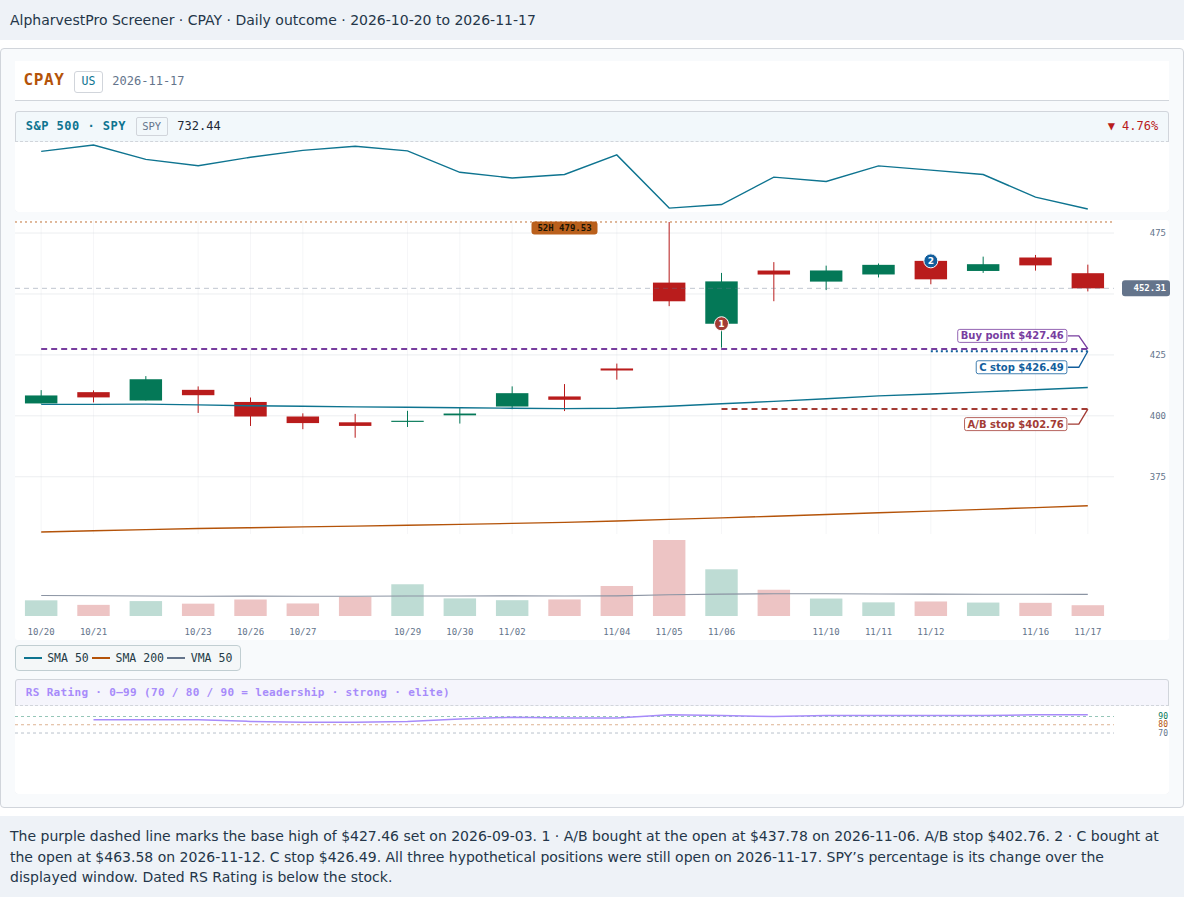
The daily candle makes the decision harder. After earnings, Corpay opened at $454.66, already above the buy point and well above the previous close of $418.60. It traded as high as $479.53, then gave back much of the move to close at $447.00. It still finished above the buy point on 3.79 times the average volume of the preceding 50 sessions. Its RS Rating was 92. The latest group ranking archived before the November 6 open was dated November 3. The archive has no November 4 or 5 ranking. Corpay’s group, Financial Svcs-Specialty, did not appear in the archived top 50. The market had also deteriorated. The November 5 report said the NYSE Composite had broken the low where its rally began.
Royal Gold gave the same market a second chance
On November 4, Royal Gold returned to both the Minervini Trend Template and RS Leaders (O’Neil) lists. It was still on both on November 9, when its RS Rating was 87. That Monday the 10-week average stood at $246.80. The 30-week average had slipped from $230.66 to $230.63 between the last two completed weeks. Adding Monday’s close nudged it to $231.11, with four sessions left in the week. The daily lows tell a less tidy story. The stock bottomed at $223.02 on October 14. Its next pullbacks reached $225.59 and $225.23. Both held above the bottom, though the second slipped under the first. The price to clear was still the August 28 high of $271.43. The app’s dividend-adjusted history shows $270.88 for that high. We use the as-traded $271.43 throughout.
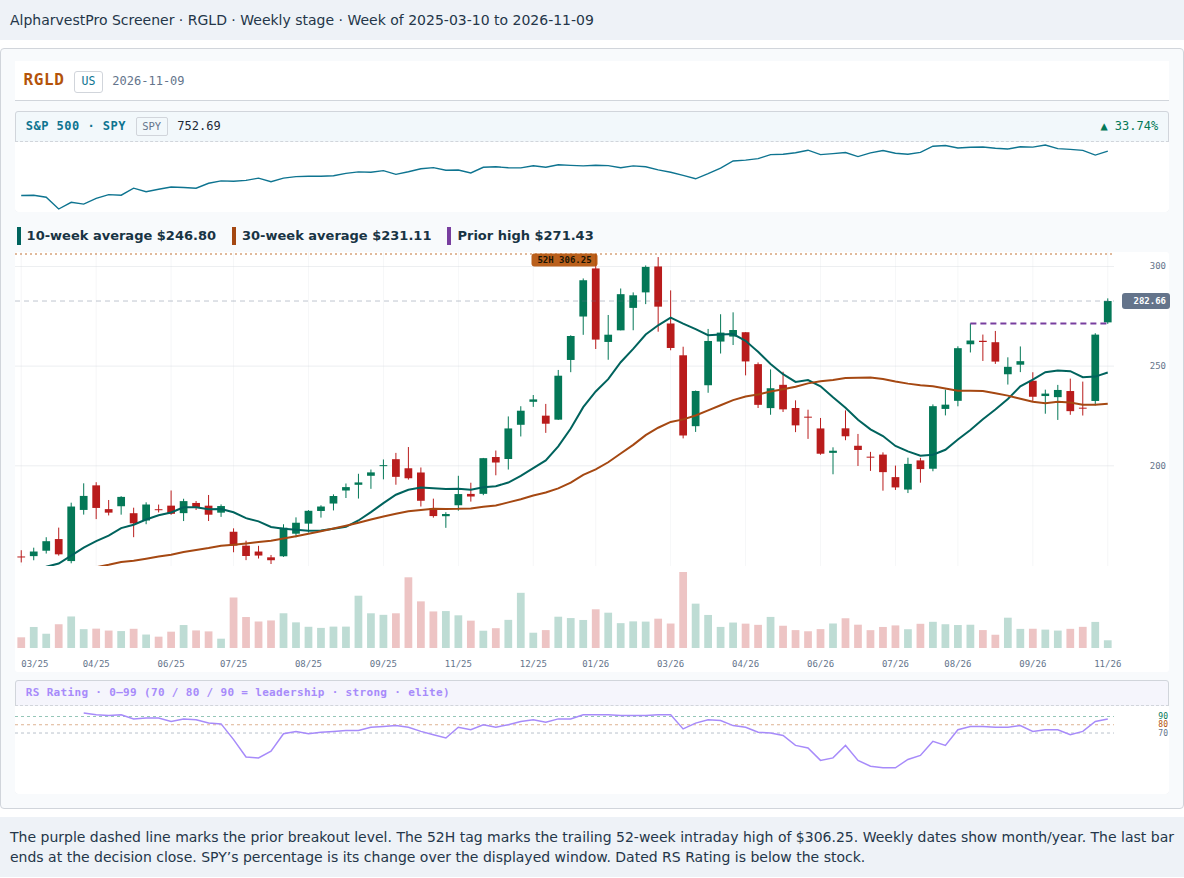
Royal Gold had also reported on November 4. Quarterly revenue reached $464.8 million against $252.1 million a year earlier. Diluted earnings rose from $1.92 to $2.68 a share. The company attributed part of the revenue increase to higher metal prices and part to new revenue from streams and acquired assets. Even with those results, Mining-Gold/Silver/Gems did not appear in the November 9 top 50. That ranking was archived at 6:52 p.m. Eastern, before the next open. Royal Gold’s quarterly release filed with the SEC
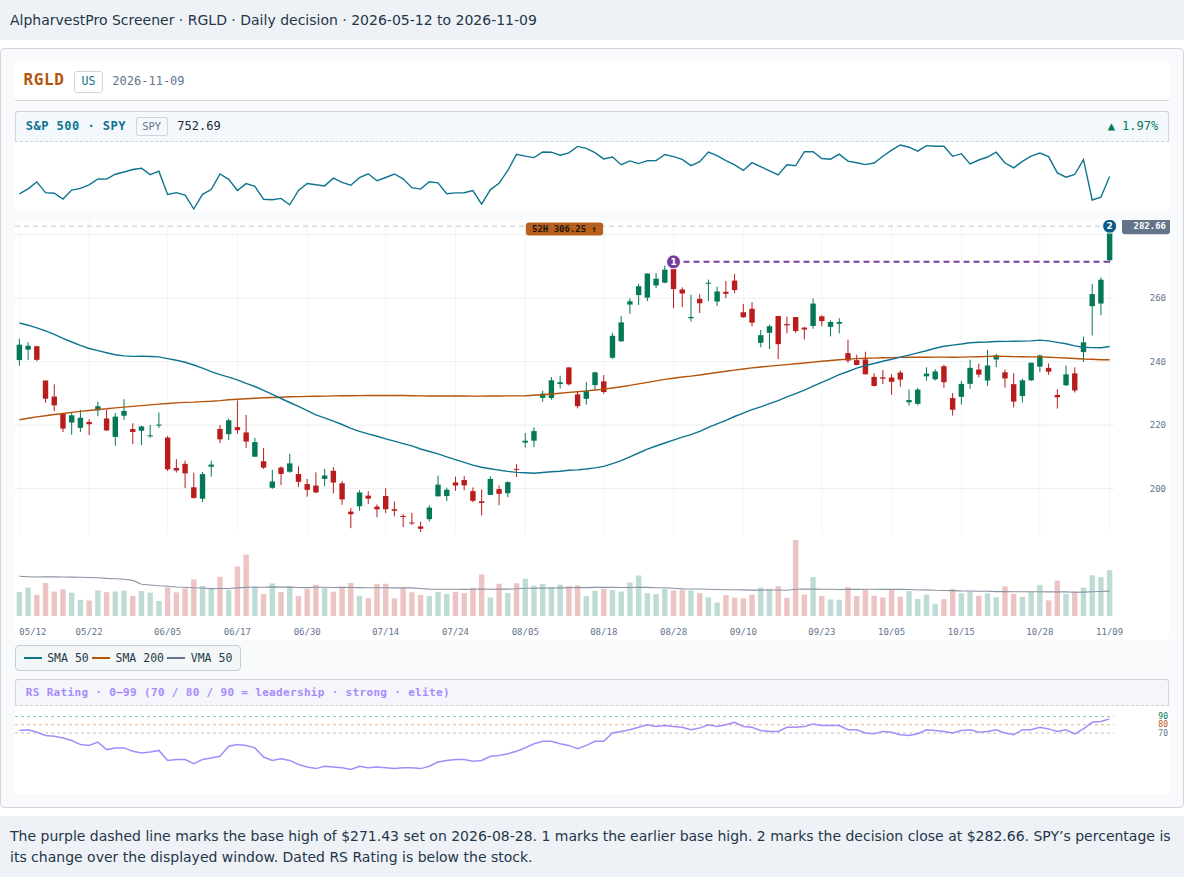
On November 9 it closed at $282.66 on 1.88 times average volume. Market Compass still read Market in Correction. Both stocks had now passed the price and volume test. Both had missed the group test. An investor applying this blog series’ full checklist would have kept both on the watchlist. To see what the market rule itself costs or saves, the three hypothetical plans below hold that group weakness constant.
Choose what earns an order
Use a hypothetical $40,000 account and consider each stock separately. A breakout requires a close above the base high on at least 50% more volume than the prior 50-session average. The earliest eligible fill is the following session’s open. For the comparison, assume each order can be sized and filled at the opening print. In practice a trader submitting a market-on-open order must estimate that price and share count in advance.
| Plan | What earns the order | Maximum initial risk |
|---|---|---|
| A · Buy the breakout | Take the next open even during a correction | $400 |
| B · Try a pilot | Take the same open with a smaller position | $200 |
| C · Wait for the market | Wait for an end-of-day report outside correction with the stock still above its buy point, then take the next open | $400 |
Give each purchase its own 8% stop. Divide the risk budget by the dollars at risk per share and round down to whole shares. If the opening price is more than 5% above the buy point, halve that share count and round down again. A close below the base low cancels a waiting order. Plan B holds its initial size so we can measure what the pilot alone buys. The dollar-risk budgets, half-size extension rule and decision to hold the pilot at its initial size belong to this blog series. Ryan’s example used a percentage of account value to describe his position.
A change in the market headline governs new orders. For an open position, this blog series sells half at a 20% gain, rounding down to whole shares. Only after that partial sale does it move the stop to entry. If the remainder is still open, the first subsequent session that sets a new largest one-day percentage decline since the weekly advance began triggers a sale at that close. An opening gap through a stop gets the opening price. Those rules matter because a planned loss is only an estimate of the exit you can get.
Write down your choice for each stock. If the market improves tomorrow, what price must each one still hold at that close?
Open the November 11 market report and the two outcomes
One market report, two different orders
Market Compass counted November 11 as day five from the November 5 rally low. On November 9 it had identified the S&P 500 as the index attempting a rally. On November 11 the Nasdaq Composite confirmed the follow-through, gaining 1.60% on 28.6% more volume than the previous session. The headline changed to Uptrend Under Pressure, enough for Plan C. The first archived copy is stamped 6:55 p.m. Eastern on November 11. Plan C assumes a reader could use it before the November 12 open.
Corpay closed November 11 at $461.95, above $427.46. Royal Gold closed at $268.84, below $271.43. You could have written both decisions on the same sheet that evening. Corpay qualified for the next open under Plan C. Royal Gold still had to recover its buy point. Dated market readings and both closing prices
| Stock and plan | Entry at the open | Shares | Position value | Stop | Planned loss | Result through November 17 |
|---|---|---|---|---|---|---|
| Corpay A · Nov 6 | $437.78 | 11 | $4,815.58 | $402.76 | $385.22 | +$159.83 open |
| Corpay B · Nov 6 | $437.78 | 5 | $2,188.90 | $402.76 | $175.10 | +$72.65 open |
| Corpay C · Nov 12 | $463.58 | 5 | $2,317.90 | $426.49 | $185.45 | −$56.35 open |
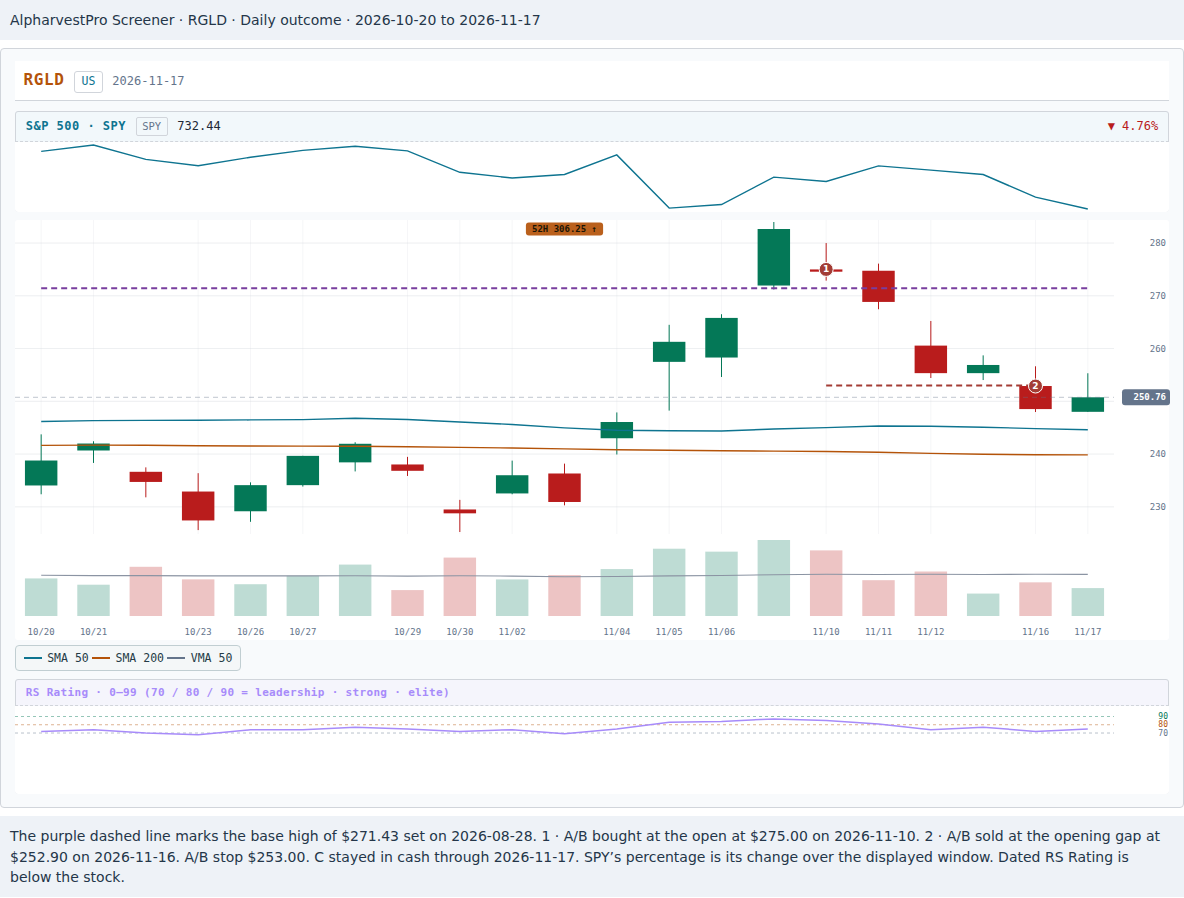
| Royal Gold A · Nov 10 | $275.00 | 18 | $4,950.00 | $253.00 | $396.00 | −$397.80 realized |
| Royal Gold B · Nov 10 | $275.00 | 9 | $2,475.00 | $253.00 | $198.00 | −$198.90 realized |
| Royal Gold C · Cash | — | 0 | $0.00 | — | $0.00 | $0.00 |
Compare five Corpay shares with five Corpay shares. The early pilot and the patient buyer ended up owning exactly the same number. The November 12 open was 8.45% above the buy point, so the extension rule cut Plan C from ten shares to five. Waiting cost $25.80 per share, or $129.00 on five shares. At the November 17 close of $452.31, the early five showed a gain and the late five showed a loss. All three Corpay plans were still open. Without the half-size rule, Plan C’s ten shares would have shown a $112.70 open loss. A trader who passed on any entry more than 5% above the buy point would have stayed in cash at that open.
In Royal Gold, waiting saved the full $397.80 that Plan A lost. November 16 opened at $252.90, ten cents below the $253.00 stop. The pilot accepted the same gap on nine shares and lost $198.90. After November 10, Royal Gold never again closed above its buy point through November 17. Its November 17 dividend announcement came after the two stopped positions were out. Royal Gold’s November 17 dividend announcement
The follow-through itself proved short-lived. The November 16 report dated its failure to November 13, when the Nasdaq closed below its 200-day average. The archive has no November 13 headline. A trader using these reports could act on that later explanation at the November 17 open. It could never have been a reason to cancel Corpay’s November 12 purchase.
What to put on tomorrow’s watchlist
We chose these two breakouts after seeing what happened. They shared a market report, had recent earnings news and gave opposite answers to the cost of waiting. The comparison uses as-traded prices through November 17, before fees, spreads, taxes or dividends. Two selected examples cannot tell you how frequently early purchases work. Corpay’s group was still absent from the November 11 top 50. That alone would have kept an investor using the full checklist out of the later purchase.
In the Screener, save the date and name of the list that first brought a stock to your attention. Mark the base high on its chart. At the close, put the latest Market Compass headline beside the stock’s closing price and check the group ranking. Before an order goes in, look up the next earnings announcement with the company and calculate the whole-share size at the intended entry. Chart data, group rankings and fill assumptions
Leave two blanks in the journal tonight. “The market reading I need is [headline]. At that close, the stock must still be above [buy point].” On November 11, the first blank was identical for Corpay and Royal Gold. The second blank decided which order went in.
