
After the close on Monday, October 12, a $40,000 account holds five stocks. Each was bought at a buy point this series’ plan approved, at the next morning’s open, with its own 8% stop and a risk budget of $400, 1% of the account. Four of the five are above their purchase prices, and their relative-strength ranks run from 91 to 99. The app files them under four different industry groups: a royalty trust, two oilfield-equipment makers, a refiner and a tanker owner.
That evening a setup list offers a sixth: Tsakos Energy Navigation (TEN), a second tanker owner, breaking out of its base in a group ranked 23rd of 187. The buy point meets every rule of the series’ plan, its group is in the top 50, and Market Compass allows a purchase. The question in this article is not whether TEN is a good buy point. It is how many bets the account already holds.
What the masters say about concentration
The traders in Momentum Masters do not spread their money thin. Mark Minervini: “If you have a significant edge, diversification does not protect you; it dilutes you.” David Ryan: “I initiate each position with a 10% weighting: 10 positions in my portfolio. I never want to exceed that number of stocks because it gets too hard to closely follow more than that.” Dan Zanger holds “8 to 10 stocks” in typical markets. William O’Neil is stricter: “Most people with $20,000 to $200,000 to invest should consider limiting themselves to four or five carefully chosen stocks they know and understand.”
They concentrate on purpose, and they name the price. Zanger keeps his stops tight, “unless it has a massive gap down on bad news, which has happened numerous times in my career, and I could lose 10–15% in each position or more overnight.” Minervini, in Think & Trade Like a Champion, warns that a stock can “gap down huge, say 50 percent in one day,” and then “your 5 or 10 percent stop is worthless.” A few positions, watched closely, each with a stop that may not hold: that is the bargain they accept.
O’Neil also says what to do when the number is reached: “Once you own five stocks and a tempting situation comes along that you want to buy, you should muster the discipline to sell your least attractive investment.”
Why one group, or one sector, can be one bet
O’Neil puts numbers on what a stock shares with its neighbors: “37% of a stock’s price movement is directly tied to the performance of the industry group the stock is in. Another 12% is due to strength in its overall sector. Therefore, roughly half of a stock’s move is driven by the strength of its respective group.” His figures are averages. They do not say how closely any two particular stocks will move together. They do say where to look: stocks that share a group or a sector share part of what moves them.
He also describes how a sector turns. In 1980 and 1981, after a long advance in oil and oil service stocks, his firm “had turned negative on almost the entire oil sector.” It expected that “the weakness would wash over into the entire oil service industry,” and it put more of those stocks on its sell list “even though the stocks were making new price highs and showed escalating quarterly earnings.”
Chris Kacher lived the same problem in 1999: “most of the stocks that triggered buy alerts were technology stocks.” When the Internet group showed a climax, his sell list a few minutes after the open was “14 out of the 16 stocks that I held,” and the CBOE Internet Index finished the day down 9.6%. His lesson: “Like dynamite, they must be handled with care, especially if you decide to concentrate your portfolio in one sector.”
The word that matters is decide. A screen that keeps finding buy points in one sector will build a one-sector portfolio for you, one sound purchase at a time, unless you count.
The rules in this article
The purchases follow this series’ end-of-day plan: a close above the base high on volume at least 50% above the average of the previous 50 sessions, O’Neil’s breakout volume, and a purchase at the next open. Nothing is bought while AlpharvestPro’s Market Compass reads Market in Correction; a breakout during one waits for the first close outside it that is still above the base high.
The account is $40,000. Each purchase has a risk budget of $400, 1% of the account, with the stop 8% below the purchase, so each position costs about $5,000, an eighth of the account. Eight positions use all of it. Whole shares make most planned losses a little under $400.
The exits are the series’ selling rules from our article on selling winners:
- Stop: 8% below the purchase. O’Neil: “cut your losses at a maximum of 8% below your purchase price.”
- Into strength: sell half at 20% above the purchase. Minervini: “My ‘sell half rule’ is a win-win solution.”
- Breakeven: after the half sale, the stop on the rest moves to the purchase price.
- Into weakness: sell the rest at the close of the stock’s largest one-day decline since its Stage 2 advance began. Minervini: “If your stock experiences its largest daily and/or weekly price decline since the beginning of a Stage 2 advance, this is almost always an outright sell signal.”
Before each order, this article adds a count of its own:
- The same Industry Group: how many positions already held carry the new stock’s group label in the app.
- The same Sector: how many carry the same entry in the app’s broader Sector column.
- Open planned risk: for each position, the shares held times the distance from cost to the current stop, added up for the account and for the sector. A position whose stop has moved to breakeven carries none.
These counts measure exposure, not correlation. The limit comes from O’Neil: this account is inside his $20,000-to-$200,000 range, so four or five stocks.
How we chose these two cases
We read every US stock that appeared from July 7 to October 23 on one of AlpharvestPro’s setup lists: VCP Setup (Minervini), Pocket Pivot (Morales & Kacher), Buyable Gap-Up (Morales & Kacher), Three Weeks Tight (O’Neil), High Tight Flag (Power Play) or Qullamaggie Breakout Setup. In each stock priced at $12 or more, with about a year of trading history and still trading on November 11, we took the first purchase this series’ plan would have made, followed it with the series’ exits to November 11, and sorted the purchases by the app’s Industry Group and Sector. Two clusters show the question best:
- Energy is the main case: 13 purchases from August 5 to October 13, all under Industry Group labels that begin with Oil&Gas-, six different labels in all.
- Banks are the contrast: seven purchases on August 5 and 6, under three labels.
Both were chosen after the outcomes were known. The account in each case takes only that cluster’s purchases; it took every energy buy point, held seven at times and never applied O’Neil’s limit. It shows what a count reveals; it does not measure how often concentrated portfolios win or lose. A second purchase after a first exit occurred four times among all the stocks the plan bought; none was in energy, and one was a bank, noted below.
Step 1: the energy record to October 12
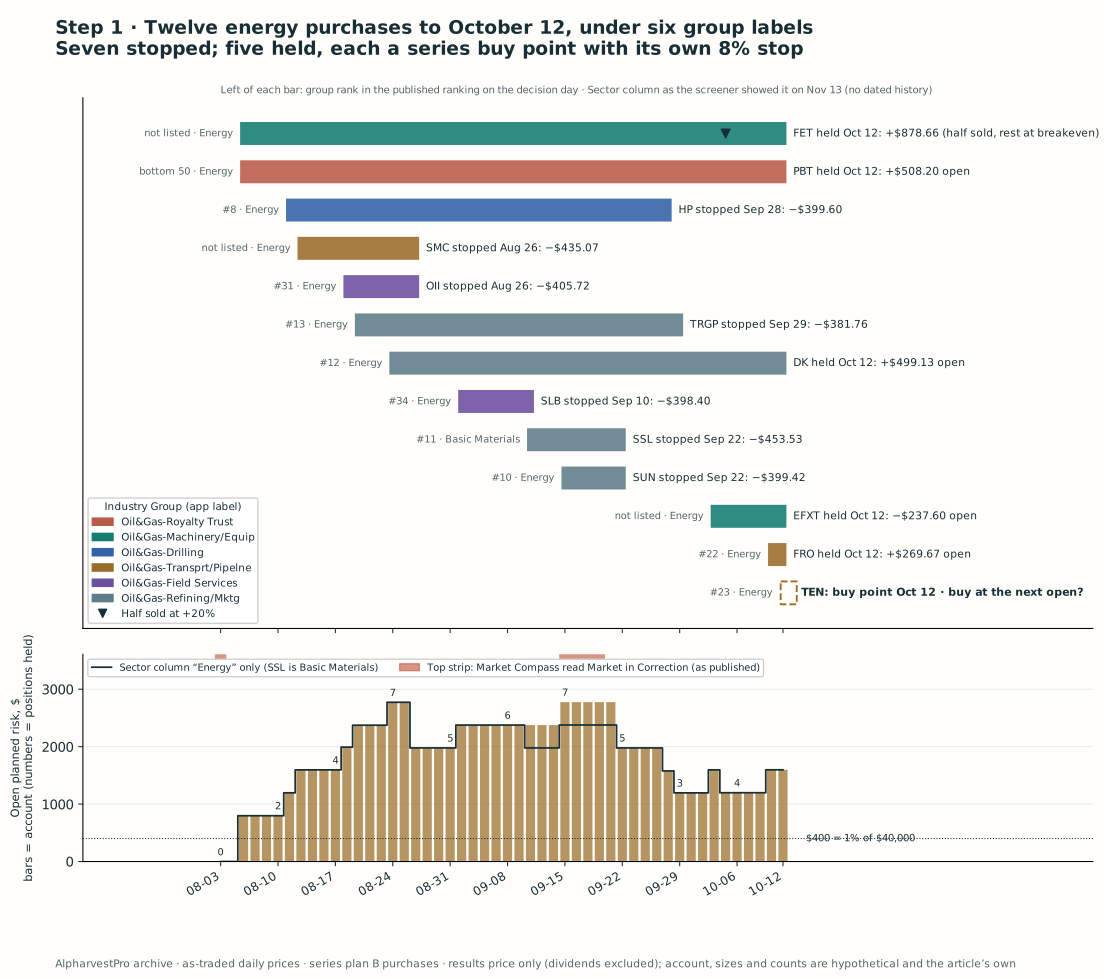
The energy record as known after the October 12 close. No session after October 12 is shown. The Sector column is the screener’s November 13 reading; the app keeps no dated history of it.
The first energy buy points arrived as soon as Market Compass left its summer correction. FET (Forum Energy Technologies) had broken out on August 3, during the correction, and waited one session; it and PBT (Permian Basin Royalty Trust) were bought at the August 5 open. HP (Helmerich & Payne) followed on August 11, SMC (Summit Midstream) on August 12, OII (Oceaneering) on August 18, TRGP (Targa Resources) on August 19 and DK (Delek US) on August 24. By that morning the account held seven energy positions, $34,663.39 at cost.
Each purchase met the series’ rules on its own. Nine of the 13 came from groups in the top 50 of the app’s published ranking on the decision day, among them HP’s drilling group at #8 and Oil&Gas-Refining/Mktg at #10 to #13. The labels differed: Oil&Gas-Royalty Trust, Oil&Gas-Machinery/Equip, Oil&Gas-Drilling, Oil&Gas-Transprt/Pipelne, Oil&Gas-Field Services and Oil&Gas-Refining/Mktg. A limit of two stocks per group would have stopped only SSL and SUN, the third and fourth positions in Oil&Gas-Refining/Mktg, and allowed the other 11. The app’s Sector column put 12 of the 13 under one word: Energy.
Then the stops came. SMC and OII were stopped on the same day, August 26, both after opening below their stops. SLB followed on September 10. SSL (Sasol) and SUN (Sunoco), bought on September 10 and 15, were stopped together on September 22. HP was stopped on September 28 and TRGP on September 29. That was seven stops in five weeks, $2,873.50 in all. In between, FET reached the +20% line on October 5 and sold half. EFXT (Enerflex) was bought on October 2, after it announced a contract on October 1 for about 450 megawatts of gas-fired power generation for a data-center developer. FRO (Frontline) was bought on October 9.
Step 2: the sixth buy point
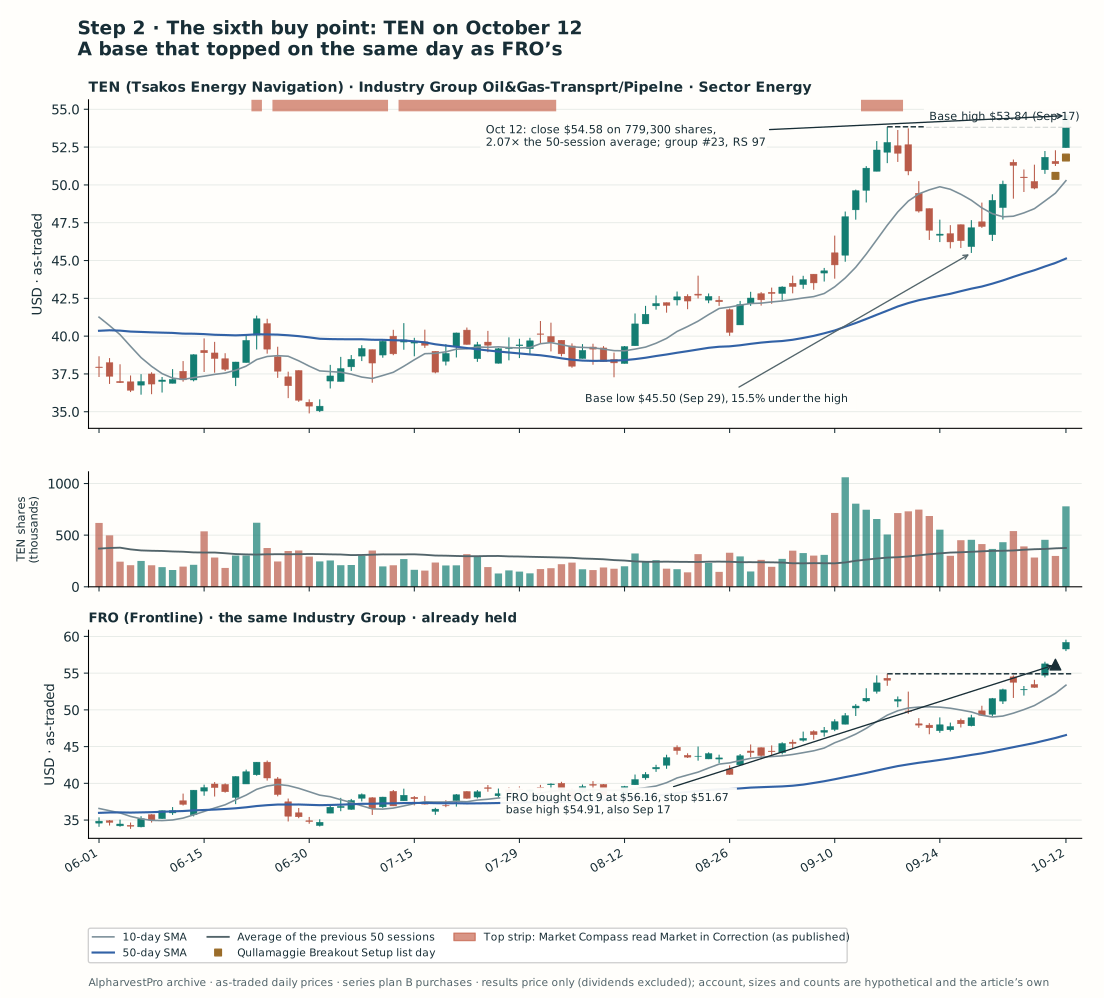
TEN and FRO, daily decision snapshot. No bar after October 12 is shown.
The base. TEN reached $53.84 on September 17, the same session in which FRO set its own base high of $54.91. It pulled back 15.5% to $45.50 on September 29, then climbed back and made the Qullamaggie Breakout Setup list on October 9 and October 12.
The trigger. On October 12 TEN closed at $54.58, up 6.2%, on 779,300 shares, 2.07 times its average. Its group, Oil&Gas-Transprt/Pipelne, ranked #23 of 187 in the ranking published that evening, its relative-strength rank was 97, and Market Compass’s reading for the day, published before the next open, was Uptrend Under Pressure.
The order. The plan buys at the next open, so the exact price is not known that evening. Sized from the October 12 close, the 8% stop would be $50.21 and the order 91 shares: $4,966.78 at cost and $397.67 of planned risk.
FRO had done the same thing two sessions earlier: a close above its September 17 high on October 8, on the Pocket Pivot (Morales & Kacher) and Buyable Gap-Up (Morales & Kacher) lists, and a purchase at $56.16 on October 9.
The count, before the order
Here is the account after the October 12 close, with TEN sized from that close.
| October 12 | Industry Group (rank that day) | Sector | RS | Shares | Cost | Close vs cost | Open planned risk |
|---|---|---|---|---|---|---|---|
| PBT | Oil&Gas-Royalty Trust (#18) | Energy | 96 | 154 | $4,981.90 | +10.2% | $398.86 |
| FET | Oil&Gas-Machinery/Equip (not listed) | Energy | 99 | 34 of 67 | $2,526.20 | +15.4% | $0.00 |
| DK | Oil&Gas-Refining/Mktg (#4) | Energy | 98 | 71 | $4,991.30 | +10.0% | $399.02 |
| EFXT | Oil&Gas-Machinery/Equip (not listed) | Energy | 91 | 198 | $5,005.44 | −4.7% | $399.96 |
| FRO | Oil&Gas-Transprt/Pipelne (#23) | Energy | 99 | 89 | $4,998.24 | +5.4% | $399.61 |
| TEN, if bought | Oil&Gas-Transprt/Pipelne (#23) | Energy | 97 | 91 | $4,966.78 | $397.67 |
Not listed means outside the published top 50 and bottom 50. FET’s cost is for the 34 shares left after the half sale; their stop is at breakeven. The Sector column is the screener’s November 13 reading.
The count gives three answers:
- By Industry Group, TEN would be the second position in its group, after FRO.
- By Sector, it would be the sixth in a row in one sector. Every position in the account is Energy.
- By open planned risk, the account carries $1,597.45, 4.0% of the account, all of it in one sector. With TEN it would carry $1,995.12, 5.0%, and $27,469.86 at cost, 68.7% of the account.
Zanger’s scale shows what the stops do not cover. He speaks of a gap in one position; suppose, as this article’s own assumption, that one piece of bad news hit all six at once overnight. The five holdings were worth $23,930.76 at the October 12 close, $28,897.54 with TEN at that close. A loss of 10% to 15% on that would be $2,889.75 to $4,334.63, 7.2% to 10.8% of the account, before any stop could act.
And O’Neil’s limit has already been reached: five stocks. His instruction is to sell the least attractive before buying another, but he does not say how to choose it. By this article’s reading, the only position below its cost and the closest to its stop, 3.5% above it, it is EFXT. Swapping it for TEN would keep five positions, all of them still Energy.
Before opening the outcome, decide: would you buy TEN at the October 13 open? If you hold the five, what is the one bet you hold, and what would you do about it?
Reveal what the energy positions did next
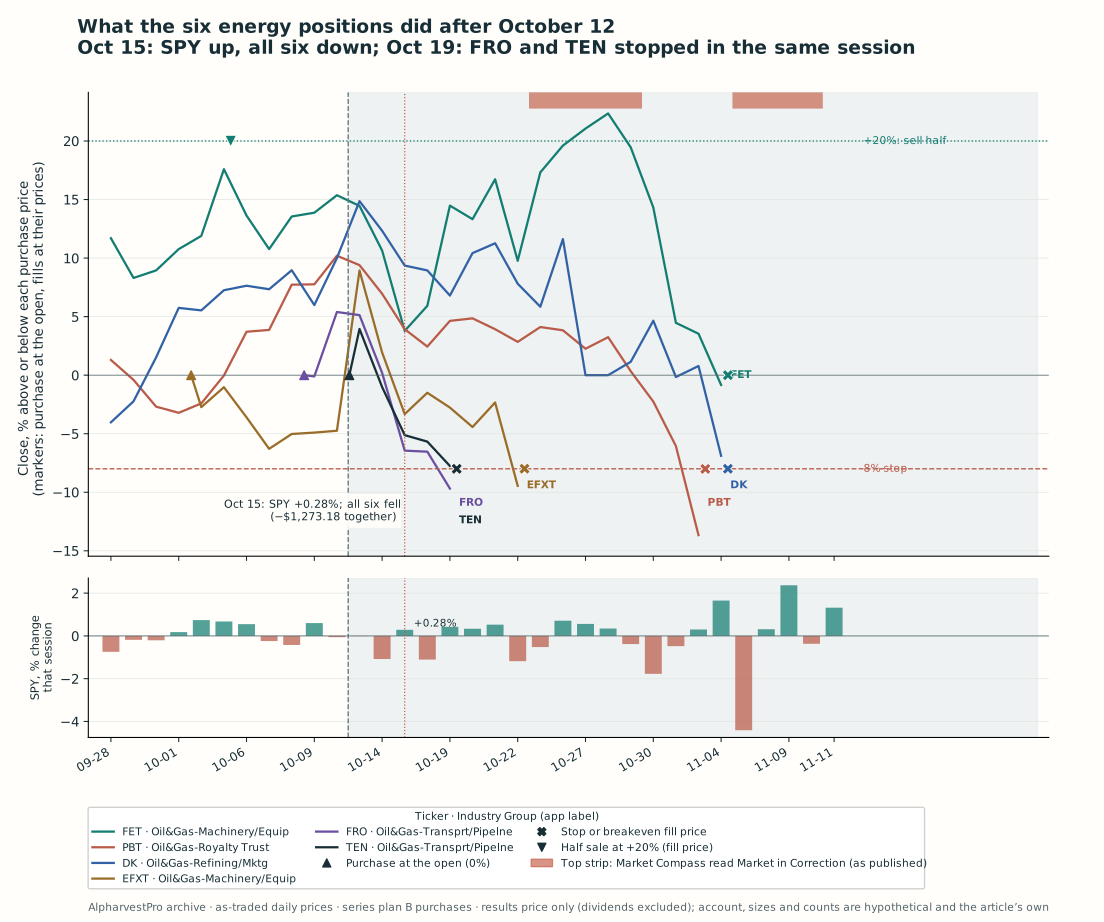
The shaded area was unknown at the decision.
TEN filled at the October 13 open, $54.26, 0.6% below the October 12 close, so the order was 92 shares, with the stop at $49.92 and $399.28 of planned risk. The same day Enerflex announced a second data-center contract, for over one gigawatt of gas-fired generation, and EFXT closed up 14.4%.
Two sessions later, on October 15, SPY rose 0.28% and all six energy positions fell: FRO 6.6%, FET 6.2%, EFXT 5.2%, TEN 4.2%, PBT 2.8% and DK 2.6%. Together they lost $1,273.18, 3.2% of the account, in one session, while Market Compass read Uptrend Under Pressure. None of the six companies filed a report of its own with the SEC on October 14 or 15. Not every move was shared: EFXT’s fall came two sessions after its own news, and PBT had a story of its own, described in the limits below.
On October 19, with SPY up 0.42%, FRO and TEN were stopped in the same session, at $51.67 and $49.92. EFXT was stopped on October 22 at $23.26. Market Compass read Market in Correction from October 23 to 29. PBT was stopped on November 3 at $29.76. On November 4 DK was stopped at $64.68, and FET’s last 34 shares were sold at breakeven, $74.30.
Measured from their purchase prices, PBT, DK, EFXT, FRO and TEN lost $1,996.73, exactly their planned risk at the actual fills, because all five filled at their stops. Measured from the October 12 close, the account lost more: the five stocks’ open gain of $1,427.68 went too, and the six positions together lost $3,424.41, 8.6% of the account.
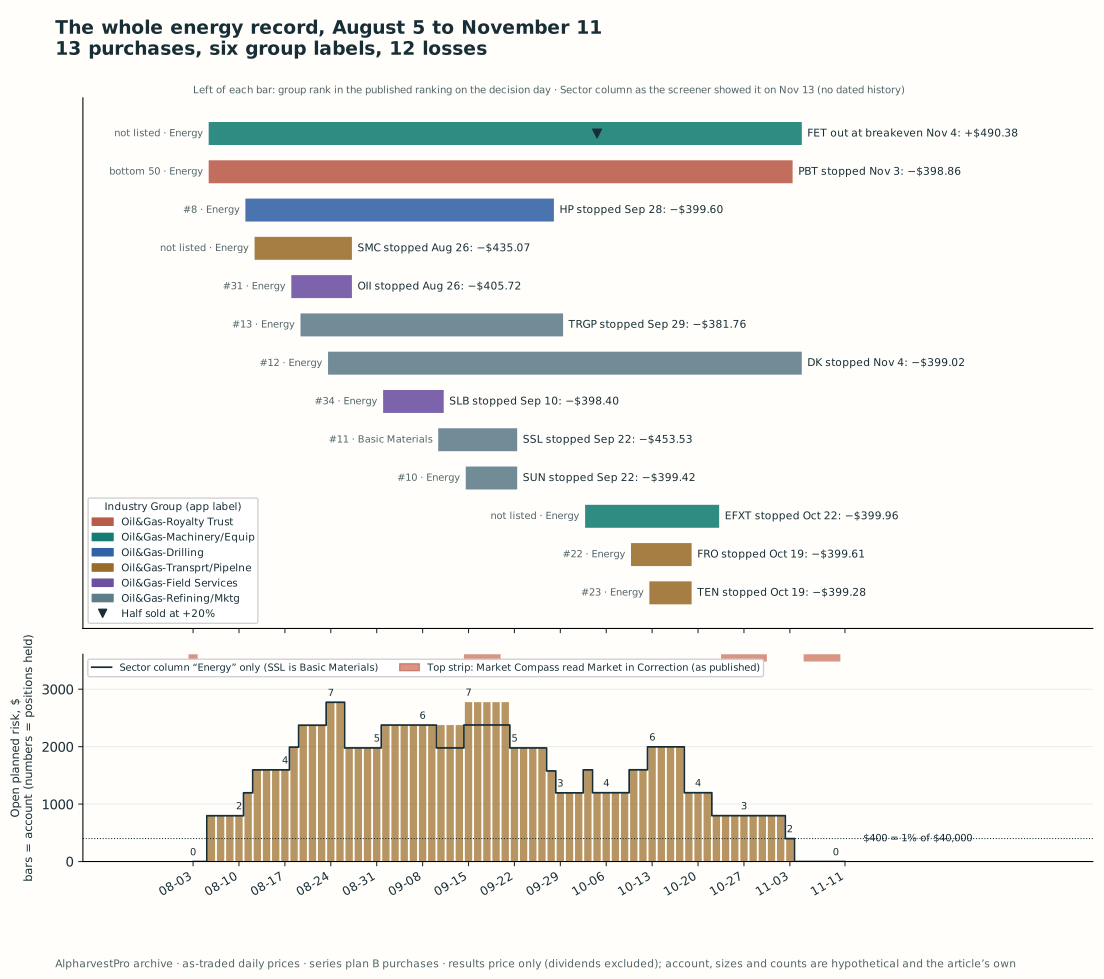
The whole energy record.
| Energy purchases, August 5 to October 13 | Result to November 11, price only, before costs |
|---|---|
| The seven stopped before October 12 | −$2,873.50 |
| FET: half sold at +20%, the rest at breakeven | +$490.38 |
| PBT, DK, EFXT, FRO and TEN, all stopped | −$1,996.73 |
| All 13 purchases (12 losses) | −$4,379.85 |
The contrast: seven banks in two mornings
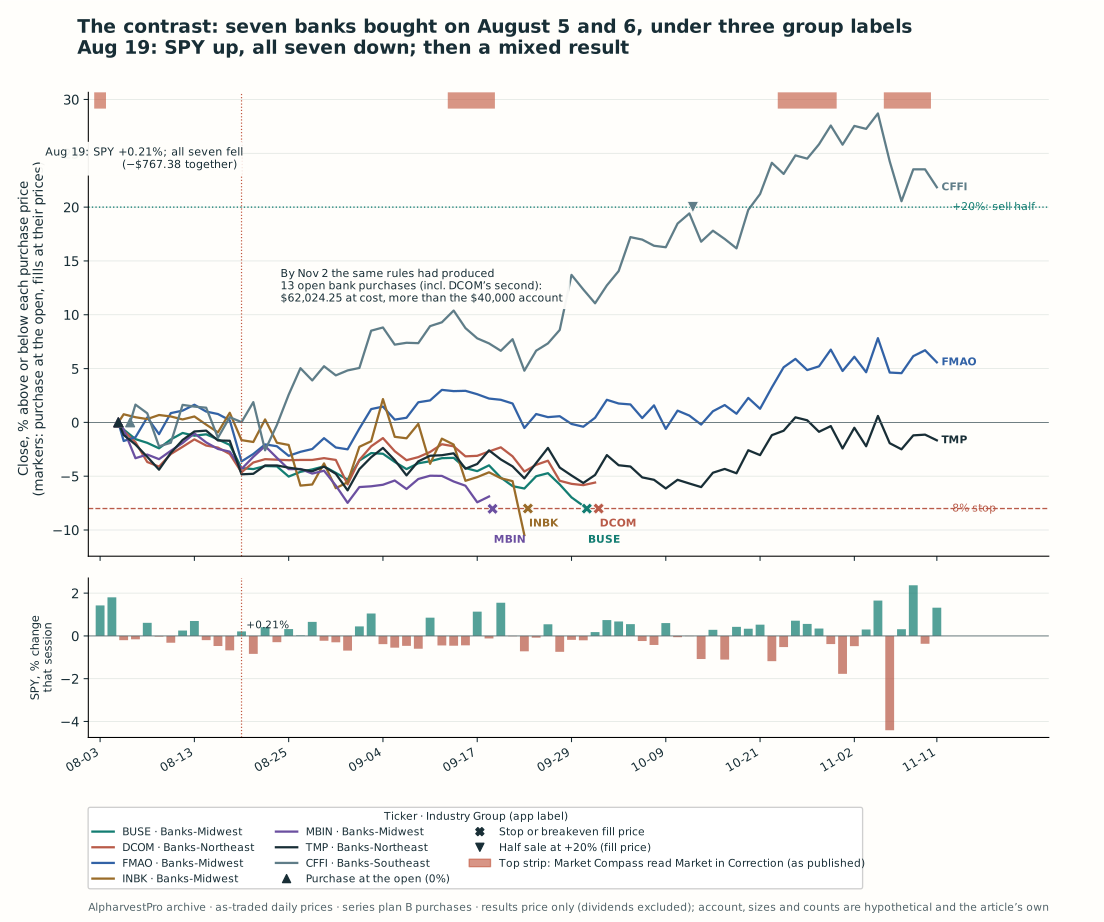
Seven bank purchases and SPY.
Why they came together. Market Compass read Market in Correction from June 25 to August 3. Five banks broke out during it: TMP (Tompkins Financial) on July 24, FMAO (Farmers & Merchants Bancorp) on July 28, MBIN (Merchants Bancorp) and BUSE (First Busey) on July 29 and INBK (First Internet Bancorp) on July 31. Under the plan they waited. On August 4 the Compass left its correction, all five were still above their base highs, and DCOM (Dime Commercial Bancshares) broke out that day. The plan bought all six at the August 5 open, and CFFI (C&F Financial) on August 6. When a market check reopens, the buy points that waited for it arrive on the same morning.
The count. The seven came under three labels: Banks-Midwest, ranked #9 on August 4; Banks-Northeast, #47; and Banks-Southeast, #21 on August 5. The Sector column read Financial Services for all seven. After two mornings the account had $34,865.97 at cost, 87.2% of it, and $2,789.89 of open planned risk, 7.0%, all in one sector.
The common day. On August 19, with SPY up 0.21% and Market Compass reading Confirmed Uptrend, all seven fell: FMAO 3.8%, TMP 3.2%, INBK 2.5%, BUSE 2.2%, DCOM 1.7%, MBIN 1.7% and CFFI 0.5%, together $767.38.
The result. MBIN was stopped on September 18, INBK on September 23, BUSE on September 30 and DCOM on October 1. CFFI reached the +20% line on October 13 and sold half at $104.64. On November 11 the seven stood at −$361.54, price only: −$1,108.11 realized and +$746.57 still open in CFFI, FMAO and TMP. Of the plan’s 30 other purchases on the same two mornings, spread across other groups, 22 showed a loss on November 11, 21 of them closed and one still open; together the 30 stood at −$1,748.58.
The banks fell together on August 19 as the energy stocks did on October 15, and the outcome was mixed. Concentration did not decide the direction. It decided how much of the account rode on one answer.
The bank buy points kept coming. By November 2, the same rules had produced 13 open bank purchases, counting DCOM’s second purchase on October 23: $62,024.25 at cost. A $40,000 account could not have bought them all. The count is how you notice before the money runs out.
What the count changed
Every purchase in this article was budgeted at 1% of the account. The group of stocks never was. From August 24 to September 21 the energy positions carried between $1,977.22 and $2,775.61 of planned risk, 4.9% to 6.9% of the account. The banks carried 7.0% from their second morning. Every one of the six Oil&Gas group labels in the account ended in a stop.
The stops worked one at a time. Nine of the 12 energy stops filled at the stop price. Three filled lower, after the stock opened below the stop: SMC by $36.14, OII by $9.20 and SSL by $54.56 more than planned. None came near Zanger’s 10% to 15% or Minervini’s 50%. What added up was the number of stops: 12 among stocks that all carried Oil&Gas labels.
The weeks were hard for breakouts everywhere. Of the plan’s 121 other first purchases bought from August 5 to October 13, 90 showed a loss on November 11, 86 of them closed and four still open; the 121 averaged −$101.09 each. The 13 energy purchases averaged −$336.91. Concentration did not create the hard market; it made the account’s result depend on one group of stocks.
A count would have shown the build-up early. It said four energy positions on August 12, seven on August 24, and five of five on October 12. None of these purchases broke a rule of the series. None of the counts was hidden. They had to be added up.
What these cases cannot show
- Selection. Both clusters came from a screen of the dated record, run after the outcomes were known, and were chosen to show the question. The screen took the first purchase in each stock and kept only stocks with about a year of history that still traded on November 11. A real account following the plan would have met far more buy points than it could fund, in many sectors. The single-sector accounts here are illustrations.
- Causes. The prices show that these stocks fell together on certain days. They do not show why, and some had stories of their own. This article has no data on oil prices, shipping rates or interest rates and draws no conclusion about any of them. The counts measure exposure, not correlation.
- Labels. Industry Groups and Sectors are the app’s own assignments. The Sector column is as the screener showed it on November 13, 2026, and it files SSL under Basic Materials; the app keeps no dated history of it. The published group ranking lists only the top 50 and bottom 50 groups. Measured at the close of each purchase day, after the purchase, ten of the 13 energy purchases had groups in the top 50.
- Events. We listed each company’s own SEC filings in the three sessions before each stop or breakeven exit. Two energy exits had one: SSL, after a report on Form 6-K on September 18 whose text EDGAR presents only as page images, which we did not read, and FET, whose quarterly report on Form 10-Q came on October 30, three sessions before its breakeven exit, after its results on October 29. Among the banks, INBK filed a notice of an exempt securities offering (Form D) on September 18 and declared a dividend on September 21, before its stop on September 23. Filings by others are not counted: on September 18 the New York Stock Exchange filed to remove from listing a Sasol guarantee of notes due 2026. EFXT announced its data-center contracts on October 1 and October 13 and filed a further report on October 13 that we could not read. PBT had a story of its own: a presentation dated July 28 and filed with the SEC on Form 425 describes a proposed $2.2 billion combination of the trust with US Land Guild, negotiated by SoftVest, a holder of about 13.3% of the trust’s units; it can occur only if unitholders approve it. This article draws no conclusion about any company’s business.
- Market Compass. The archive has no file for August 18, TRGP’s decision day. Its readings on August 17 and 19 were both Confirmed Uptrend, dated from the same August 3 confirmation, which indicates no correction in between; TRGP’s purchase rests on that inference.
- Results, fills and costs. Results are price changes only; dividends and trust distributions are excluded, though some of these stocks paid them while held (CFFI, for example, declared a dividend on August 19, payable October 1). Purchases use the next open. A stop fills at its level, or at the open if the stock opens below it. Commissions, spreads, slippage and taxes are excluded.
- Price basis. Prices and volumes are as traded. The app’s chart bars are adjusted for dividends and, for these dividend-paying stocks, differ from as-traded prices by up to $3.47 a share.
- Whose rules. The position limits are O’Neil’s, Minervini’s, Ryan’s and Zanger’s; the group and sector shares of a stock’s move and the 1980–1981 oil example are O’Neil’s; the sector lesson is Kacher’s; the exits are O’Neil’s and Minervini’s; Market Compass adapts its counts from O’Neil. The single-sector accounts, the Sector count, the open-planned-risk sums, the choice of EFXT as least attractive, the simultaneous overnight loss and using the position-sizing calculator for one sector are this article’s.
Running it in AlpharvestPro
- After the close, open a setup list, such as VCP Setup (Minervini), Pocket Pivot (Morales & Kacher) or Qullamaggie Breakout Setup (Pro and Ultra), and note the data date.
- Before any order, read two labels. The screener table’s Sector column and the stock’s diagnostic view, which shows Sector, Industry Group and Industry-Group Peers (by RS). Check the group’s standing in the Industry Subgroups ranking (full lists for Pro and Ultra).
- Count what you already hold. Write down how many positions share the new stock’s Industry Group, how many share its Sector, and the planned risk on each.
- Respect a number. If you already own five, O’Neil’s number for a $20,000-to-$200,000 account, decide what you would sell before you buy.
- Size it twice. In the Kelly Position Sizing Calculator (Pro and Ultra), enter the account’s open planned risk as Current Aggregate Open Risk and your limit as Maximum Aggregate Open Risk. The calculator shows the Remaining Aggregate Risk Capacity and lowers the order when that limit binds. Run it again with only the sector’s open risk and a sector limit of your own. On September 14, when SUN was offered, the account’s open planned risk was $2,376.19, 5.94% of the account; under a 6% account limit about $24 of risk would have remained for SUN. By the Sector column alone, which files SSL under Basic Materials, Energy carried $1,977.22, and a 6% Energy limit would have left $422.78, room for SUN. The two counts answer different questions; write down both. The calculator adds its own warning: “Concurrent positions may be correlated. Aggregate stop risk does not capture all portfolio or tail risk.”
- Then the market. Open Market Compass and buy nothing while it reads Market in Correction. When it leaves one, expect the waiting buy points to arrive together, and count them before the open.
- Keep watching the holdings. Put them in a watchlist; Watchlist Alerts (Pro and Ultra) show which lists your watchlist stocks met on the latest session. The app has no correlation tool; the count above is done by hand.
Conclusion
The masters concentrate, and they say so: four or five stocks for O’Neil, ten for Ryan, up to a quarter of the portfolio in one position for Minervini. What they do not do is concentrate by accident. O’Neil gives a stock’s group and sector about half of its move, on average. Kacher’s 1999 buy alerts were mostly technology stocks, and when the group turned he sold 14 of his 16 positions minutes after the open.
The energy account in this article never broke a rule of the series. Each of its 13 purchases was a buy point with its own 8% stop and a 1% risk budget, and nine came from groups in the top 50. The purchases carried six different group labels, all beginning with Oil&Gas; the Sector column said Energy for 12 of them. Twelve of the 13 were stopped, and on October 15 six of them fell on a day the market rose. The banks fell together just as plainly on August 19 and finished close to even. Concentration magnified whatever the stocks did together.
Before your next order, write one more line beside the chart: how many of your positions share this stock’s group or sector, and what they would lose together at their stops. If the answer is most of your account, you are not adding a sixth stock. You may be adding to one bet.
Reading and chart notes
Mark Minervini, Momentum Masters, Section 3, questions 1 and 2 (Minervini, Ryan and Zanger on how many stocks to own; Zanger on overnight gaps) and Section 9, question 8 (Minervini’s sell-half rule); Think & Trade Like a Champion, Section 8 (concentration, “di-worsification” and the 50% gap) and Section 9 (selling into weakness). William J. O’Neil, How to Make Money in Stocks, Chapter 11 (the 8% loss limit), Chapter 12 (four or five stocks for $20,000 to $200,000, and selling the least attractive before buying a sixth) and Chapter 15 (the group’s 37% and the sector’s 12% of a stock’s move; oil and oil service stocks in 1980–1981). Gil Morales and Chris Kacher, Trade Like an O’Neil Disciple, Chapter 2 (Kacher in 1999). Company facts come from EDGAR filing lists for each company read November 14, 2026; Enerflex’s reports on Form 6-K of October 1 and October 13, 2026; Permian Basin Royalty Trust’s Form 425 presentation dated July 28, 2026; First Internet Bancorp’s Form 8-K of September 21, 2026; C&F Financial’s Form 8-K of August 19, 2026; and Sasol’s Form 25-NSE of September 18, 2026. The calculator’s labels and warning are quoted from the app.
Prices and volumes are AlpharvestPro’s as-traded daily archive through November 11, 2026, retrieved November 14. List membership comes from the app’s stored daily list history, which begins July 7, 2026. VCP Setup has been on the web screener since May 2026; Pocket Pivot and Buyable Gap-Up became lists of their own on July 16, 2026; Qullamaggie Breakout Setup was added on July 11, 2026. Group ranks come from AlpharvestPro’s published US industry-group ranking as it stood each day, which lists the top 50 and bottom 50 groups; the stocks’ groups and sectors are the app’s own assignments. Market readings are Market Compass’s headline as published after each close, from its dated archive, which begins May 1, 2026. All cases were selected retrospectively. The plans and the account are hypothetical, use whole shares and exclude dividends and costs; actual stop execution is not guaranteed. A historical list match does not establish when an alert was delivered.

