
A strong rebound can make yesterday’s caution feel embarrassing.
The screen turns green, the commentary gets louder, and suddenly patience feels like falling behind. I find that this is exactly when a daily chart can become too persuasive. One impressive candle fills the screen. The months of price action behind it disappear from the conversation.
Reading Stan Weinstein made me ask a better question: has the market’s stage improved enough to change how I trade?
In his discussion of the market averages, Weinstein writes that when a potential Stage 3 top develops, “you must proceed with caution.” His starting point is a weekly chart and a 30-week moving average. The price structure and the direction of that line matter together.
Let’s put those clues on SPY’s chart and work through a rebound without borrowing certainty from what happened afterward.
First, put the right average on the right chart
For the weekly view, I use a 30-week simple moving average: the average of the last 30 completed weekly closing prices. A holiday-shortened week contributes its final trading close.
On a daily chart, a 150-day SMA covers roughly the same amount of time: 30 weeks multiplied by about five sessions. But it averages 150 daily closes, while the weekly line averages just 30 weekly closes. Holidays also change the session count. The two lines are useful companions, not identical calculations.
That difference is visible in this example. On February 28, 2025, SPY’s 30-week SMA was $583.57, while its 150-day SMA was $580.20. I use the weekly line to discuss Weinstein’s stages and the daily line to inspect the rebound more closely.
The four stages, translated into a market-reading habit
The framework becomes more useful when each label describes something you can actually point to.
| Stage | What I look for on SPY’s weekly chart | What it means for my review |
|---|---|---|
| 1 · Basing | After a decline, price starts moving sideways and the falling 30-week SMA begins to level out. | Prepare a watchlist; a single bounce does not establish a new uptrend. |
| 2 · Advancing | Price clears a base or consolidation, holds above a rising 30-week SMA, and develops higher swing highs and lows. | The market backdrop supports researching long setups; each stock still needs its own entry and risk plan. |
| 3 · Topping risk | After an advance, progress stalls, swings become choppy, and the 30-week SMA loses its upward slope. Price may cross it repeatedly. | Examine failed rallies and support more closely; reconsider exposure as the evidence weakens. |
| 4 · Declining | Support breaks, price stays below the long-term average, and the average turns down. | Adopt a defensive review; a rebound inside a declining trend needs more evidence before being treated as a recovery. |
These are my practical reading notes, not an automated classification rule. A sideways patch above a strongly rising average can still be a consolidation within Stage 2. Even a potential Stage 3 formation can resolve upward. Calling every pause a top would miss that part of Weinstein’s lesson.
February 28: a real rebound, an unresolved market
SPY closed at $612.93 on February 19, 2025, with an intraday high of $613.23. By February 27, the close had fallen to $585.05. The next day it rebounded 1.6% to $594.18.
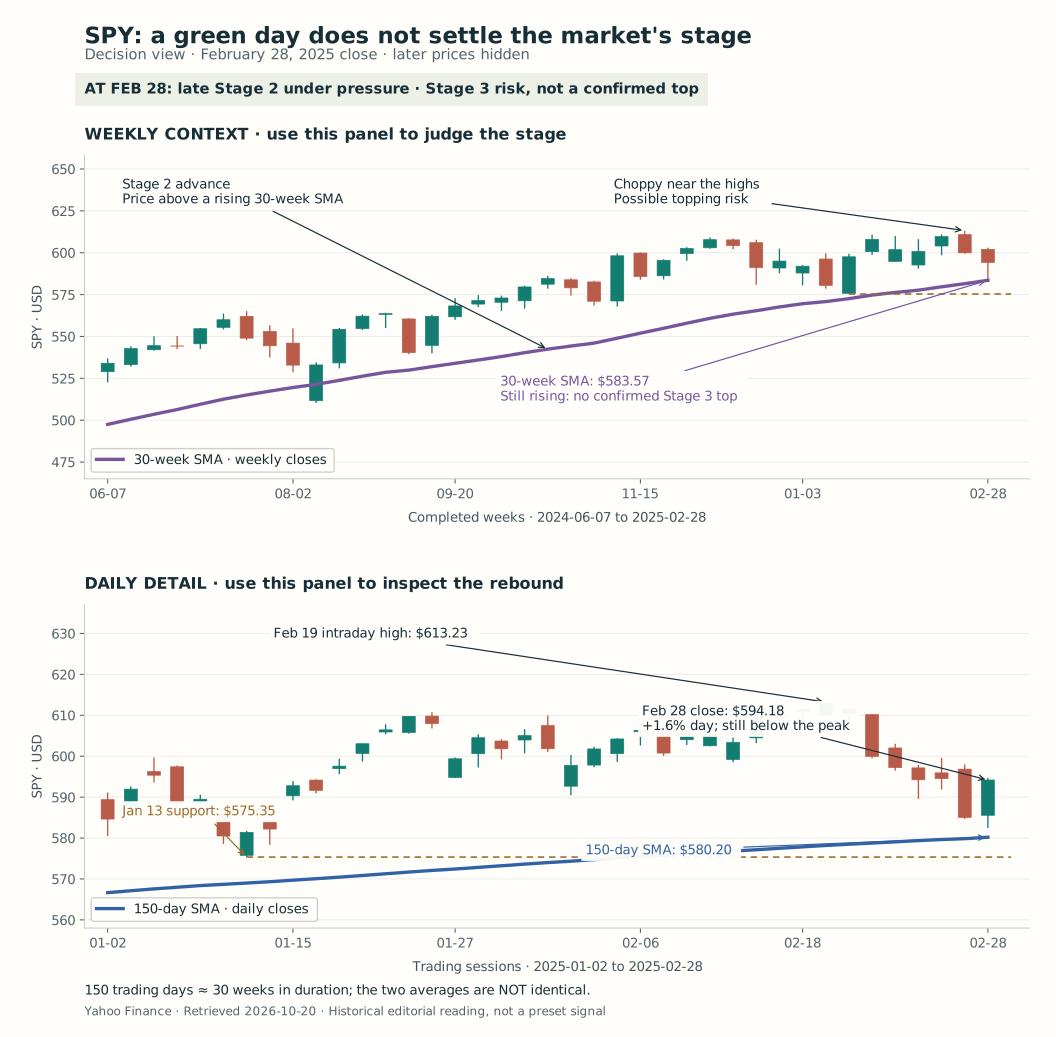
Tap or click either chart to open it at full size.
Read the upper panel first. The earlier advance sits above a rising purple 30-week SMA. Near the right edge, price has become choppier around its highs. That deserves attention, but the average is still rising: from $581.52 on February 21 to $583.57 on February 28. SPY’s $594.18 close remains above it.
So my label at this cutoff is late Stage 2 under pressure, with potential Stage 3 risk. A completed Stage 3 top would overstate the evidence. The flattening average that would strengthen that diagnosis is not there yet.
Now look at the daily panel. The blue 150-day SMA is at $580.20. The horizontal dashed line marks $575.35, the January 13 intraday low, a visible prior support reference. February 28 closes above both. It also remains well below the February peak.
That gives the next review something concrete to track. Can SPY recover the $613.23 peak and sustain progress? Does it keep holding the long-term average and the January support area? Or do rebounds fail while the average begins to flatten? The $575.35 line is a chart reference, not a promise that support will hold or a stop instruction for every stock.
This is the part I appreciate most: the chart lets me stay alert without pretending I already know the ending. One green day has improved the day’s result. It has not answered all three questions.
Reveal the next chapter: when the evidence changed
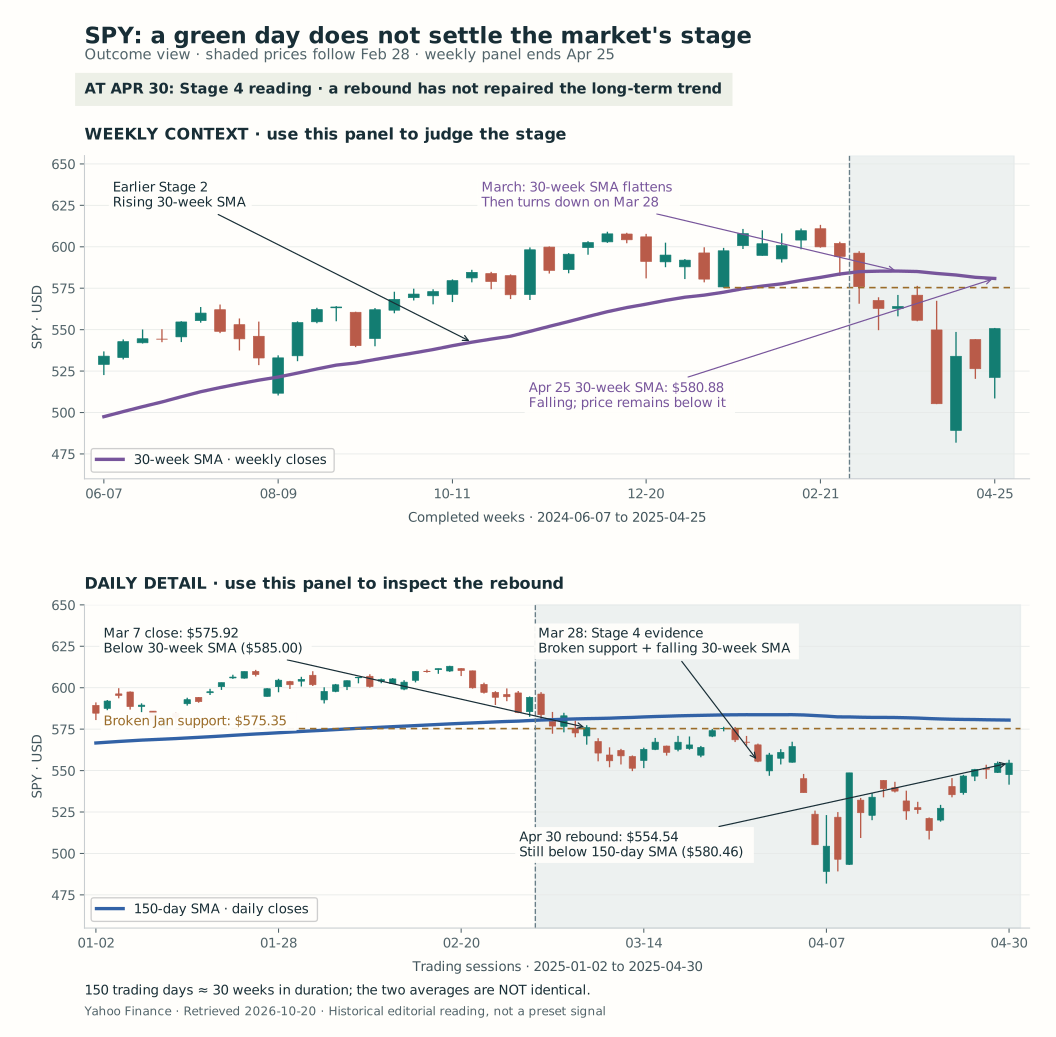
On March 7, SPY’s weekly close was $575.92, below its $585.00 30-week SMA. The average was still rising, and the close remained just above the January $575.35 reference. That was a deterioration worth recording, rather than treating a moving-average cross as a complete diagnosis.
By March 14, the weekly close was $562.81, below both references. The 30-week SMA then barely rose from $585.28 on March 14 to $585.34 on March 21. On March 28, it turned down to $585.08, while SPY closed at $555.66. Broken support, price below the average, and a downward turn in that average now supported a Stage 4 reading.
This transition did not offer months of neat sideways trading around a perfectly flat line. The average flattened as price was already breaking down. Real charts can move between stages much less tidily than a textbook diagram.
SPY eventually closed at $496.48 on April 8, then rebounded to $554.54 on April 30. That recovery still left it below the $580.46 daily 150-day SMA and the $580.88 30-week SMA from the last completed week, April 25. The weekly average was falling. At this historical cutoff, I would still describe the backdrop as Stage 4.
The weekly panel deliberately stops at April 25. April 28–30 appears only in the daily panel because that week had not finished. Treating Wednesday’s close as a completed weekly observation would change the calculation.
Knowing the outcome makes the warning look easier than it was. The useful lesson is the sequence of evidence, not a claim that February 28 predicted the decline.
Turn the index reading into a weekly routine
My takeaway from Weinstein is to make the market review specific enough to affect behavior.
- Start with a completed weekly SPY candle. Write down the close, the 30-week SMA, and whether the line is rising, flattening or falling over recent weeks.
- Mark the price structure. Identify the prior swing high, the support area and any failed rally. Read them alongside the average; a cross by itself leaves too much unanswered.
- State the stage and what could change the assessment. “Above a rising average, but struggling near the highs” is more useful than forcing an uncertain chart into a confident top call.
- Connect that assessment to exposure. A deteriorating backdrop can justify demanding more confirmation, reducing new commitments or pausing new entries within a trading plan. A stronger backdrop creates room to research opportunities; it does not make every breakout worth buying.
Then I look at the stocks. Are the stronger names holding their progress, or are promising breakouts repeatedly failing? Keep those observations dated, including the disappointments. A watchlist quietly edited to retain only the winners tells a comforting story and very little about the decisions available at the time.
SPY provides an S&P 500 market backdrop. It does not measure how broadly stocks are participating, replace a stock’s own setup, or describe every market equally well. Weinstein considers other evidence too; these two moving averages are not his entire method.
For a broader check of market participation, visit AlpharvestPro’s Market Compass. Use its market-breadth snapshot alongside SPY’s weekly stage to assess whether the index’s strength is broadly shared across stocks. Check the displayed data date as part of the same review routine.
The question beside the next rebound becomes much more useful: what changed in the weekly trend, the support structure and the stocks I follow that would justify changing my commitment?
Reading and chart notes
Stan Weinstein, Secrets for Profiting in Bull and Bear Markets, Chapters 2 and 8, particularly the four stages and their application to market averages. The SPY example and stage interpretations are our application; they are not examples or signals from the book.
SPY, USD. Weekly context begins June 7, 2024; daily detail begins January 2, 2025. Decision cutoff: February 28, 2025 close. Later daily prices end April 30; completed weekly prices end April 25. The 150-day SMA is a daily proxy, not an exact 30-week SMA. Prices exclude dividends. Historical example selected retrospectively.

