
A position can fit a spreadsheet and still occupy too much of your life.
You check the quote during dinner. A routine pullback interrupts your concentration. Suddenly, a small change in the stock feels like a verdict on your judgment. That feeling deserves investigation, although it is not a reliable sizing formula by itself.
Reading the position-sizing section of Think and Trade Like a Champion, I am struck by how quickly the discussion moves beyond enthusiasm for the stock. Minervini connects the amount owned with the planned exit, experience, concentration, and the possibility of a gap. In Momentum Masters, the speakers describe different risk practices. The disagreement is useful: there is no shared percentage that makes every trader, stock, and market condition equivalent.
My takeaway is to give enthusiasm a smaller job. It can motivate the research. It should not determine the share count.
CPAY: use the bar that shows strength returning
Corpay (NYSE: CPAY) appeared in AlpharvestPro’s AVWAP Pullback Reclaim (Brian Shannon) preset on October 15, 2026. The database’s dated screening record confirms that match. What interests me is the price sequence behind it.
On October 14, CPAY traded as low as $389.76 and closed at $393.02, below the anchored VWAP shown in purple. On October 15, it rebounded: the day’s range ran from $395.95 to $406.25, and it closed at $406.20, almost at the high and back above AVWAP.
That October 15 candle is the strength bar we will use for the entry comparison. Brian Shannon’s discussion of strength after a dip captures the broader idea: wait for evidence that buying is returning after the pullback.
Consider two hypothetical entries within that strength bar:
- Near the bar’s high: $406.25.
- At the bar’s midpoint: $401.10. Here, midpoint means halfway between the session’s high and low:
($406.25 + $395.95) ÷ 2 = $401.10.
For both examples, use the same hypothetical stop-loss at $388.90. The October 14 pullback low is $389.76, so this leaves a $0.86 buffer below that visible reference. I want to allow some room for a brief undercut before treating the recovery as failed. Choose that room before entry, then size the position for the full distance to the stop.
Short-term price fluctuations can trigger stop orders, as the SEC’s stop-order explanation notes. A buffer gives the setup more room around the low, but it cannot guarantee protection from a stop-out. These daily bars do not identify who is trading around that level or establish deliberate institutional or algorithmic stop hunting. The $0.86 buffer is an illustration, not an optimized setting.
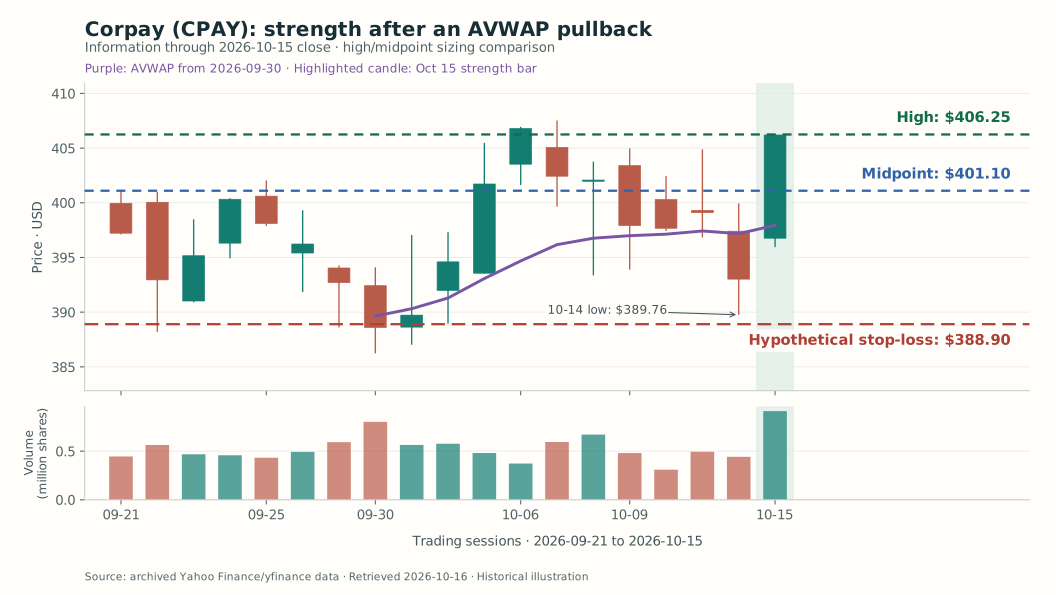
Green marks the strength bar’s $406.25 high; blue marks its $401.10 midpoint. Measure each entry down to the same red stop line at $388.90. The distances are $17.35 and $12.20 per share.
These are retrospective sizing examples using the completed daily bar. Its final high, low and screening match do not establish what was known intraday or whether either fill was available after an entry signal. An entry around the midpoint would still need evidence of renewed strength at the time. Simply touching that price would not be enough.
Same stock, same stop, different share count
Suppose the account holds $40,000 and the trader chooses 1%, or $400, as the planned-loss budget for this exercise. Those are hypothetical account inputs.
The calculation is risk budget ÷ (entry price − stop price), rounded down to whole shares.
| Part of the calculation | Entry near the bar’s high | Entry at the bar’s midpoint |
|---|---|---|
| Entry reference | $406.25 | $401.10 |
| Same stop-loss | $388.90 | $388.90 |
| Planned risk per share | $17.35 | $12.20 |
| Whole shares within a $400 budget | 23 shares | 32 shares |
| Position value | $9,343.75 | $12,835.20 |
| Planned loss if filled at the stop price | $399.05 | $390.40 |
| Percentage of the $40,000 account invested | 23.4% | 32.1% |
At the high, $400 ÷ $17.35 allows 23 shares. At the midpoint, $400 ÷ $12.20 allows 32 shares. One more share would exceed the budget in either case: 24 shares at the high would risk $416.40; 33 shares at the midpoint would risk $402.60, assuming the stated entry and stop fills.
The midpoint example allows 9 more shares because each share has less distance to the same stop. The planned dollar losses stay close to $400.
This is the part of Minervini’s discussion that stays with me. A stock can look equally attractive in both examples, yet the share count changes materially with the entry. If the available entry moves higher, I have to redo the calculation rather than carry over the larger share count.
There is another tradeoff in the table. The midpoint example uses 32.1% of the account, compared with 23.4% near the high. Similar planned price risk can still mean different capital concentration. Available cash, other holdings and execution costs may justify taking fewer shares than either calculation permits.
A lower entry is useful only when the setup still supports it. The sizing arithmetic cannot supply the missing evidence of strength.
Try both entries in the calculator
Open the AlpharvestPro position-size calculator on the main website. If it opens in Japanese, use the dashboard’s JA / EN button above the calculator.
- Set Account Equity to
40000and Market to US (USD). - Set Risk per Trade to 1.00%, enter
CPAYin the optional ticker field, and select Long. - For the high-entry example, enter Entry Price
406.25and Stop Loss Price388.90. The US board lot is 1 share. - Click Calculate. Check 23 shares, $17.35 risk per share, and $399.05 calculated risk against the table.
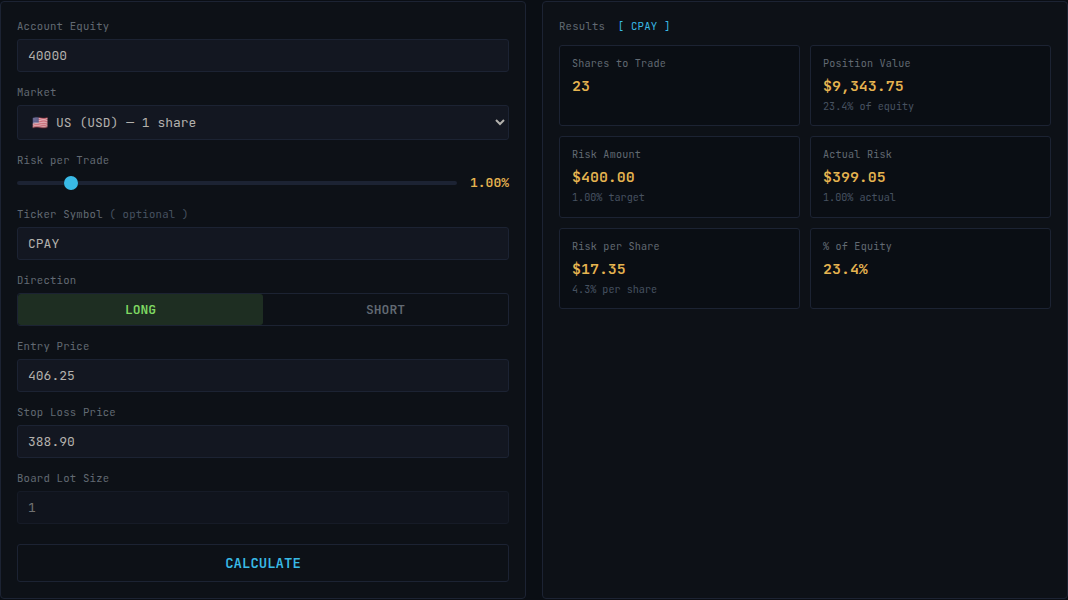
High-entry example: $406.25 entry, $388.90 stop, 23 shares. “Risk Amount” is the $400 budget; “Actual Risk” is the $399.05 calculated exposure at the entered prices, before costs or slippage.
Now change only Entry Price to 401.10, leave the stop at $388.90, and click Calculate again. The result becomes 32 shares, $12.20 risk per share, and $390.40 calculated risk.
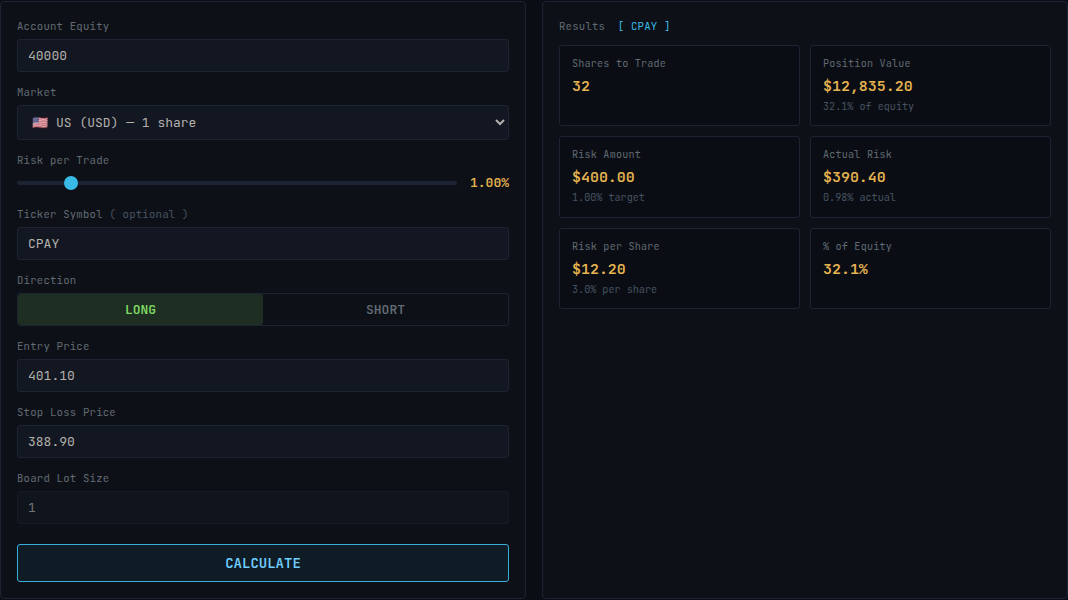
Midpoint-entry example: $401.10 entry, $388.90 stop, 32 shares. Both screenshots were captured from the live public calculator on October 16, 2026, with hypothetical inputs. Click either image to enlarge it.
I find this a useful pause before the order ticket. It puts the entry, the failure point and the money at risk in the same view. Moving the stop closer just to get a bigger share count defeats the exercise; the chart needs to justify the stop first.
The stop is a plan the market still has to execute
The $399.05 and $390.40 figures assume buying at the respective entry prices and selling every share at $388.90, before costs. A gap or slippage can make the actual loss larger. Investor.gov explains that a triggered stop order becomes a market order, whose execution price is not guaranteed. Read the order mechanics.
That limitation connects directly with Minervini’s discussion of gaps beyond stops. It is also why the liquidity passages in Momentum Masters and Morales and Kacher’s work belong beside the sizing arithmetic. Yesterday’s trading activity cannot promise tomorrow’s exit.
The useful habit is simple: identify the strength you want to buy, decide where the idea would fail, then calculate size from the entry you can actually obtain. Conviction does not become more credible because more money is attached to it.
Reading and chart notes
Mark Minervini, Think and Trade Like a Champion, Section 8, including the discussion of gaps beyond stops. Momentum Masters, Minervini’s answers S2-2 and S8-1/S8-2; the other speakers retain their own approaches. Gil Morales and Chris Kacher, Trade Like an O’Neil Disciple, Chapter 6, liquidity in short-selling. The Shannon link above supplies additional public context for the entry discussion; the CPAY examples are original illustrations, not trades attributed to any of these authors.
Corpay (NYSE: CPAY), USD; September 21–October 15, 2026. AVWAP uses the stored September 30 anchor. The entry references use the October 15 bar’s high and high–low midpoint, rounded to cents; the common stop includes a $0.86 buffer below the October 14 low. These are alternative hypothetical fills, not two positions held together or claimed executions. The preset match is an end-of-day observation. No intraday alert, fill sequence or later outcome is asserted. The account inputs and stop are illustrative; private preset settings are not reproduced. Sources and arithmetic are in the chart notes.
Chart methodology and limitations
Charts were drawn by AlpharvestPro from the existing Yahoo Finance/yfinance-derived daily price archive. Candles use the stored open, high, low and close fields, not the separate adjusted-close field. Volume is in millions of shares. Non-trading days are compressed. This is a later-retrieved archive; historical adjustments can differ from prices originally quoted. A selected chart is an illustration, not a backtest.
For CPAY, the chart ends October 15, 2026; its source extract was retrieved October 16. AVWAP accumulates volume-weighted typical price, (high + low + close) / 3, from the recorded September 30 anchor, including each session through the cutoff. No later bars enter this calculation. Entry examples use the completed October 15 bar; they do not establish intraday signal timing or fills.
Educational commentary; not personalized investment advice or a buy/sell recommendation.