
What Is a Stage Rotation Map? A Four-Stage Market Guideステージ・ローテーション・マップとは?4ステージ市場ガイド
What a Stage Rotation Map Shows
A Stage Rotation Map is a research visualization for comparing market structure across major indices, sectors, themes, or ETF groups. Each point represents one series. Its location summarizes two related questions: is the long-term trend rising or falling, and is price positioned above or below that trend? An eight-week trail shows how the series arrived at its current position.
The map is descriptive rather than predictive. It does not estimate future returns, issue entries, or recommend securities. Its job is to put many series into the same visual frame so a researcher can compare direction, position, and change over time.
The Four Weinstein Stages
The stage names follow Stan Weinstein’s framework in Secrets for Profiting in Bull and Bear Markets.
| Stage | Name | Structural reading |
|---|---|---|
| Stage 1 | Basing | The long-term trend is relatively flat while price forms a base around it. |
| Stage 2 | Advancing | Price and the long-term trend are moving in an advancing structure. |
| Stage 3 | Topping | Price is losing its prior advancing structure while the long-term trend has not fully turned down. |
| Stage 4 | Declining | Price and the long-term trend are moving in a declining structure. |
The stage badge is the classifier’s authoritative output. A point can sit near a quadrant boundary while retaining its current stage; that disagreement is useful transition context, not an error. AlpharvestPro keeps the classifier’s numeric calibration internal.
How to Read the Axes and Trail
The horizontal axis represents the direction of the long-term trend. Moving right means that trend is strengthening; moving left means it is weakening. The vertical axis represents price’s position relative to the same trend. Moving up means price is farther above it; moving down means price is below it.
Read three things together:
- Current stage — the point color and stage label describe the present structural classification.
- Current position — the point’s location shows trend direction and price position on a shared scale.
- Eight-week trail — the path shows whether the series is moving toward, away from, or along a stage boundary.
Always check the as-of date printed inside the map. Markets observe different holidays and source data can complete at different times, so two market maps do not always share the same final trading date.
Worked Example: Thematic ETF Groups
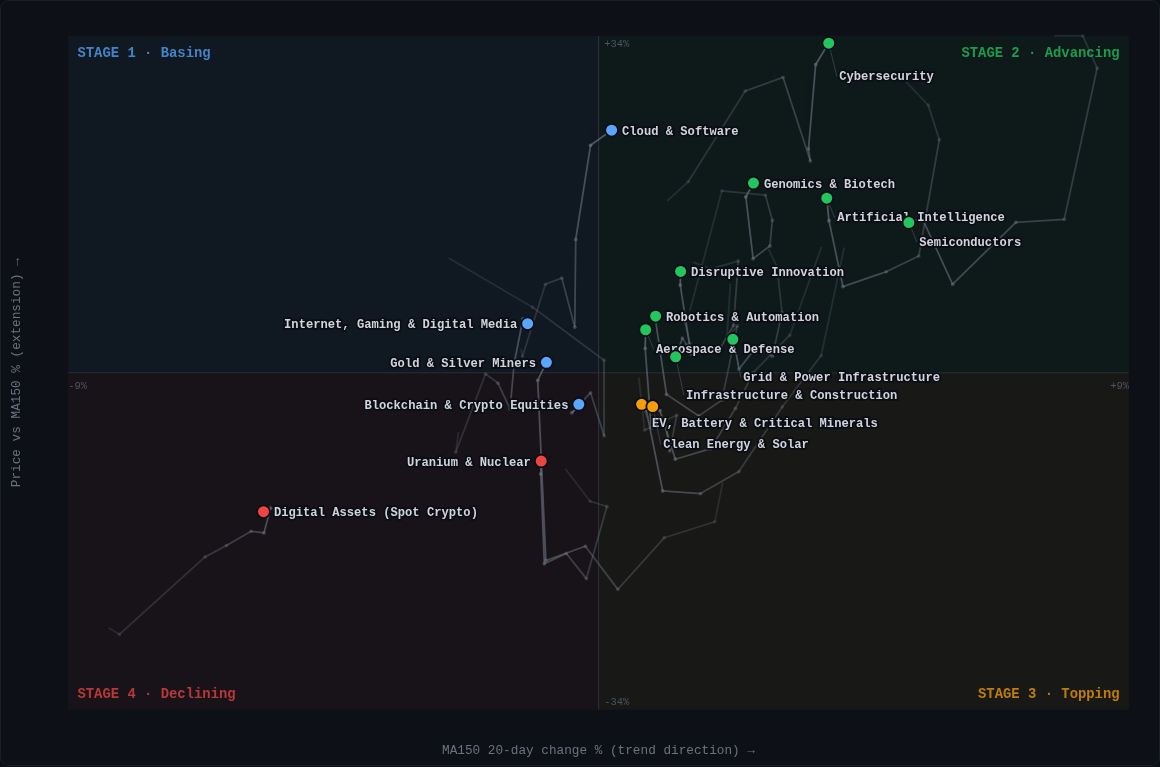
Suppose a thematic ETF group is labeled Stage 2 and its trail moves right while remaining above the horizontal center. The map is describing an advancing structure whose long-term trend direction has strengthened during the displayed weeks. If the trail later bends left or down, that describes a change in structure; it does not by itself predict the next return.
Compare the map with the accompanying ranking table and heatmap. The ranking supplies current relative context, the heatmap shows the session’s breadth, and the Stage Rotation Map supplies the longer-horizon path. No single view should be treated as a stand-alone signal.
Explore the Live Maps
- US thematic ETF rankings and Stage Rotation Map — 17 thematic ETF groups.
- US ETF Momentum Dashboard — the dated US ETF universe and broad category rankings.
- US and Japan heatmaps + Stage Rotation Maps — S&P 500 and JPX-Nikkei 400 display page.
- Taiwan and Hong Kong heatmaps + Stage Rotation Maps — TW200 and HSLMI display page.
- Four-market map hub — links to all display surfaces.
- How to Read Stock Market Heatmaps — daily breadth and sector context.
The four-market rotation set covers 60 major-index, sector, and thematic series: 21 US, 22 Japan, 9 Taiwan, and 8 Hong Kong. Counts describe the published comparison set, not an investable universe or performance claim.
FAQ
Is a Stage Rotation Map a forecast?
No. It describes current and recent market structure. It does not estimate future returns or predict when a stage will change.
Why can a point and its quadrant appear to disagree?
The point color comes from the stage classifier, while position comes from two continuous measurements. Near a boundary, the two can differ temporarily; that is transition context rather than a rendering error.
How often do the maps update?
They refresh after the relevant source market data completes. Use the as-of date inside each map rather than assuming all markets share one date.
Is the map investment advice or a trading signal?
No. It is an educational research visualization for comparing structure and momentum. It is not a recommendation, solicitation, forecast, or trading signal.
ステージ・ローテーション・マップが示すもの
ステージ・ローテーション・マップは、主要指数、セクター、テーマ、ETFグループの市場構造を比較する研究用の可視化です。各点が1つの系列を表し、その位置は「長期トレンドが上向きか下向きか」と「価格がそのトレンドより上か下か」という2つの問いを同時に示します。8週間の軌跡から、現在位置に至るまでの移動も確認できます。
この地図は記述的なもので、予測ではありません。将来リターンの推定、エントリー指示、銘柄推奨は行いません。複数の系列を同じ枠内に置き、方向、位置、時間経過による変化を比較しやすくすることが目的です。
Weinsteinの4ステージ
ステージ名は、Stan Weinsteinの著書 Secrets for Profiting in Bull and Bear Markets の枠組みに基づきます。
| ステージ | 名称 | 構造上の読み方 |
|---|---|---|
| Stage 1 | 底固め | 長期トレンドが比較的横ばいで、価格がその周辺でベースを形成する局面。 |
| Stage 2 | 上昇局面 | 価格と長期トレンドが上昇構造にある局面。 |
| Stage 3 | 天井圏 | 価格が従来の上昇構造を失いつつ、長期トレンドがまだ完全には下向いていない局面。 |
| Stage 4 | 下降局面 | 価格と長期トレンドが下降構造にある局面。 |
ステージバッジは分類器の正式な出力です。点が象限の境界付近にある間は、位置とステージが一時的に一致しないことがあります。これは表示エラーではなく、移行を理解するための文脈です。分類器の数値キャリブレーションは内部情報として公開しません。
軸と8週間の軌跡の読み方
横軸は長期トレンドの方向を表します。右への移動はトレンド方向の強まり、左への移動は弱まりを示します。縦軸は同じ長期トレンドに対する価格の位置を表します。上は価格がトレンドより上、下はトレンドより下にあることを示します。
次の3点を併せて読みます。
- 現在のステージ — 点の色とラベルが現在の構造分類を示します。
- 現在位置 — 点の位置が長期トレンドの方向と価格の位置を共通尺度で示します。
- 8週間の軌跡 — 系列がステージ境界へ近づいているか、離れているか、沿って動いているかを示します。
地図内の基準日は必ず確認してください。市場ごとに祝日が異なり、元データの完了時刻も異なるため、複数市場の最終取引日が常に一致するとは限りません。
例:テーマETFグループ
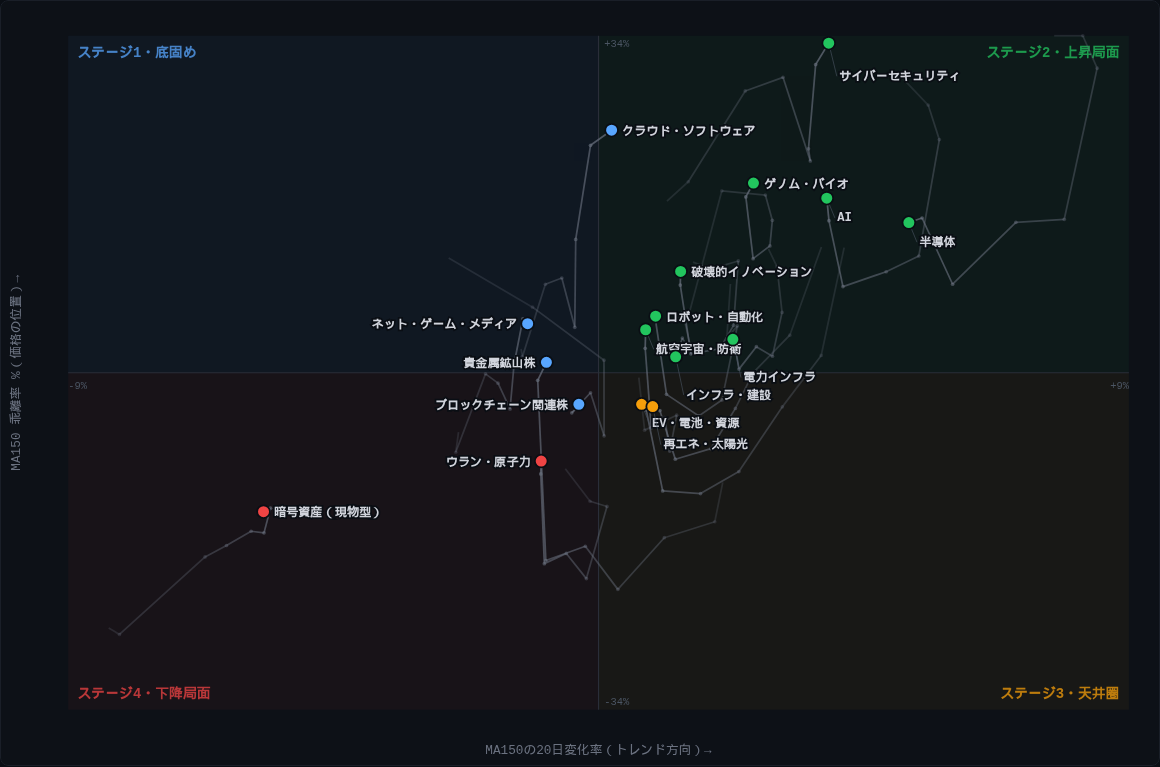
あるテーマETFグループがStage 2で、横軸中央より上を保ちながら軌跡が右へ進んでいるとします。地図は、表示期間中に長期トレンド方向が強まった上昇構造を記述しています。その後、軌跡が左または下へ曲がれば構造の変化を示しますが、それだけで次のリターンを予測するものではありません。
ランキング表とヒートマップも併せて確認します。ランキングは現在の相対的な位置、ヒートマップは当日の市場の広がり、ステージ・ローテーション・マップは長期の軌跡を示します。いずれか1つを単独の売買シグナルとして扱うものではありません。
公開中の地図
- 米国テーマETFランキングとステージ・ローテーション — 17のテーマETFグループ。
- 米国ETFモメンタムダッシュボード — 米国ETFの対象銘柄群と大分類ランキング。
- 米国・日本のヒートマップとステージ・ローテーション — S&P 500とJPX日経400。
- 台湾・香港のヒートマップとステージ・ローテーション — TW200とHSLMI。
- 4市場の地図ハブ — すべての表示ページへの入口。
- 株式市場ヒートマップの読み方 — 当日の市場の広がりとセクター文脈。
4市場版は、米国21、日本22、台湾9、香港8の計60系列を比較します。この数は公開されている比較セットを示すもので、投資可能ユニバースや運用成績を意味しません。
よくある質問
ステージ・ローテーション・マップは予測ですか?
いいえ。現在および直近の市場構造を記述します。将来リターンやステージ変更の時期を予測しません。
点の色と象限が一致しないことがあるのはなぜですか?
点の色はステージ分類器、位置は2つの連続的な測定値から決まります。境界付近では一時的に異なることがあり、表示エラーではなく移行の文脈です。
地図はいつ更新されますか?
該当市場の元データ処理が完了した後に更新されます。全市場が同じ日付だと仮定せず、各地図内の基準日を確認してください。
投資助言や売買シグナルですか?
いいえ。市場構造とモメンタムを比較する教育・研究用の可視化であり、推奨、勧誘、予測、売買シグナルではありません。
This content is for educational and informational purposes only. It does not constitute financial advice, investment recommendations, or solicitation to buy or sell securities.
AlpharvestPro VIP | Japan & US Reports | Taiwan & HK Reports